Abstract—One of the most difficult, yet important, issues that a f irm must decide is how much to charge f or its product/ service. Furthermore, considering the pressure of the developing technologies that shif ts the consumers away f rom traditional distribution channels towards the Internet-based distribution channels, determining the most appropriate pricing strategy becomes a more challenging task. In this paper, a generalized f ramework is proposed f rom the perspective of a f irm that needs to decide on its pricing strategy f or each of the possible market scenario. The f ramework allows the f irm to compute the estimated prof it in each scenario and then choose the most prof itable one.
Index Terms—Pricing strategy, competitive market model, game theory, genetic algorithm
I. INTRODUCTION
HE rapid global diffusion of broadband Internet access and new technologies has had an influence on shifting the consumers away from traditional stores and products towards electronic shops and digital products [1]. Furthermore, the emergence of service-oriented technologies such as peer-to-peer networks provide evidence of the opportunities and challenges the Internet offers. Although there are many successful companies like eBay, Amazon or Google, it has been observed that many businesses that failed because of choosing the wrong marketing strategies. In this regard, it is important to choose the most appropriate business model and marketing strategy. In a recent study, the author has proposed a strategic market analysis framework, especially for the electronic publishing market [2]. In this paper, the author has generalized the previously proposed model to be able to apply in any type of electronic service business. In this environment, a product/ service provider is assumed to face different scenarios. In each of these scenarios, it aims at finding the optimum unit prices for its product/ service and accordingly its demand and profit. The scenario which it receives the highest profit is assumed to be the most appropriate market strategy for this provider. Hence, the framework is proposed as a decision support tool for the provider.
Gülfem I. Alptekin is with Galatasaray University , Department of Com puter Engineering, Ciragan Cad. No:36 34357 Ortakoy , Istanbul TURKEY (phone: +902122274480/427; fax:+902122595557; e -m ail: [email protected]).
These types of decision support tools may help companies to optimize their marketing strategies, since many companies have no reliable way to determine whether their marketing money has been spent effectively, and their return on investment is often not evaluated in a systematic manner [3].The providers in the market need to make their decision simultaneously and in an uncertain environment. As the methodologies, game theory and probabilistic theory are used to deal with these conditions. Each scenario necessitates solving the related game, which means determining the mutual best response strategies. In some maximization problems, it is not possible to prove the convexity of the objective function. This happens when there is more than one type of prices to determine. In the proposed framework, one of the well-known heuristics, the genetic algorithm (GA), is used to find sub-optimal solutions.
The rest of the paper is organized as follows. Section 2 discusses the related work in the literature. Section 3 gives brief introductions to the two main methodologies that constitute the framework: the game theory and the GA. In Section 4, the formulation of the model, three possible market scenarios and their solutions are given in detail. Finally, discussions and conclusions are given in Section 5.
II. RELATED LITERATURE
As the related literature, let us present several models which are proposed for determining or optimizing the marketing strategy. One of the research has developed computational models of customer buying behavior in order to determine and leverage the value generated by a customer within a given time frame [3]. They have created a commercial optimization tool for this purpose and have applied it to optimize a European airline’s CRM process. Albers and Clement have not proposed a decision support framework but, their work has concentrated on the impact of marketing strategies and chosen business models [1]. Bernstein et al. use a probability-based model for the equilibrium analysis of retailers [4]. They differentiate retailers’ choices as “ bricks-and-mortar” and “ clicks-and-mortar”, which represent the traditional retail channel and Internet channel, respectively. Their study has some common grounds with the one in this paper, since they analyze the supply chain channel structure choice in an oligopoly setting.
III. METHODOLOGIES A. Game Theory
Game theory has been recognized as a cornerstone of micro-economics that can be applied to analyze problems with
A Conceptual Framework for Analyzing
Pricing Strategies
Gülfem I. Alptekin
conflicting objectives and interactive decision makers [5]. It provides us well defined equilibrium criteria to measure game optimality under various scenarios [6]. The ability of game theory to model individual, independent decision makers whose actions potentially affect all other decision makers makes game theory particularly attractive to analyze the performance of such types of situations.
A game is made up of three components: A finite set of players (decision makers) N = {1, 2, …, n}, a set of strategies, S = {s1, s2, …, sn}, available to those players, and
the set of payoffs (utilities), {ui} ={u1, u2, .., un}, for each
combination of strategies that the players wish to maximize. Each player’s utility function, ui, is a function of the particular
strategy chosen by player i, si, and the particular strategies
chosen by all of the other players in the game, s-i. In many
cases, the payoff function is represented by a utility function, which assigns a number to each possible outcome, with higher utilities representing more desirable outcomes. Player i prefers the strategy
s
i overs
i
, ifu s
i
i
u s
i
i
.A fundamental concept for normal form games is the Nash Equilibrium (NE) [7].
Definition 1: A strategy profile si is said to be a NE, iff
i
N
,u s
i
i
u s s
i
i
,
i
,
s
i
S
i.In other words, a NE is a strategy profile where no player can improve its utility with a unilateral deviation [8]. It corresponds to the steady-state of the game and is predicted as the most probable outcome of the game [9]. The game structures in which the players do not have the option of planning as a group in advance of choosing their actions are called non-cooperative games. It does not mean that the players cannot cooperate, but any cooperation must be self-enforcing.
B. Genetic Algorithm
The genetic algorithm is a search heuristic that is inspired from the process of Darwinian evolutionary ideas of natural selection and genetic [10] [11]. It has been recognized as a general search strategy and an optimization method. GA begin with a set of k randomly generated states/chromosomes which is called the population. Each chromosome, or each individual in the population, is represented as a string over a finite alphabet (most commonly, a string of 0s and 1s) and each chromosome encodes a solution of the problem. New generations are produced using a fitness function that is an evaluation function that the chromosomes are rated in each state. Better state returns higher fitness function values and the objective is to convey more successful/ fitter chromosomes to new generations. The fitness is used to judge how much a solution is near the optimum solution. Two genetic operators, crossover and mutation, are utilized to produce a new generation. For each new population (solution), a pair of parent solutions is selected for breeding a new generation. Crossover may be considered as the main engine for exploration in the GA. The idea behind crossover is that the new chromosome may be better than both of the parents if it takes the best characteristics from each of the parents. The crossover
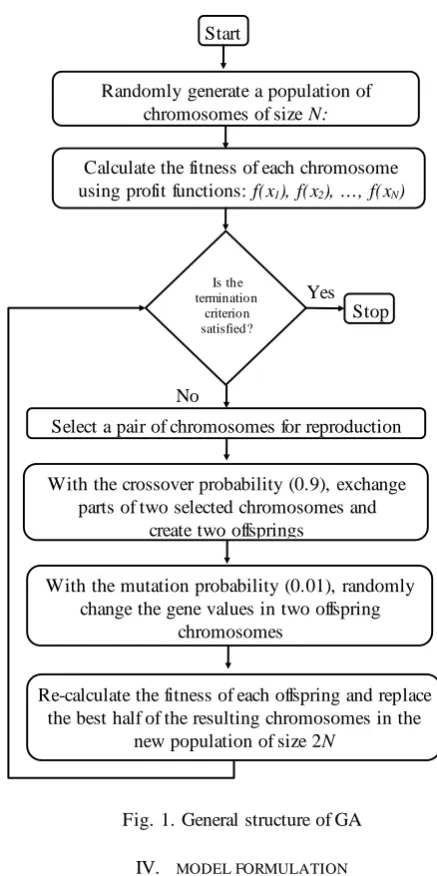
[image:2.595.306.525.258.697.2]picked for reproduction. For instance, a crossover probability of 1.0 indicates that all the selected chromosomes are used in reproduction. If all generations are produced by using the crossover operator, there may be the same value for the same gene in all the chromosomes. Mutation operator is used to create some genetic diversity by altering one or more gene values in a chromosome from its initial state. Hence, the GA may be able to arrive at a better solution. Mutation occurs during evolution according to a user-defined mutation probability. Mutation probability represents how often the genes of chromosomes will mutate. For instance, a mutation probability of 1.0 indicates that whole chromosome is changed, whereas a mutation probability of 0 indicates that nothing is changed. The objective of mutation operator is to prevent remaining into a local optimum point. The general structure of the GA is summarized in Fig. 1.
Fig. 1. General structure of GA IV. MODEL FORMULATION A. Utility and Demand Model
The competitive environment where the providers are the main players is modeled as an n-firm oligopoly [8]. The proposed game consists of more than one provider that want to reach more customers by selling their products. Each provider is assumed to have two opportunities: Continuing to their
Start
Randomly generate a population of chromosomes of size N:
x1, x2, ..., xN
Calculate the fitness of each chromosome using profit functions: f(x1), f(x2), ..., f(xN)
Is the termination
criterion satisfied?
Select a pair of chromosomes for reproduction No
With the crossover probability (0.9), exchange parts of two selected chromosomes and
create two offsprings
With the mutation probability (0.01), randomly change the gene values in two offspring
chromosomes
Re-calculate the fitness of each offspring and replace the best half of the resulting chromosomes in the
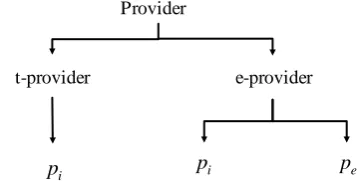
traditional producing business or switching to a new distribution channel. Usually, this new distribution channel is the Internet channel. So, the traditional providers are called t-provider, whereas the Internet-based providers are called e-provider. The t-provideri will continue to sell its product from
its physical store; however the e-provideri will have two
channels, hence two different prices (Fig. 2).
The pi represents the unit retail price of two types of
provider and the pei represents the unit Internet price of the
e-provideri. An assumption on these prices states that the unit
[image:3.595.80.259.237.330.2]Internet price is lower than the unit retail price, because of the lower maintenance or stocking costs, peipi. A = {1, 2, …, n}A0 denotes the set of providers.
Fig. 2. Provider types in the market
In order to differentiate the products of different channels, a customer is assumed to derive a different utility when obtaining the book from a retailer’s physical store than obtaining it from the Internet channel [4]. Furthermore, a customer is assumed to have a no-purchase alternative (A0).
Then, the set of alternatives is AT = {1, 2, …, n}
A0 whenall the providers sell from their retail stores, while it is AE = {1, e1, 2, e2, …, n, en}
A0 when all providers sell bothfrom their retail stores and their online stores. It is also possible to have a case with k e-providers and (n-k) t-publishers, then the set of alternatives is AET(k) = {1, e1, …, k, ek, k+1, …, n}.
A provider, in order to determine its unit price, needs first to determine its expected demand. In other words, it needs to find the probability that a customer selects its product i from a subset A. Doing so, the MNL model which is one of the random-utility models that are based on a probabilistic model of customer utility, is used [12]. Therefore, if the utility is assumed to be linear in price with u = -bp, following demand function can be given [12] [13]:
( )
1
bp
bp
e
d p
N
e
(1)where N is the market size and b is a coefficient of the price sensitivity. In the multiple-product case, the demand function is given by:
1
( )
,
1, ....,
1
j j
i i b p
j n
b p
i
e
d
p
N
j
n
e
(2)
In the proposed model, bj is defined as the positive constant
that represents to what extent the customers are influenced from price offered by provideri. In other words, it denotes the
elasticity of their demand function. If bj is high, the elasticity
of the demand increases. This means that the customer is more sensitive to the increase/ decrease in price. The market size (N) is thought as the number of customers in the market that require products. Besides, the demand coming from a customer is assumed to showsa linearly decreasing trend, when the price offered by provideri increases.
For instance, let us assume that a provider, whose customers faces three different price offers for their required product from three different provider in the market; where bj =
0.15, p1 = 3, p2 = 4 and p3 = 6. Then, the probability that the
given customer chooses to buy the product from three different providers and the probability that the customer does not buy any spectrum band are given respectively, as:
1 0.15.3 0.15.30.15.4 0.15.6Prob 0.342
1
e p
e e e
2 0.15.3 0.15.40.15.4 0.15.6Prob 0.294
1
e p
e e e
3 0.15.3 0.15.60.15.4 0.15.6Prob 0.218
1
e p
e e e
0
Prob 1 0.3420.2940.2180.145
These results can also be interpreted as provider1 will offer
the 34.2%, provider2 will offer the 29.4% and provider3 will
offer the 21.8% of the total demand of the customers. B. Building Market Scenarios
In the proposed pricing strategy analysis, the possible market scenarios are built from the perspective of a traditional provider that intends to move to a different business, including a new distribution channel. These three scenarios are summarized in Table 1, where k
1,2,..,n
represents the number of providers that moves to e-providing [4].TABLE I. DIFFERENT MARKET SCENARIOS
P
rovi
de
rs
1,
.
..
,
k
Providers k+1, ...., n
T E
T Scenario I Scenario II
E Scenario II Scenario III
Scenario I represents the scenario where all providers in the market remain in the traditional business. Scenario II gives the condition where some providers remain in the traditional business, but the rest moves to e-providing. Scenario II represents the scenario where all providers in the market move to e-providing.
Provider
t-provider e-provider
i
C. Analyzing Each Scenario
The t-provider that is faced with three market scenarios need to analyze its profit in each of these scenarios. The reason is that, all providers set their unit prices simultaneously and the t-provider needs to determine which scenario is more profitable for it. Doing so, the first step is to write an objective function and its constraints in order to define its optimum price.
For the Scenario I, the set of alternatives for the customers is
1, 2,...,
0I
A
n
A
. Each t-provider’s aim is to define its own optimum price that maximizes its profit:
.. 1
max
max
.
1
s.t.
0,
0,
I i
I I I
i i
t b p
I I
i i i n
p p b p
t I i i I i
e
p
c
M
e
p
c
i
p
i
(3)where b is the price elasticity and ci is the unit cost of
t-provideri.
In the Scenario II, the first
k
1
k
n
providers are assumed to be move on e-providing, whereas the remaining n-k providers are stayed as t-provider. The set of alternatives forconsumers is . The
t-provideri determines only one price (
p
iII), but e-provideridetermines both a price for its retail store (
p
iII) and a price for its Internet channel (p
eiII). The t-provider’s price is assumed to be influenced from other t-provider’s prices, whereas the e-provider’s price is influenced from both other e-provider’ prices and from the price of its own traditional channel. In other words, if e-provideri increases its Internet channel price (p
eiII),the demand to its traditional channel increases. From this point of view, two channels of an e-provider can be considered as “ competing” [4]. Both type of providers’ aim is to define their optimum prices (
p
iIIandp
eiII) that maximize their profits. T-providerj wants to maximize its profit:
.. 1
max
max
.
1
s.t.
0,
1,
2, ...,
0,
1,
2, ...,
II j
II II
II
j j t
b p
II II
j j j n
p p b p
t k II j j II j
e
p
c
M
e
p
c
j
k
k
n
p
j
k
k
n
(4)On the other hand, the objective of e-provideri is to choose II
i
p
andp
eiII that maximizes its own profit:
. . . 1 . . . 1max
max
.
1
.
1
s.t.
0,
0,
(5)
0,
0,
II i II EP II IIei ei t ei
II ei II II et i b p II II
ei i i n
p p b p b p
t
b p II
ei ei k
b p b p
t II i i II ei ei II II i ei
e
p
c
M
e
e
e
p
c
M
e
e
p
c
i
p
c
i
p
p
i
The first term of the profit function belongs to the profit earned from t-providing, while the second term belongs to the profit earned from e-providing. In the proposed model, the coefficient
1
is inserted to the demand function because an e-customer’s sensitivity to price is assumed to be higher than the one of a traditional customer.In the Scenario III, it is assumed that all n providers in the market adopt e-providing. The set of alternatives is thenAIII
1, 1, 2, 2..., ,e e n en
A0. All e-providers determine two prices: A price for their traditional channel (p
iIII) and a price for their Internet channel (p
eiIII). The e-providing price of an e-provider is assumed to be influenced from both the competitor’s e-providing price and its own t-providing price. Hence, two channels of each e-provider can be considered as “ competing”, just like in the previous scenario. Each e-provider’s aim is to define its optimum prices ( IIIi
p
andp
eiIII) in the given market environment that maximizes its own profit:
. , , . . 1 . . . 1max
max
.
1
.
1
s.t.
0,
0,
(6)
III i III III III IIIIII III
i ei i ei
t ei III ei III III et i b p III III
i i i n
p p p p b p b p
t
b p III
ei ei k
b p b p
t III i i III ei ei III i
e
p
c
M
e
e
e
p
c
M
e
e
p
c
i
p
c
i
p
0,
p
eiIII
0,
i
D. Finding the Solutions of the Scenarios
games means predicting the strategy of the providers. One can see that if the strategies from the players are mutual best responses to each other, no player would have to deviate from the given strategies and the game would reach a steady state. Such a point is called the Nash equilibrium (NE) point of the game [7]. In each of the three game settings, t-providers determine their prices independently and the information is strictly limited to local information. Hence, these games have non-cooperative setup.
Global optimality conditions are used in order to analyze the existence and the uniqueness of each equilibrium point. A convex optimization problem is defined as a problem where all of the constraints are convex functions, and the objective is a convex function if minimizing, or a concave function if maximizing [14]. With a convex objective and a convex feasible region, there can only be only one optimum solution, which is globally optimum. Furthermore, a function f is concave if –f is convex. The constraints in the proposed problems (3, 4, 5, 6) are linear, so they are convexes.
At this point, there are two conditions: If it is possible to derive closed-form expressions for the equilibrium prices, then they can be solved using a linear programming tool. If it is not possible to derive closed-form expressions for the equilibrium prices, this means that the convexity of the related maximization problem cannot be demonstrated. It is the case in the objective functions (5, 6), where there are more than one type of prices. Furthermore, the increase of the number of providers in these problems increases the complexity of the problem. Therefore, another methodology is needed to find near-optimal solutions. The GA may be used as a computing technique to find solutions. Due to the probabilistic nature of the solution, the GA does not guarantee optimality even it may be reached. However, they are likely to be close to the global optimum [15].
The GA settings used in this paper include chromosome representation, fitness function, initial population generation, parent selection and replacement and stopping conditions.
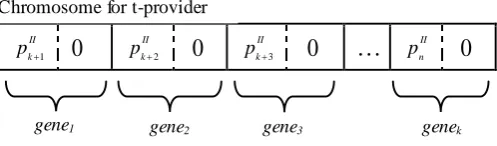
Chromosome representation: A chromosome represents a solution to the problem and is encoded as a vector of random keys. The GA spends most of its time on evaluating these solutions which increases the importance of chromosome representation. The decision variables in the given problems are the unit prices offered by publishers. The issue that necessitates some engineering in chromosome representation and crossover technique is the fact that a t-provider needs to determine only one type of price, whereas an e-provider needs to determine two types of prices. Hence, each gene in each chromosome is assumed to be composed of two parts: The first for t-providing price and the second for e-providing price (Fig. 2). Since a t-provider does not offer any e-providing price, the second value in each gene is defined as zero. For instance, for the Scenario II:
1
II
[image:5.595.306.555.54.127.2]p peII1 p2II peII2 p3II peII3
…
pkII pekIIFig. 7. Chromosome representations for providers in Scenario II
Fitness function: Given a particular chromosome, the fitness function returns a single numerical value, which is supposed to be proportional to the utility or the ability of this chromosome. Each provider tries to maximize its own profit. The higher the profit, the higher the fitness value should be. Therefore, the profit functions can be considered as the fitness functions. Each gene in a chromosome belongs to a provider whose type is known a priori. If the gene belongs to a t-provider, its profit value is calculated using Eq. (4), whereas if it belongs to an e-provider, its profit value is calculated using Eq. (5). Then, fitness value of a chromosome is the sum of the profit values of each gene.
Population size: It is obvious that smaller population sizes result in shorter CPU time, but larger population sizes explore enough of the solution space and consistently find good solutions. In the GA implementation, two different population sizes may be chosen after realizing some investigations on the solution quality and computation time.
Initial population generation: The starting population of chromosomes of the appropriate length is randomly generated.
Parent selection: Selection process is defined as selecting the chromosomes on which to base the next generation. It is a random process with priority being given to chromosomes that are most fit. The Roulette Wheel selection technique, also called stochastic sampling with replacement, may be used [16]. In this technique, the chromosomes are mapped to contiguous segments of a line where each chromosome’s segment is proportional in size to its fitness value [17]. A random number is generated and the chromosome whose segment spans the random number is selected. This procedure is repeated until the mating population is obtained.
The crossover is responsible for the information exchange between mating chromosomes and the convergence speed of the genetic algorithm. It is to form new chromosomes that inherit segments of information stored in parent chromosomes. The probability that the crossover operation is applied to a particular chromosome during a generation is defined as the crossover rate. For this research, the one-point crossover may be used, the crossover rate may be set to 0.9 and the crossover operator generates two offsprings from each pair.
The mutation is a genetic operator that alters one or more gene values in a chromosome from its initial state. This allows having completely new chromosomes in the population with whom it is possible to arrive at better solutions. This operator helps to prevent the population from stagnating at any local optimum. The mutation is carried out according to the mutation probability, which may be set to 0.01 for this research. The mutation operator may be defined as decreasing 50% of a randomly selected gene value.
1
II k
p
0
2II k
p
0
3II k
p
0
…
II n
p
0
Chromosome for e-provider
gene1 gene2 gene3 genek
Chromosome for t-provider
Replacement: Combining the newly reproduced population with the initial one, the population size is doubled at the end of each crossover process. For replacement, the parents and their offsprings are sorted according to their fitness values and the best half of these chromosomes are carried to the next generation.
Stopping conditions: The stopping criterion determines when the genetic process stops evolving. For the GA, one of the most frequently used stopping criteria is the specification of a maximum number of generations. In the GA implementation of the scenario, the maximum number of generations may be defined as 250. This means that, the algorithm terminates once the iteration number reaches 250. Another frequently used stopping criterion is to terminate the evaluation if there is not any change to the population’s best fitness values for a specified number of generations. This number may be set to 50 in this scenario setting.
For each population size, the GA need to be run 50 times and the best result should be chosen from these 50 results.
E. A Simple Demonstrative Example
Let us show the results found for the Scenario II as an example. The scenario is demonstrated on an example with e-provider1 and p-provider2 in the market [2]. The model
parameters are set as in Table II. The unit cost of t-providing is assumed to be the same for two providers and equal to 1. However, the unit cost of e-providing is lower and it is set to 0.75. For the Scenario II, the equilibrium price values and related demands and profits are obtained as in Table III.
TABLE II.
PARAMETERS OF THE DEMONSTRATIVE EXAMPLE:SCENARIO II
Model parameter Value
Market size ( M) 100
Unit cost of e-provider ( ce1) 0.75
Unit cost of t-provider ( c1=c2) 1
P rice sensitivity of e-customers of e-provider1 ( φe1.b1) 2
P rice sensitivity of t-customers of e-provider1 ( b1) 1
P rice sensitivity of customers of t-providerr2 ( b2) 1.5
TABLE II.
PRICE, DEMAND AND PROFIT VALUES AT THE EQUILIBRIUM IN SCENARIO II
Equilibrium values
e-provider1 t-provider2
e-providing t-providing t-providing
Offered price 1.3839 1.7124 2.1426
Profit 14.0419 4.5729
Demand 9.6630 13.1912 9.9370
Total profit of providers 18.6148
The results at the equilibrium point confirm that the e-providing price is lower than the t-e-providing prices because of lower providing costs. E-provider1 reaches bigger market share,
which is proportional to its total profit, since it offers two different providing channels for different preferences.
V. CONCLUSION
In this research, a conceptual framework is proposed which
equilibrium. The industry equilibrium is defined as the scenario where the sum of the profits of all publishers in the market is the maximum. The coefficient of price sensitivity (b) is the fundamental factor that determines both types of price levels. As the price sensitivity of customer increases, providers are obliged to decrease their prices in order to maintain more customers. In this sense, it is the customer that determines the price level. The proposed framework is valid for different types of decision environments in different sectors by making slight modifications. This decision support framework can help an existing firm when changing its business, or an existing firm to determine new prices, or a new entrant firm to determine prices. The model is built on game theory basis, since a successful business strategy needs to consider the actions of other players in a competitive market.
ACKNOWLEDGMENT
This research has been financially supported by Galatasaray University Research Fund.
REFERENCES
[1] S. Albers and M. Clement, “Analy zing the success drivers of e -business companies”, IEEE Transactions on Engineering Management 54(2), 2007, pp. 301-314.
[2] G.I. Alptekin, “Strategic Market Analy sis in an Electronic Service Market”, in Proc. IEEE 4th
Conference on Inform ation, Process, and Knowledge Managem ent (eKNOW), 2012, pp. 58-63.
[3] A. Labbi and C. Berrospi, “Optim izing m arketing planning and budgeting using Markov decision processes: An airline case study ”,
IBM Journal of Research and Development 51 (3.4), 2007, pp. 421– 431.
[4] F. Bernstein, J.S. Song and X. Zheng, “Bricks-and mortar vs. clicks-and mortar: An equilibrium analy sis”, European Journal of Operational Research 187, 2008, pp. 671-690.
[5] M.J. Osborne, An Introduction to Game Theory. Oxford University Press, 2004.
[6] A.B. McKenzie and L.A. DaSilva, Game Theory for Wireless Engineers. Morgan & Clay pool Publishers, 2006.
[7] J. Nash, “Non-Cooperative Games”, The Annals of Mathematics 54(2), 1951, pp. 286-295.
[8] T. Başar and G.J. Olsder, Dy namic Noncooperative Game Theory . 2n d ed., Academ ic Press, 1995.
[9] J.E. Hicks, A.B. McKenzie, J.A. Neel and J.H. Reed, “A game theory perspective on interference avoidance”, in Proc. IEEE Global Telecom m unications Conference 1, 2004, pp. 257-261.
[10] J.H. Holland, Adaptation in natural and artificial systems. Ann Arbour: University of Michigan Press, 1975.
[11] S. Russell and P. Norvig, Artificial Intelligence: A Modern Approach, Prentice Hall, New Jersey , 2009.
[12] K.T. Talluri and G.J. Van Ry zin, The Theory and Practice of Revenue Management. Kluwer Academ ic Publishers, Boston, 2004.
[13] G. Işıklar Alptekin and A.B. Bener, “The impact of power management to spectrum trading”, in Proc. IEEE/IFIP Integrated Network Managem ent, 2011, pp. 305-312.
[14] M.S. Bazaraa, H.D. Sherali and C.M. Shetty , Nonlinear Programming Theory and Algorithms. Hoboken, John Wiley & Sons Inc., New Jersey , 2006.
[15] S. Mardle and S. Pascoe, “An overview of genetic algorithms for the solution of optimization problems”, Computers in Higher Education Academy 1, 1999.
[16] D.E. Goldberg, Genetic algorithms in search, optimization and machine learning. Reading, MA, Addison-Wesley , 1989.