294
©IJRASET: All Rights are Reserved
Parametric Analysis of Bus-Bars in Silicon Cell of
Photovoltaic (PV) Module under Static Wind Loads
Afnan H. Khan1, H. Basit Ali2, Rizwan M. Gul3 1
Department of Mechanical Engineering, CECOS University of IT and Emerging Sciences, Peshawar, Pakistan.
2
Department of Mechanical Engineering, University of Engineering and Technology, Peshawar, Pakistan.
Abstract: Solar energy is a renowned source of renewable energy. Its harvesting is achieved through Photovoltaic (PV) module which is exposed to the external environment. Among numerous other factors, mechanical loads like wind and snow loads can cause degradation of the PV module by generating stresses in its various components. Solar cells are the crucial component of PV module. Any damage to the solar cell causes degradation of the PV module, thus dropping its output power. There are various design parameters of the PV module that needs to be investigated in order to establish some relationship between these parameters and the mechanical integrity of PV module. In this work, the effects of thickness and number of bus-bars (BBs) in a silicon solar cell on the mechanical integrity of PV module have been analyzed by using the finite element analysis. Thickness of BBs is varied form 0.1mm to 0.3mm with an increment of 0.05mm, while number of bus-bars is 2, 3 and 4. These simulations are performed as per international standards, IEC-61215 and ASTM E1830-15, for 2400 Pa uniform static wind load. Results of these simulations show that minimum von-Misses stress (VMS) are produced in the 3 BBs Si-cell with BB thickness of 0.1mm. Thus, optimum mechanical integrity is achieved by the PV module having 3 BBs, each of thickness 0.1 mm.
Keywords: PV module, Mechanical Integrity, Bus-bars, Finite Element Analysis, IEC-61215.
I. INTRODUCTION
Fossil fuels rapid depletion and the emission of CO2 upon their burning have compelled the world to shift from conventional to
non-conventional or renewable energy resources. These resources mainly comprise of solar, wind, bio-mass and hydal energies. Among which, solar energy has got more attention in the past few years due to its free and abundant availability. Solar energy harvesting is commonly achieved through the Photovoltaic (PV) module that converts solar energy directly into the electrical energy. It has a layered structure comprises of thin layers of different materials. The most common configuration is: Glass/EVA/solar-cell/EVA/back-sheet. EVA stands for Ethylene Vinyl Acetate which acts as adhesive between different layers [1]. PV module encounters several harsh environmental conditions during its lifetime in the operational field and due to these external factors, it gradually degrades with time. Eventually, there is a power and efficiency loss.
Mechanical loads like wind and snow, can significantly affect the performance and reliability of a PV module. Mechanical integrity of PV module is dependent on various design factors like; size of Si-cell, placements and quantities of bus-bars (BBs); nature of bonding agent and the curing temperature. Output performance of PV module is greatly reduced if its mechanical reliability is affected. For instance, cracks in the Si-cell would increase its resistance and there will be loss in the amperes. Active cell area will greatly be reduced, thus reducing its fill factor. Moreover, the risk potential of reverse bias and hotspot is greatly increased [2-3]. Therefore, mechanical strength influences both the output power and reliability of the PV module.
ANSYS simulations analyze the effects of differnt design parameters of the PV module on its mechanical performance when subjected to the mechanical loads. In this research, the effects of two different design parameters, that is, thickness (0.1 mm to 0.3 mm with an increment of 0.05 mm) and number of BBs that is 2, 3 and 4 on the mechanical integrity of PV module are investigated, undet the uniform static wind load of 2400 Pa following IEC-61215 [4] and ASTM E1830-15 [5] standards.
II. MATERIALSANDMETHODS
Each PV module contains only one solar cell. The thickness of glass, solar cell, EVA and back-sheet is 3mm, 200µm, 1mm and 350µm, respectively. The thickness of each layer is constant in all modules. The only difference in each module is that of thickness
and numbers of BBs in the solar cell. The cross section of PV module is shown in Error! Reference source not found. Properties
295
[image:2.612.185.433.78.192.2]©IJRASET: All Rights are Reserved
[image:2.612.73.542.246.387.2]Fig. 1 Cross-section of a PV module showing layers of different material
TABLE I
PROPERTIES OF VARIOUS MATERIALS OF A PV MODULE
Material Thickness
(mm)
Young’s Modulus, E
(MPa)
Poisson Ratio
Thermal Expansion Coefficient, 10-6
(1/°C)
Thermal Conductivity
(W/m.K)
Glass 3 73000 0.2 8 0.98
EVA 1 6.5(100°C)
2100 (-60°C) 0.4 30 0.23
Silicon cell 0.2 130000 0.2 2.6 148
Back Sheet 0.35 2800 0.4 230 0.36
Bus-bar 0.1 – 0.3 110000 0.3 18 422
Al-frame 1 71000 0.3 23 247
A. Meshing And Boundary Conditions
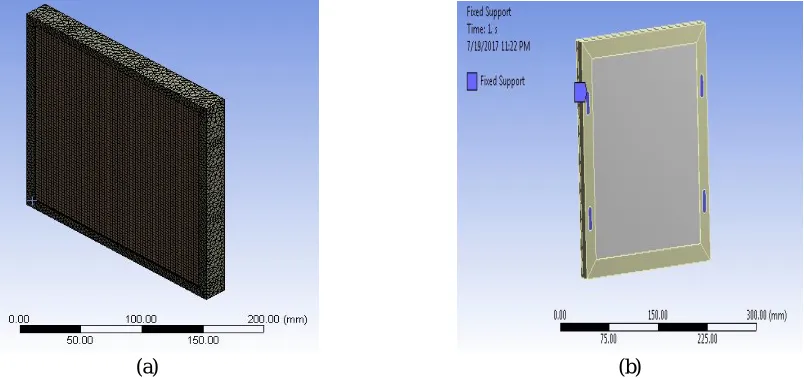
Structural analysis of PV modules is carried out on ANSYS Workbench. The geometry of PV module consists of different material layers mentioned in Fig. 1. The module is modeled using design modeler in ANSYS while meshing is accomplished in ANSYS Mechanical. The thickness of BBs is varied from 0.1mm to 0.3mm with an increment of 0.05mm in each module. Fine meshing is used with enhancement produced along the thickness of silicon cell, BBs, EVA, glass and back-sheet. Total of 348.2k nodes and 112.6k elements are there in the entire mesh. The Meshed PV module is shown in Fig. 2(a). Mesh independency is also done with stress deviation of less than 5%. Fixed supports are applied on the aluminum frame at common locations as shown in Fig. 2(b). A pressure of 2400 pa (simulating static wind load) is applied on the top surface as well as on the bottom surface of PV modules for 1 hour on each side. This makes one loading cycle. Three such loading cycles are applied on these modules at 28°C.
(a) (b)
[image:2.612.117.519.514.703.2]296
©IJRASET: All Rights are Reserved
III. RESULTS
The simulation results for each and every component of the PV module with 2, 3 and 4 bus-bars and varying bus-bar thickness from 0.1 mm to 0.3 mm with an increment of 0.05 mm are given in the following.
A. PV Module With 2bbs Cell
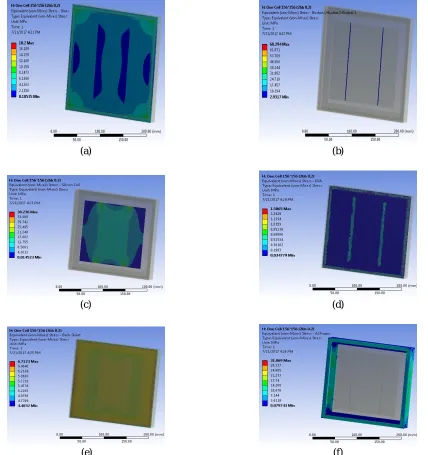
ANSYS simulations of a PV module with 2BBs cell are given in this section. The distance between two BBs is 78mm. Following figures show von-Mises stress (VMS), given in MPa, in different components of PV module at 28°C for 0.2mm thick BBs.
(a) (b)
(c) (d)
[image:3.612.94.522.163.618.2](e) (f)
Fig. 3 Maximum von-Mises stresses (MPa) in (a) glass (b) bus-bars (c) silicon cell (d) EVA (e) back-sheet and (f) aluminium frame of a 2 BBs PV module with BB thickness of 0.2 mm
The maximum von-Mises Stresses (VMS) observed in different layers of PV module at 28°C for two BBs with various BBs
thicknesses are given in TABLEII.Maximum von-Mises stresses (VMS) generated in various components of a PV module with two
297
©IJRASET: All Rights are Reserved
TABLEII
MAXIMUM VON MISES STRESSES IN DIFFERENT COMPONENTS OF 2BBS PV MODULES
Thickness of BB,
(mm) 0.1 0.15 0.2 0.25 0.3
Component Maximum von-Mises Stress (MPa)
Glass 18.2 18.2 18.2 18.2 18.2
Bus-bar 91.3 76.7 68.3 58.3 55.2
Si Cell 29.6 30.9 38.2 38.8 38.9
EVA 3.7 3.3 1.5 0.9 0.8
Back Sheet 6.7 6.7 6.7 6.7 6.7
Al Frame 31.9 31.9 31.9 31.9 31.9
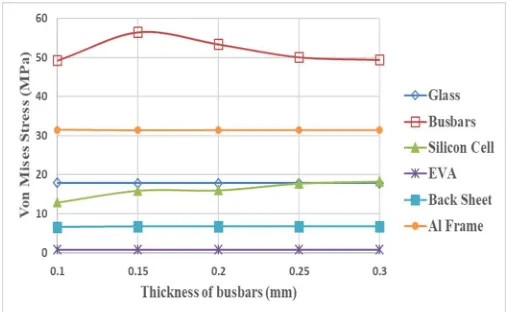
Thus optimum strength of the PV module is observed at the BB thickness of 0.3 mm where both Si-cell and bus-bars show optimal strength and minimal combined stresses. But it should be noted that all components are in the safer zone under the uniform static wind load of 2400 Pa.
Fig. 4 Maximum von Mises stress versus thickness of BBs in 2BBs PV modules
B. PV Module With 3bbs Cell
Results of ANSYS simulations of a PV module with 3 BBs cell are given in this section. The space between BBs is 52 mm. The von-Mises stresses observed in different layers of PV module at 28°C for three bus-bars cell with various BB thicknesses are tabulated in TABLE III. The comparison of different thickness of bus-bars and von-Mises stresses generated in various components of the PV module of 3 BBs is shown in Fig. 5 Maximum von Mises stress versus thickness of BBs in 3BBs PV modules
TABLE III
MAXIMUM VON MISES STRESSES IN DIFFERENT COMPONENTS OF 3BBS PV MODULES
Thickness of BB,
(mm) 0.1 0.15 0.2 0.25 0.3
Component Maximum von-Mises Stress (MPa)
Glass 18 18 18 18 18
Bus-bars 49.2 56.4 53.4 50.1 49.4
Si Cell 12.9 16.1 16.1 17.9 18.4
EVA 0.9 0.9 0.9 0.8 0.8
Back Sheet 6.8 6.8 6.8 6.8 6.8
298
[image:5.612.170.427.89.245.2]©IJRASET: All Rights are Reserved
Fig. 5 Maximum von Mises stress versus thickness of BBs in 3BBs PV modules
C. PV module with 4BBs cell
ANSYS simulations of a PV module with 4BBs cell are discussed in this section. The space between BBs is 39 mm. The von-Mises stresses observed in different layers of PV module at 28°C for four bus-bars with various BB thicknesses are given in TABLE IV. Maximum von-Mises stress and thickness of bus-bars in 4BBs Si-cell are compared in Fig. 6, where there is almost same trends in the stresses with increasing thickness of BBs as in case of 3BBs PV module.
TABLE IV
MAXIMUM VON MISES STRESSES IN DIFFERENT COMPONENTS OF 4BBS PV MODULES
Thickness of
BB, (mm) 0.1 0.15 0.2 0.25 0.3
Component Maximum von-Mises Stress (MPa)
Glass 18.4 18.4 18.4 18.4 18.4
Bus-bars 91.9 100 87.2 68.7 64.9
Si Cell 27.9 29.8 33.9 31.1 31.9
EVA 3.4 2.8 1.5 0.9 0.8
Back Sheet 6.7 6.7 6.7 6.7 6.7
Al Frame 31.7 31.7 31.7 31.7 31.7
299
©IJRASET: All Rights are Reserved
IV. DISCUSSION
No significant changes are observed in the maximum VMS produced in the glass, aluminum frame, and the back-sheet of all PV modules. Some minor changes are observed in the EVA layers of some modules. However, notable changes are observed in the maximum VMS produced in the BBs and silicon cell of PV modules. Results show that there is a decreasing trend observed in the maximum VMS produced in the BBs with increase in the BBs thickness in each module. This may probably because of the decrease in BB deformation. Similarly, an increasing trend can be seen in the maximum VMS produced in the silicon cell with increase in the BBs thickness in each module. It is may be due to the increase in loads on the silicon cell by the increasing weight of BB.
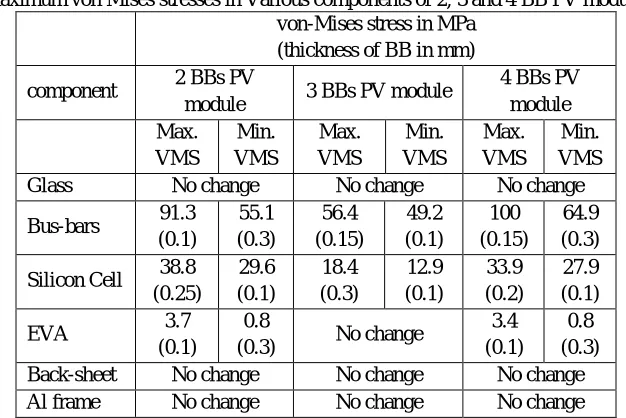
[image:6.612.148.461.333.542.2]In a 2BBs PV module, a maximum VMS of 91.3, 38.8 and 3.7 MPa are observed in the BBs, silicon cell and EVA having BBs thickness of 0.1, 0.25 and 0.1mm, respectively. Similarly, the lowest values of maximum VMS observed in the BBs, silicon cell and EVA are 55.1 MPa in a 0.3 mm thick BBs, 29.6 MPa in a 0.1mm thick BBs and 0.8 MPa in a 0.3mm thick BBs, respectively. In a 3BBs PV module, a maximum VMS of 56.4 and 18.4 MPa are observed in the BBs and silicon cell with the BBs thickness of 0.15 and 0.3mm, respectively. Similarly, the lowest values of maximum VMS observed in the BBs and silicon cell are 49.2 MPa and 12.9 MPa in a 0.1mm thick BBs respectively. No significant change is observed in the EVA of 3 BBs PV module. In a 4BBs PV module, the highest values of maximum VMS of 100, 33.8 and 3.4 MPa are observed in the BBs, silicon cell and EVA with the BBs thickness of 0.1, 0.2 and 0.1mm, respectively. Similarly, the lowest values of maximum VMS observed in the BBs, silicon cell and EVA are 64.9 MPa in a 0.3mm thick BBs, 27.9 MPa in a 0.1mm thick BBs and 0.8 MPa in a 0.3mm thick BBs respectively. The overall discussion is summarized in Table V.
Table V
Maximum von Mises stresses in Various components of 2, 3 and 4 BB PV modules von-Mises stress in MPa
(thickness of BB in mm)
component 2 BBs PV
module 3 BBs PV module
4 BBs PV module Max. VMS Min. VMS Max. VMS Min. VMS Max. VMS Min. VMS
Glass No change No change No change
Bus-bars 91.3
(0.1) 55.1 (0.3) 56.4 (0.15) 49.2 (0.1) 100 (0.15) 64.9 (0.3)
Silicon Cell 38.8
(0.25) 29.6 (0.1) 18.4 (0.3) 12.9 (0.1) 33.9 (0.2) 27.9 (0.1)
EVA 3.7
(0.1)
0.8
(0.3) No change
3.4 (0.1)
0.8 (0.3)
Back-sheet No change No change No change
Al frame No change No change No change
From Table V, it is quite clear that in a 3BBs PV module, the optimumthickness of BB is 0.1mm. For 2 and 4 BBs PV modules the
optimized thickness of BBs is 0.1mm as far as VMS in silicon cell in concerned (Table V). The optimum thickness of BBs will ensure least damage to the silicon cells, BBs or any other component material layer, resulting in lower power loss and module degradation due to static wind load.
V. CONCLUSIONS
300
©IJRASET: All Rights are Reserved
REFERENCES
[1] Paggi M, Corrado M, Berardone I. A global/local approach for the prediction of the electric response of cracked solar cells in photovoltaic modules under the action of mechanical loads. Engineering Fracture Mechanics 2016;168: 40-57.
[2] Kntges M, Kunze I, Kajari-Schrder S, Breitenmoser X, Bjørneklett B. The risk of power loss in crystalline silicon based photovoltaic modules due to micro-cracks. Solar Energy Material- Solar Cells. 2011;95:1131–7.
[3] Kajari-Schröder S, Kunze I, Köntges M. Criticality of cracks in PV modules. Energy Procedia. 2012;27:658–63.
[4] IEC 61215. International Standard IEC 61215: Crystalline silicon terrestrial photovoltaic (PV) modeules - design qualification and type approval. IEC. 2002. [5] ASTM. Standard Test Methods for Determining Mechanical Integrity of Photovoltaic Modules. Astm. 2015.