114 RES. AGR. ENG., 55, 2009 (3): 114–120 Drying is one of the oldest methods of food
pres-ervation (Doymaz 2007). It is probably the main and most expensive step in postharvest operations (Cohen & Yang 1995). The objective drying is the removal of water to a level at which microbial spoilage and deterioration reactions are greatly mi-nimised (Akpinar & Bicer 2005). A longer shelf-life, product diversity, and a substantial volume reduction are the reasons for the popularity of dried fruits and vegetables. Thin layer drying Eqs are used to estimate the drying time for several products and also to generalise the drying curves. Drying kinetics is greatly affected by the air velocity, air tempera-ture, material thickness, and others (Erenturk & Erenturk 2007). Physical and thermal properties of agricultural products, such as the heat and mass transfer, moisture diffusion, and activation energy, are required for the ideal dryer design (Aghbash-lo et al. 2008). Some researchers have studied the moisture diffusion and activation energy in the thin layer drying of various agricultural products, such as seedless grapes (Doymaz & Pala 2002), plums (Goyal et al. 2007), grapes (Pahlavanzadeh et al. 2001), candle nuts (Tarigan et al. 2006), potato slices (Akpinar et al. 2003), hazelnuts (Ozedmir & Devres 1999), beriberi fruit (Aghbashlo et al. 2008), and onion slices (Pathare & Sharma 2006). Although much information has been given
on the effective moisture diffusivity and activation energy for various agricultural products, very little published literature is available on the effective moisture diffusivity and activation energy data for apricots during drying. The knowledge of effec-tive moisture diffusivity and activation energy is necessary for designing and modelling the mass transfer processes such as dehydration or moisture adsorption during storage.
The main objective of this work was to determine the effective moisture diffusivity and activation ener-gy of apricots (cv. Rajabali) during thin layer drying process and their dependence on factors such as the air temperature and air velocity.
MATERIAL AND METHODS
Drying experiments
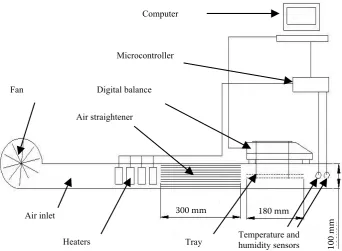
Fresh apricots (cv. Rajabali) were obtained from an orchard located in Shahroud, Iran (at a distance of 170 km from Semnan Province) in July 2008. The samples were stored in a refrigerator at +4°C. A schematic diagram of the dryer used in the ex-periments is shown in Figure 1. The dryer consist of a fan, heaters, air straightener, computer, micro-controller, digital balance, tray, humidity sensor, and thermometer (Yadollahinia 2006). It was
Determining of moisture diffusivity and activation
energy in drying of apricots
E. Mirzaee
1, S. Rafiee
1, A. Keyhani
1, Z. Emam-Djomeh
21
Department of
Agricultural Machinery Engineering,
2Department of Food Science,
Technology and Engineering, Faculty of Bio-systems Engineering, University of Tehran,
Karaj, Iran
Abstract: In this study, Fick’s second law was used as a major equation to calculate the moisture diffusivity for apricot fruit with some simplification. Drying experiments were carried out at the air temperatures of 40, 50, 60, 70, and 80°C and the drying air velocity of 1, 1.5 and 2 m/s. The experimental drying curves showed only a falling drying rate period. The calculated value of the moisture diffusivity varied from 1.7 × 10⁻¹⁰ to 1.15 × 10⁻⁹ m2/s for apricot fruit, and the
value of activation energy ranged from 29.35 to 33.78 kJ/mol at different velocities of air.
installed in an environment with the relative air humidity of 20–30% and ambient air temperature varying from 32 to 38°C. During the experiments, the ambient temperature, relative humidity, and inlet and outlet temperatures of air in the dryer chamber were recorded. Prior to the drying pro-cess, the samples were washed and their cores were separated, after which the dryer reached the steady state condition; then about 200 g of apricots were placed on the tray of the dryer and left to dry. The drying experiments were carried out at the drying air temperatures of 40, 50, 60, 70, and 80°C and the drying air velocity of 1, 1.5, and 2 m/s. The samples were weighed every 5 s during the process using a digital balance with 0.01 g accuracy. The initial and final moisture contents of the apricots were deter-mined at 78°C during 48 h with the oven method (AOAC 1984). The drying process was terminated when the moisture content decreased to about 15% wet base (w.b) from the initial moisture content value of 84.17% wet base (w.b). In this study, the influence of the mentioned conditions on the ef-fective moisture diffusivity and activation energy in thin-layer drying of apricot fruit (cv. Rajabali) was addressed.
Theoretical principle
The drying rate of apricots was calculated using Eq. (1) (Kavak Akpinar 2002):
DR = (Mt+dt – Mt)/dt (1)
where:
Mt+dt – moisture content at the time t+dt (kg water/kg dry mater)
Mt – moisture content at the time t (kg water/kg dry mater) t – drying time (min)
Crank using Fick’s second law proposed Eq. (2) for the effective moisture diffusivity for an infinite slab (Crank 1975):
M 8 ∞ 1 (2n – 1)2π2Dt MR = ––– = –––
∑
–––––––– exp(
– –––––––––––)
(2) Mo π2 n=1 (2n – 1)2 4L2where:
MR – moisture ratio
M – moisture content at any time (kg water/kg dry mater)
M0 – initial moisture content (kg water/kg dry mater) n = 1, 2, 3, . . . the number of terms taken into consideration t – time of drying in seconds
D – effective moisture diffusivity in m2/s L – thickness of the slice (m)
Only the first term of Eq. (2) is used for a long drying time(Lopez et al. 2000),hence:
8 π2Dt
MR = –––– exp
(
––––––)
(3)π2 4L2
The slope (k0) is calculated by plotting ln(MR) versus time according to Eq. (4):
π2D
ko = ––––– (4)
4L2
The activation energy was calculated using an Ar-rhenius type equations (Lopez et al. 2000; Akpinar et al. 2003):
Figure1. Schematic of thin-layer drying equipment
Figure2. Drying air temperature versus total time at different air velocities
FanHeaters Air inlet
Computer
Digital balance Microcontroller
Air straightener
Tray Temperature and humidity sensors
0 5 10 15 20 25 30
30 40 50 60 70 80 90
To
ta
l t
im
e(
hr
)
1 m/s Ƒ 1.5 m/s ż 2 m/s ¨
[image:2.595.67.410.55.306.2]Temperature (ºC)
Figure 1. Scheme of thin-layer drying equipment
300 mm 180 mm
10
0
m
116 RES. AGR. ENG., 55, 2009 (3): 114–120 Ea
D = D0 exp (– ––––) (5)
RTa
where:
Ea – energy of activation (kJ/mol)
R – universal gas constant (8.3143 kJ/mol K) Ta – absolute air temperature (K)
D0 – pre-exponential factor of the Arrhenius equation (m2/s)
From Eq. (5), the plot of ln D versus 1/Ta gives a straight slope of K1.
K1 = Ea / R (6)
Linear regression analyses were used to fit the equation to the experimental data to obtain the coefficient of determination (R2).
RESULTS AND DISCUSSION
Calculation of drying rate
Figure 2 shows total drying time versus tempera-ture at constant air velocity. It is clear that at a low
temperature, the difference between total times is significant while at a high temperature, the dif-ference between total times is negligible. In other words, the effect of the air velocity on the drying time at a low temperature is greater than that at a high temperature. The total time at the air velocity of 1 m/s is about 1.3 times longer as compared with experiments performed at 2 m/s at the constant air temperature, whereas it would increase about 2.5–3 times when we compared this total time at 40°C with 80°C at the constant air velocity. In other words, the effect of the air temperature on total dry-ing time is significant, compared with that of the air velocity, in thin-layer drying of apricots.
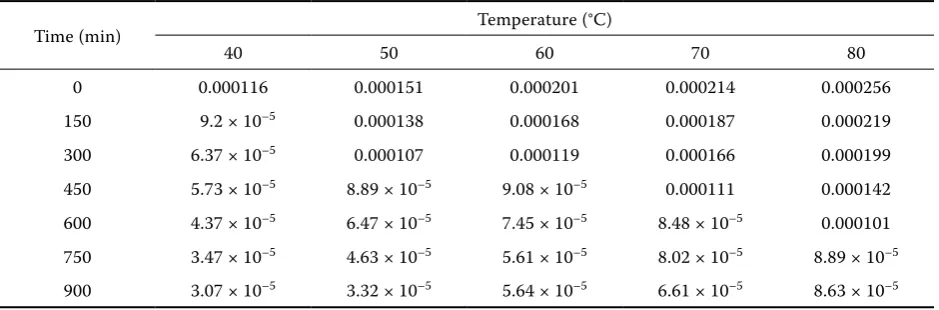
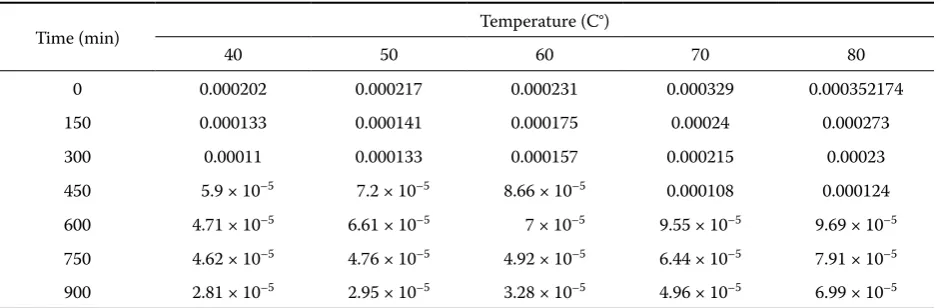
[image:3.595.64.534.603.758.2]The variations of the drying rate values with the drying time at different drying air temperatures for air velocities of 1, 1.5 and 2 m/s are presented in Tables 1–3, respectively. All the drying operations are seen to occur in the falling rate period. It is ap-parent that the drying rate is higher at the beginning of the drying process and decreases continuously with the drying time. These results are in a good agreement with other results reported (Passamai Figure 2. Drying air temperature versus total time at different air velocities
Table 1. Values of drying rate at different temperatures and different times for air velocity of 1 m/s
Time (min) Temperature (°C)
40 50 60 70 80
0 0.000116 0.000151 0.000201 0.000214 0.000256
150 9.2 × 10⁻⁵ 0.000138 0.000168 0.000187 0.000219
300 6.37 × 10⁻⁵ 0.000107 0.000119 0.000166 0.000199
450 5.73 × 10⁻⁵ 8.89 × 10⁻⁵ 9.08 × 10⁻⁵ 0.000111 0.000142
600 4.37 × 10⁻⁵ 6.47 × 10⁻⁵ 7.45 × 10⁻⁵ 8.48 × 10⁻⁵ 0.000101
750 3.47 × 10⁻⁵ 4.63 × 10⁻⁵ 5.61 × 10⁻⁵ 8.02 × 10⁻⁵ 8.89 × 10⁻⁵ 900 3.07 × 10⁻⁵ 3.32 × 10⁻⁵ 5.64 × 10⁻⁵ 6.61 × 10⁻⁵ 8.63 × 10⁻⁵
Figure1. Schematic of thin-layer drying equipment
Figure2. Drying air temperature versus total time at different air velocities Fan
Heaters Air inlet
Computer
Digital balance Microcontroller
Air straightener
Tray Temperature and humidity sensors
0 5 10 15 20 25 30
30 40 50 60 70 80 90
To
ta
l t
im
e(
hr
)
1 m/s Ƒ 1.5 m/s ż 2 m/s ¨
Temperature (ºC)
Temperature (°C)
To
ta
l t
im
e
(h
)
Figure1. Schematic of thin-layer drying equipment
Figure2. Drying air temperature versus total time at different air velocities Fan
Heaters Air inlet
Computer
Digital balance Microcontroller
Air straightener
Tray Temperature and humidity sensors
0 5 10 15 20 25 30
30 40 50 60 70 80 90
To
ta
l t
im
e(
hr
)
1 m/s Ƒ 1.5 m/s ż 2 m/s ¨
RES. AGR. ENG., 55, 2009 (3): 114–120 117 & Saravia 1997; Kaymak-Ertekin 2002). The
drying rate increased with an increase in the tem-perature of the drying air, the highest values of the drying rate having been obtained at the drying air temperature of 80°C in all experiments. An increase in the drying rates with an increase in temperature was reported in earlier studies by Pathare and
Sharma (2006)for onion slices, Mohapatra and
Rao (2005) for parboiled wheat, Doymaz (2005) for green bean.
Calculation of effective moisture diffusivity
[image:4.595.66.533.73.229.2]The effective moisture diffusivity was calculated using Eq. (4). The minimum value of the moisture diffusivity was 1.7 × 10⁻¹⁰ m2/s at the air velocity of Table 2. Values of drying rate at different temperatures and different times for air velocity of 1.5 m/s
Time (min) Temperature (°C)
40 50 60 70 80
0 0.000199 0.000209 0.000281307 0.000326 0.00345
150 0.000111 0.000179 0.000197794 0.000217 0.000250399
300 8.89 × 10⁻⁵ 0.0001 0.000156406 0.000195 0.000201861
450 7.61 × 10⁻⁵ 8.48 × 10⁻⁵ 8.844 × 10⁻⁵ 0.000123 0.000133861
[image:4.595.64.536.267.421.2]600 6.14 × 10⁻⁵ 6.93 × 10⁻⁵ 7.195 × 10⁻⁵ 7.83 × 10⁻⁵ 7.991 × 10⁻⁵ 750 3.58 × 10⁻⁵ 4.43 × 10⁻⁵ 5.129 × 10⁻⁵ 6.58 × 10⁻⁵ 7.389 × 10⁻⁵ 900 4.38 × 10⁻⁶ 7.88 × 10⁻⁶ 2.039 × 10⁻⁵ 3.68 × 10⁻⁵ 3.986 × 10⁻⁵
Table 3. Values of drying rate at different temperatures and different times for air velocity of 2 m/s
Time (min) Temperature (C°)
40 50 60 70 80
0 0.000202 0.000217 0.000231 0.000329 0.000352174
150 0.000133 0.000141 0.000175 0.00024 0.000273
300 0.00011 0.000133 0.000157 0.000215 0.00023
450 5.9 × 10⁻⁵ 7.2 × 10⁻⁵ 8.66 × 10⁻⁵ 0.000108 0.000124
[image:4.595.74.456.581.761.2]600 4.71 × 10⁻⁵ 6.61 × 10⁻⁵ 7 × 10⁻⁵ 9.55 × 10⁻⁵ 9.69 × 10⁻⁵ 750 4.62 × 10⁻⁵ 4.76 × 10⁻⁵ 4.92 × 10⁻⁵ 6.44 × 10⁻⁵ 7.91 × 10⁻⁵ 900 2.81 × 10⁻⁵ 2.95 × 10⁻⁵ 3.28 × 10⁻⁵ 4.96 × 10⁻⁵ 6.99 × 10⁻⁵
Figure 3. D versus temperature at different levels of air velocity for thin-layer drying of apricot Figure3. D versus temperature at different levels of air velocity for thin –layer drying of
apricot 0
3 6 9 12
30 40 50 60 70 80 90
1 m/s Ÿ
1.5 m/s Ƒ
2 m/s ż
D
×1
0
-10 (m 2 /s
)
Temperature (ºC)
D
×1
0
-10 (m 2 /s
)
0 3 6 9 12
0.5 1 1.5 2
V(m/s) 80 ºC Ŷ
70 ºC Ƒ 60 ºC Ÿ 50ºC Ɣ 40 ºC ż
Temperature (°C)
D
×
1
0
–1
0 (m 2 /s
)
Figure3. D versus temperature at different levels of air velocity for thin –layer drying of
apricot
0 3 6 9 12
30 40 50 60 70 80 90
1 m/s Ÿ 1.5 m/s Ƒ 2 m/s ż
D
×1
0
-10 (m 2 /s
)
Temperature (ºC)
D
×1
0
-10 (m 2 /s
)
0 3 6 9 12
0.5 1 1.5 2
V(m/s)
80 ºC Ŷ
70 ºC Ƒ
60 ºC Ÿ
50ºC Ɣ
118 RES. AGR. ENG., 55, 2009 (3): 114–120 2 m/s and air temperature of 40°C while the
maxi-mum value of the moisture diffusivity was 1.15 × 10⁻⁹ m2/s at the air velocity of 1 m/s and air tem-perature of 80°C. Generally, the value of D changes in the range of 10–11–10–9 m2/s for food materials (Babalis & Belessiotis 2004; Aghbashlo et al. 2008). As seen in Figure 3, the values of D are plotted versus temperature at different levels of air velocity. Second degree polynomial equation was fitted for the calculated values of D. The fitted Eqs and related R2 are given in Table 4. In Figure 4, the values of
D at different levels of air temperature are plotted versus air velocity. As seen, the minimum value of D was found at the minimum air temperature while at constant temperature values an increase in the air velocity decreased D value because at a low air velocity (1 m/s), the air has a better contact with the sample surface which results in a greater absorption of moisture, consequently the moisture gradient of the sample with ambient increases and that leads to
an increase in the moisture diffusivity. But at a high air not clear velocity level (2 m/s), the air passing through the sample is turbulent to some extent, therefore the moisture gradient tends to decrease and the moisture diffusivity accordingly reduces.
Based on the independent variables (drying air temperature and drying air velocity) and using a multivariate regression technique, the effective moisture diffusivity was estimated as follows.
D = (– 3.9 – 1.48V + 0.204T) × 10–10 R2 = 0.97
Similar findings about the effects of air tempera-ture and velocity on the effective moistempera-ture diffusivity were reported by some authors Sacilik and Elicin (2006) for organic apple slices, Corzo et al. (2008) for coroba slices, and Aghbashlo et al. (2008) for beriberi fruit.
Calculation of activation energy
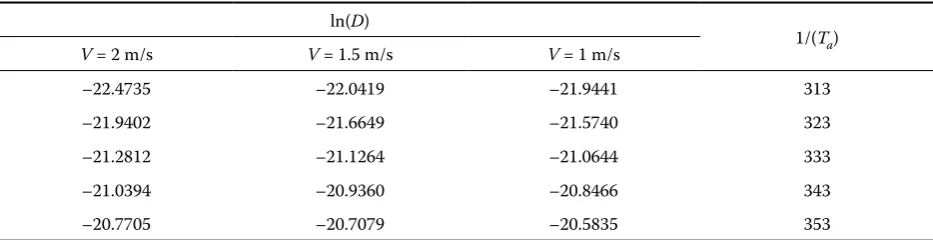
Table 5 contains the value of ln D versus 1/Tafor the air velocities of 1, 1.5, and 2 m/s. The activation energy was calculated using Eq. (6). The values of the activation energy lie from 12.7 to 110 kJ/mol for most food materials (Zogzas 1996). Bablis etal. (2004) reported this value varying from 30.8 to 48.47 kJ/mol for figs. Aghbashlo et al. (2008) reported that this Table 4. Fitted equations for D value at constant air velocity
V (m/s) Equation R2
[image:5.595.65.369.60.211.2]1 D = 0.0011T2 + 0.0821T – 2.25 0.99 1.5 D = 0.0006T2 + 0.126T – 3.68 0.96 2 D = 0.0006T2 + 0.126T – 4.43 0.99
[image:5.595.64.531.636.756.2]Figure 4. D versus air velocity at dif-ferent levels of air temperature for thin-layer drying of apricot
Table 5. Value of ln D versus 1/Tafor air velocity of 1, 1.5, and 2 m/s
ln(D)
1/(Ta)
V = 2 m/s V = 1.5 m/s V = 1 m/s
–22.4735 –22.0419 –21.9441 313
–21.9402 –21.6649 –21.5740 323
–21.2812 –21.1264 –21.0644 333
–21.0394 –20.9360 –20.8466 343
–20.7705 –20.7079 –20.5835 353
Figure3. D versus temperature at different levels of air velocity for thin –layer drying of
apricot
Figure4. D versus air velocity at different levels of air temperature for thin–layer drying of
apricot 0
3 6 9 12
30 40 50 60 70 80 90
1 m/s Ÿ 1.5 m/s Ƒ 2 m/s ż
D
×1
0
-10 (m 2 /s
)
Temperature (ºC)
D
×1
0
-10 (m 2 /s
)
0 3 6 9 12
0.5 1 1.5 2
V(m/s) 80 ºC Ŷ
70 ºC Ƒ
60 ºC Ÿ
50ºC Ɣ
40 ºC ż
V (m/s)
D
×
1
0
–1
0 (m 2 /s
)
80°C 70°C 60°C 50°C 40°C
Figure3. D versus temperature at different levels
of air velocity for thin –layer drying of
apricot
Figure4. D versus air velocity at different leve
ls of air temperature for thin–layer drying of
apricot
0 3 6 9 12
30 40 50 60 70 80 90
1 m/s Ÿ 1.5 m/s Ƒ 2 m/s ż
D
×1
0
-10 (m 2 /s)
Temperature (ºC)
D
×1
0
-10 (m 2 /s
)
0 3 6 9 12
0.5 1 1.5 2
V(m/s)
80 ºC Ŷ
70 ºC Ƒ
60 ºC Ÿ
50ºC Ɣ
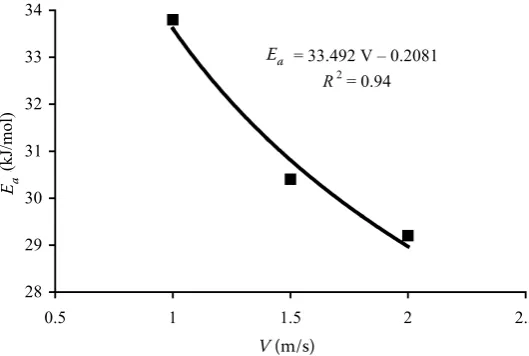
value varied within 110.837–130.61 kJ/mol for dif-ferent air velocities with beriberi fruit. Garau et al. (2006) reported this value as 36.4 kJ/mol for orange skin. In the present study, the value of Eavaried from 29.35 to 33.78 kJ/mol at different values of air velocities for apricot fruit (Table 6). The variation of the activation energy values versus air velocities is plotted in Figure 5. The relationship between the activation energy and drying air velocity was found by regression analysis. The results indicated that the power equation can predict Ea based on the drying air velocity with R2 of 0.94.
CONCLUSIONS
In the present study, the drying of apricots was carried out only in the falling rate stage. This implies that the moisture removal from the product was gov-erned by diffusion phenomenon. The highest effec-tive diffusion was found to be 1.15 × 10⁻⁹ m2/s at the air temperature and air velocity of 80°C and 1 m/s, respectively. The lowest effective diffusion was 1.7 × 10⁻¹⁰ m2/s at the air temperature and air velocity of 40°C and 2 m/s, respectively. It was deduced that at a low air velocity (1 m/s) the air has a better contact with the sample surface which results in a greater absorption of moisture, consequently the moisture gradient of the sample with ambient increases and that leads to an increase in the moisture diffusivity.
But at a high air velocity level (2 m/s), the air pass-ing through sample is turbulent to some extent, therefore the moisture gradient tends to decrease and the moisture diffusivity accordingly reduces. The activation energy for the apricot fruit in the drying experiments varied from 29.35 to 33.78 kJ/mol.
Acknowledgment
The authors acknowledge the University of Tehran and Mr. Mirzaee and Mr. Nikmehr for full support of this project.
References
Aghbashlo M., Kianmehr M.H., Samimi-Akhijahani H. (2008): Influence of drying conditions on the effective mois-ture diffusivity, energy of activation and energyconsumption during the thin-layer drying of beriberi fruit (Berberidaceae). Energy Conversion and Management, 49: 2865–2871. Akpinar E.K., Bicer Y. (2005): Modeling of the drying of
eggplants in thin layer. International Journal of Food Sci-ence and Technology, 40: 273–281.
Akpinar E., Midilli A., Bicer Y. (2003): Single layer dry-ing behavior of potato slices in a convective cyclone and mathematical modeling. Energy Conversion and Manage-ment, 44: 1689–1705.
AOAC (1984): Official Methods of Analysis. Association of Official Analytical Chemists Press. Washington, DC. Babalis J., Belessiotis V.G. (2004): Influence of the drying
conditions on the drying contents and moisture diffusivity during the thin layer drying of figs. Journal of Food Engi-neering, 65: 449–458.
Cohan J.S., Yang T.C.S. (1995): Progress in food dehydra-tion. Trends in Food Science and Technology, 6: 20–25. Corzo O., Bracho N., Pereira A., Vasquez A. (2008):
Weibull distribution for modeling air drying of coroba slices. Food Science and Technology, 91: 553–559.
Ea= 33.492 V – 0.2081
R2 = 0.94
28
29
30 31
32 33 34
0.5 1 1.5 2 2.5
V(m/s)
Ea
(k
J/
m
ol
)
Figure5. The influence of air velocity on energy activation value for thin –layer drying of
[image:6.595.72.337.59.237.2]apricot
[image:6.595.62.292.286.355.2]Figure 5. The influence of air velocity on activation energy value for thin–layer drying of apricot
Table 6. Activation energy for different levels of air velocity
Air velocity (m/s) Ea (kJ/mol) R2
1 33.78 0.96
1.5 30.14 0.94
2 29.35 0.98
Ea
Ea
120 RES. AGR. ENG., 55, 2009 (3): 114–120 Crank J. (1975): Mathematics of Diffusions. Oxford
Univer-sity Press, London.
Doymaz I., Pala M. (2002): The effects of dipping pretreat-ment on air-drying rates of seedless grapes. Journal of Food Engineering, 52: 413–427.
Doymaz I. (2005): Drying behavior of green beans. Journal of Food Engineering, 69: 161–165.
Doymaz I. (2007): Air-drying characteristics of tomatoes. Journal of Food Engineering, 78: 1291–1297.
Erenturk S., Erenturk K. (2007): Comparison of genetic algorithm and neural network approaches for the dry-ing process of carrot. Journal of Food Engineerdry-ing, 78: 905–912.
Garau M.C., Simal S., Femenia A., Rossello C. (2006): Drying of orange skin: drying kinetics modeling and functional properties. Journal of Food Engineering, 75: 288–295.
Goyal R.K., Kingsly A.R.P., Manikantan M.R., Ilyas S.M. (2007): Mathematical modeling of thin layer drying kinetics of plum in a tunnel dryer. Journal of Food Engi-neering, 79: 176–180.
Kavak Akpinar E. (2002): The Development of a Cyclone Type Dryer for Agricultural Products. [PhD. Thesis.] Firat University, Elazig.
Kaymak-Ertekin F. (2002): Drying and dehydrating kinet-ics of green and red peppers. Journal of Food Science, 67: 168–175.
Lopez A., Iguaz A., Esnoz A., Vireda P. (2000): Thin-layer drying behavior of vegetable waste from wholesale market. Drying Technology, 18: 995–1006.
Mohapatra D., Rao P.S. (2005): A thin layer drying model of parboiled wheat. Journal of Food Engineering, 66: 513–518.
Ozedmir M., Devres Y. (1999): The thin layer drying char-acteristics of hazelnuts during roasting. Journal of Food Engineering, 42: 225–233.
Pahlavanzadeh H., Basiri A., Zarrabi M. (2001): De-termination of parameters and pretreatment solution for grape drying. Drying Technology, 19: 217–226.
Passamai V., Saravia L. (1997): Relationship between a solar drying model of red pepper and the kinetics of pure water evaporation. II. Drying Technology, 15: 1433–1457. Pathare P.B., Sharma G.P. (2006): Effective moisture
dif-fusivity of onion slices undergoing infrared convective drying. Biosystems Engineering, 93: 285–291.
Sacilik K., Elicin A.K. (2006): The thin layer drying charac-teristics of organic apple slices. Journal of Food Engineer-ing, 73: 281–289.
Tarigan E., Prateepchaikul G., Yamseangsung R., Sirichote A., Tekasakul P. (2006): Drying character-istics of unshelled kernels of candle nuts. Journal of Food Engineering, 79: 828–833.
Yadollahinia A. (2006): A Thin Layer Drying Model for Paddy Dryer. [MSc. Thesis.] Faculty of Bio-systems Engi-neering, University of Tehran. Karaj, Iran.
Zogzas N.P., Marulis Z.B., Mariinos-Kourisd (1996): Moisture diffusivity data compilation in foodstuffs. Drying Technology, 14: 2225–2253.
Received for publication March 15, 2009 Accepted after corrections May 26, 2009
Corresponding author:
Esmaeil Mirzaee, University of Tehran, Faculty of Biosystems Engineering, Department ofAgricultural Machinery Engineering, Karaj, Iran
tel.: + 98 261 280 1011, fax: + 98 261 280 8138, e-mail: [email protected] Abstrakt
Mirzaee E., Rafiee S., Keyhani A., Emam-Djomeh Z. (2009): Stanovení difuzivity vlhkosti a aktivační
ener-gie při sušení meruněk.Res. Agr. Eng., 55: 114–120.
Ve studii byl použit druhý Fickův zákon s určitým zjednodušením jako nejvýznamnější rovnice pro výpočet difuzivity vlhkosti v meruňkách. Sušící experimenty proběhly při teplotách 40, 50, 60, 70 a 80°C a při rychlosti sušícího vzduchu 1, 1.5 a 2 m/s. Pokusné sušící křivky ukázaly pouze časové období klesající rychlosti sušení. Při rozdílných rychlostech vzduchu se vypočtené hodnoty difuzivity vlhkosti v meruňkách pohybovaly v rozmezí 1,7 × 10⁻¹⁰ až 1,5 × 10⁻¹⁰ m2/s
a hodnoty aktivační energie v rozmezí 29,35 až 33,78 KJ/mol.