Phase Relations, Activities and Minor Elements Distribution in Fe–Pb–As
and Fe–Pb–Sb Systems Saturated with Carbon at 1473 K
Leandro Voisin, Hector M. Henao, Mitsuhisa Hino and Kimio Itagaki
Institute of Multidisciplinary Research for Advanced Materials, Tohoku University, Sendai 980-8577, Japan
As a fundamental study to develop a new process for treating iron-lead base alloys, ‘‘speiss’’, with a considerably high content of arsenic or antimony, which are produced in smelting lead ores or secondary materials of lead under a strongly reductive condition, the phase relations and the minor elements distribution of copper, silver, gold and platinum in the Fe–Pb–As and Fe–Pb–Sb systems saturated with carbon were determined at 1473 K by a quenching method. It was found that a miscibility gap composed of an iron-rich alloy phase with a very small content of lead and a lead-rich alloy phase with very few contents of iron and carbon extended over the wide concentration range. Arsenic was mostly distributed in the iron-rich alloy phase, while antimony almost evenly in both phases. For the distribution of precious metals, it was found that silver was mostly enriched in the lead-rich alloy phase, platinum in the iron-rich alloy phase, while gold and copper almost evenly in both phases. Based on the obtained data of the phase separation and using thermodynamic data for the Pb–As and Pb–Sb binary systems, the activity coefficients of arsenic and antimony in the Fe–As and Fe–Sb systems saturated with carbon at 1473 K were derived and expressed by a formula with the interaction parameters.
(Received August 5, 2005; Accepted October 24, 2005; Published December 15, 2005)
Keywords: phase relations, speiss, distribution ratio, activity coefficient, interaction parameter, iron-rich alloy phase, lead-rich alloy phase
1. Introduction
In reduction smelting of copper, nickel, lead and zinc sulfide or oxide ores with high contents of arsenic and antimony, the so-called speiss is often produced, which is mainly composed of iron, copper and arsenic or antimony and contains sulfur and some precious metals as minor elements. It is also made in the operation of electric or blast furnace to treat the lead dusts and battery scraps. The recovery of valuable elements and the fixation of toxic elements for their harmless deposit are of major concern in the treatment of speiss.
The Fe–Cu system saturated with carbon1) makes a
miscibility gap at considerably low temperatures below 1500 K. This phase separation will be useful to develop a new process for treating the Fe–Cu base speiss. In the process proposed by our research group, the less valuable iron is to be removed in the iron-rich alloy phase, while the valuable copper and other metals are enriched in the copper-rich alloy phase. As fundamental studies for developing the process, the phase relations and the distribution of minor elements in the miscibility gap of Fe–Cu–As and Fe–Cu–Sb systems satu-rated with carbon at 1473 K have been studied.2,3) It was recognized in these studies that the activity coefficients and interaction parameters of arsenic and antimony in the iron-rich phase are basically important to discuss the experimental results from a standpoint of thermodynamics.
Since the related data are very scarce, activity coefficients and interaction parameters of the Fe–As and Fe–Sb systems saturated with carbon at 1473 K were determined in this study, based on the phase relations in the Fe–Pb–As and Fe– Pb–Sb ternary systems saturated with carbon. Since these systems make a miscibility gap consisting of the iron-rich alloy phase with a very small content of lead and the lead-rich alloy phase with very small contents of iron and carbon, the activities of arsenic and antimony in the Fe–As and Fe–Sb systems saturated with carbon can be derived by combining the phase relation data with the reported activity data for the
Pb–As4)and Pb–Sb5)binary systems, respectively.
Furthermore, in this study, the distribution ratios of some precious elements between the immiscible phases in the Fe– Pb–As and Fe–Pb–Sb systems saturated with carbon were determined at 1473 K by a quenching method. The obtained data for the Fe–Pb–As–C and Fe–Pb–Sb–C systems will be of importance and useful for the treatment of iron base speiss which is produced in smelting the lead ores or the secondary materials under a strongly reductive condition.
2. Experimental Method and Procedure
A quenching method combined with the metallographic observation and chemical analyses using combustion-infra-red spectrometry for carbon, electron probe micro analysis (EPMA) and inductively coupled plasma spectrometry (ICP) was used to determine the phase relations and the distribution of some precious elements.
The starting Fe–As or Fe–Sb alloy containing carbon was prepared with pig iron and Fe2As compound or antimony,
respectively. The mass% ratio of iron to lead, MFe=MPb, in
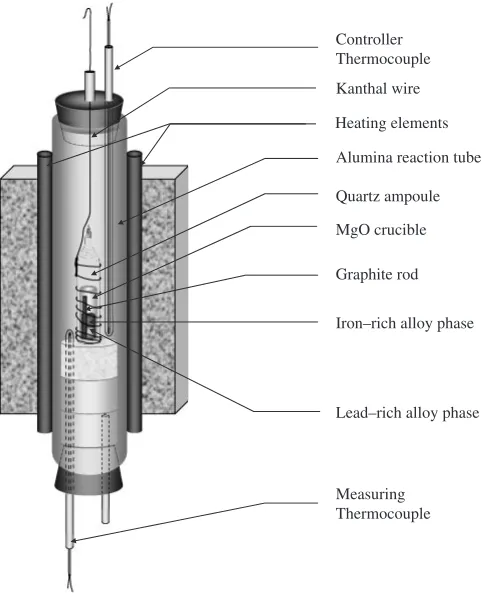
the charged material, was kept at 1 and the content of arsenic or antimony was varied. About 5 g of the alloy and the same amount of lead (99.99% purity), together with a rod of graphite was charged in a MgO crucible with 0.09 m length and 0.026 m ID, and then vacuum sealed in a quartz ampoule. It was heated at 1473 K for 43.2 ks and quenched into water. The schematic diagram of experimental apparatus is shown in Fig. 1. The solidified sample was examined by the metallographic analysis and EPMA to confirm the presence of two clearly separated lead- and iron-base phases. Once this was confirmed, the two phases were separated with a cutting blade and representative samples were taken for each phase and later analyzed for their components.
Two sets of experiments were conducted to analyze the distribution of minor elements between two liquid phases in equilibrium at the miscibility gap of Fe–Pb–As–C and Fe– Pb–Sb–C systems at 1473 K. The first set was concerned with
silver and copper, while the second one with gold and platinum as the minor elements. MFe=MPb in the charged
material was kept at 1 and the contents of arsenic and antimony were varied from 3 to 18 mass%, while the weight composition was 1 mass% for each minor element. The experimental procedure was identical to that mentioned above.
3. Results
3.1 Phase relations in miscibility gap of Fe–Pb–As–C
and Fe–Pb–Sb–C systems
It was found that the Fe–Pb–As and Fe–Pb–Sb systems saturated with carbon at 1473 K made a large miscibility gap where liquid iron-rich and lead-rich phases were in equili-brium. The compositions of these phases are listed in Tables 1 and 2 for the Fe–Pb–As–C and Fe–Pb–Sb–C systems, respectively. It is noted that the contents of carbon and iron in the lead-rich alloy phase for both systems are considerably small at less than 0.03 and 1 mass%, respec-tively, and that the content of arsenic in the lead-rich alloy phase is very small at less than 0.2% when compared with that in the iron-rich alloy phase. The content of lead in the iron-rich alloy phase is also very small for both systems.
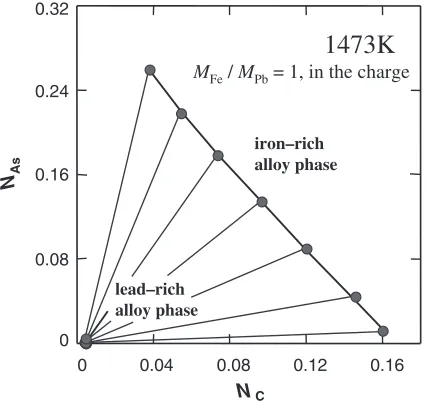
The composition diagrams of Fe–Pb–As–C and Fe–Pb– Sb–C quaternary systems at 1473 K are shown in Figs. 2 and 3, respectively. The phase relations in the miscibility gap of these systems are illustrated in Figs. 4 and 5, respectively, in relation to the mole fractions of carbon (NC) and arsenic
(NAs) or antimony (NSb) in both phases. As shown in Fig. 4,
the slope of tie lines, which connect between the two phases
in the miscibility gap of Fe–Pb–As–C system, against the bottom NC axis is positive and remarkably increases with
increasing content of arsenic in the charged material. On the contrary, as shown in Fig. 5, the Fe–Pb–Sb–C system exhibits the negative slopes.
Since the solubility of carbon in the lead-rich alloy phase is very small, the composition diagram for these quaternary systems can be simplified to pseudo-ternary diagrams in which iron and carbon are regarded as one constituent. The phase relations in the miscibility gap of Pb–(Fe+C)–As pseudo ternary system saturated with carbon at 1473 K are shown in Fig. 6 together with those in the Fe–Pb–As ternary system at 1473 K, which are reported by Hino and Azakami.6) Their data are obtained in a region of considerably high arsenic content in the charged material where the iron-rich
Controller Thermocouple
Alumina reaction tube
Graphite rod Quartz ampoule
Iron–rich alloy phase
Lead–rich alloy phase Kanthal wire
Heating elements
Measuring Thermocouple MgO crucible
[image:2.595.48.289.73.373.2]Fig. 1 Schematic diagram of experimental apparatus.
Table 1 Phase equilibrium compositions of Fe-rich alloy and Pb-rich alloy phases in the Fe–Pb–As–C quaternary system at 1473 K.
mass% in the Pb-rich alloy phase mass% in the Fe-rich alloy phase
Fe Pb As C Fe Pb As C
0.08 99.90 0.01 0.02 94.36 0.05 1.67 3.92 0.21 99.74 0.03 0.02 89.85 0.04 6.64 3.47 0.42 99.50 0.05 0.03 84.31 0.06 12.88 2.75 0.07 99.82 0.09 0.03 79.20 0.08 18.59 2.13 0.08 99.79 0.11 0.02 74.50 0.10 23.83 1.57 0.05 99.78 0.14 0.02 70.47 0.12 28.28 1.13 0.09 99.71 0.18 0.02 66.25 0.19 32.80 0.76
[image:2.595.308.549.94.209.2]MFe=MPbin the charge = 1
Table 2 Phase equilibrium compositions of Fe-rich alloy and Pb-rich alloy phases in the Fe–Pb–Sb–C quaternary system at 1473 K.
mass% in the Pb-rich alloy phase mass% in the Fe-rich alloy phase
Fe Pb Sb C Fe Pb Sb C
0.04 96.08 3.87 0.02 93.54 0.14 2.33 3.99 0.10 92.01 7.88 0.02 91.25 0.07 4.91 3.78 0.26 88.07 11.65 0.02 88.38 0.29 7.79 3.54 0.38 84.55 15.05 0.02 85.24 0.24 11.21 3.31 0.62 81.32 18.04 0.02 82.35 0.20 14.39 3.06 1.00 78.60 20.39 0.01 78.21 1.03 17.95 2.81
MFe=MPbin the charge = 1
0.2 0.4
0.6
C
Fe
Pb Pb–rich alloy phase (L2)
Fe–rich alloy phase (L1)
As
NAs
0.8
NPb
0.2 0.4
0.6 0.8
0.8
N
Fe 0.6
0.4 0.2
[image:2.595.306.549.264.365.2] [image:2.595.306.548.315.567.2]phase is fusible at this temperature. It is noteworthy in Fig. 6 that the tendency of tie line and the range of miscibility gap in the Pb–(Fe+C)–As system are in good accordance with those in the Fe–Pb–As system, which were estimated by extrap-olating the reported data6) into the range of lower arsenic
content.
On the contrary, as shown in Fig. 7, the tendency of tie lines is quite different between the Pb–(Fe+C)–Sb system and the Fe–Pb–Sb system.7)It is noteworthy that the slope of
tie lines against the bottom NPb axis in the Pb–(Fe+C)–Sb
system is much steeper than that in the Fe–Pb–Sb system. It is considered that this difference is ascribed to the large values for the activity coefficient of antimony in the iron-rich alloy phase. As will be described later, the activity coefficient in the Fe–Sb system saturated with carbon is much larger than
that in the Fe–Sb binary system, due to the very large interaction parameter of carbon for antimony. On the other hand, the range of miscibility gap of the Pb–(Fe+C)–Sb system is considerably similar to that of the Fe–Pb–Sb system illustrated with the broken line in Fig. 7, which was estimated
0.2 0.4
0.6
C
Fe
Pb L
Pb–rich alloy phase (L2)
Fe–rich alloy phase (L1)
Sb
NSb
0.8
NPb
0.2 0.4
0.6 0.8
0.8
N
Fe 0.6
0.4 0.2
L1+L
2
Fig. 3 Phase relations in the Fe–Pb–Sb–C quaternary system at 1473 K.
1473K
MFe/ MPb= 1, in the charge
0 0.08 0.16 0.24
0 0.04 0.08 0.12 0.16
0.32
NC
NAs
iron–rich alloy phase
lead–rich alloy phase
Fig. 4 Relation betweenNAsandNCin iron-rich alloy and lead-rich alloy
phases in the Fe–Pb–As system saturated with carbon at 1473 K.
0 0.08 0.16 0.24
0 0.04 0.08 0.12 0.16
0.32
NC
NSb
iron–rich alloy phase lead–rich
alloy phase
1473K
MFe/ MPb= 1, in the charge
Fig. 5 Relation betweenNSbandNCin iron-rich alloy and lead-rich alloy phases in the Fe–Pb–Sb system saturated with carbon at 1473 K.
0.2 0.4 0.6 0.8
0.2 0.4 0.6
0.8
NPb Pb
(Fe+C)
N(Fe+C)
N As As
0.4 0.6
Azakami et al. Pb–Fe–As at 1473 K
Pb–rich alloy Phase (L2)
( L1+ L2 )
Fe–rich alloy Phase (L1)
Fig. 6 Phase relations in the Pb–(Fe–C)–As pseudo ternary system at 1473 K.
Espeleta et al. Pb–Fe–Sb at 1473 K
0.2 0.4 0.6 0.8
0.2 0.4 0.6
0.8
NPb Pb
(Fe+C)
N(Fe+C)
N Sb
Pb–rich alloy Phase (L2) Sb
( L1+ L2 )
0.4 0.6
Fe–rich alloy Phase (L1)
[image:3.595.326.534.72.275.2] [image:3.595.51.287.94.273.2] [image:3.595.307.547.327.477.2] [image:3.595.64.279.356.557.2] [image:3.595.307.547.527.677.2]by extrapolating the reported data7)in the region of higher antimony content to the lower region where the iron-rich phase is solid.
It was clarified that the compositions of the iron-rich alloy phase in the Fe–Pb–As and Fe–Pb–Sb systems saturated with carbon are very close to those on the liquidus in the Fe–As and Fe–Sb systems saturated with carbon, which were reported by the authors.2,3) This is because the content of
lead in the iron-rich phase of Fe–Pb–As–C and Fe–Pb–Sb–C system is very small, as listed in Tables 1 and 2, respectively.
3.2 Distribution of some precious elements in Fe–Pb–
As–C and Fe–Pb–Sb–C systems
The distribution ratio of a minor element X between the liquid iron-rich alloy and lead-rich alloy phases in the Fe–Pb– As and Fe–Pb–Sb systems saturated with carbon,LXFe/Pb, is
defined as,
LXFe/Pb¼ ½mass% XFe=hmass% XiPb ð1Þ
where [ ]Feandh iPbindicate the iron-rich alloy and lead-rich
alloy phases, respectively. By the definition, the element X will be concentrated in the lead-rich alloy phase when the value of distribution ratio is less than unity.
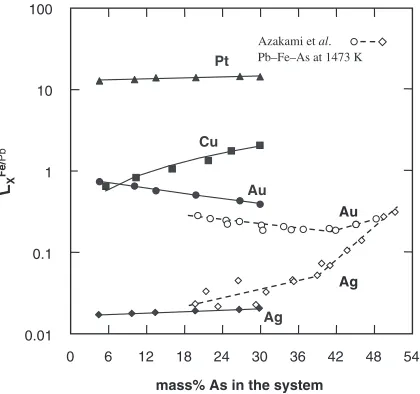
The distribution ratios of silver, gold, platinum and copper for the Fe–Pb–As–C and Fe–Pb–Sb–C systems at 1473 K are shown in Figs. 8 and 9, in relation to mass% As and Sb in the system, respectively. As shown in Fig. 8, the distribution ratio in the Fe–Pb–As–C system increases in the order of silver, gold, copper and platinum. LAgFe/Pb is considerably
small at less than 0.1, while LPtFe/Pb considerably large at
more than 10. LAuFe/Pb is a little less than unity, while
LCuFe/Pba little larger in the range of higher mass% As. The
distribution ratios of gold and copper change with mass% As in the system, while those of silver and platinum are almost constant against the arsenic content. The distribution ratios of silver and gold in the Pb–Fe–As system without carbon,6)
where the iron-rich phase is fusible with the arsenic content of more than 18 mass%, are shown in Fig. 8 with broken lines. It is noteworthy that, in terms of the magnitude and the dependency against the arsenic content, they are very similar to those for the Fe–Pb–As system saturated with carbon.
As shown in Fig. 9, the distribution ratio in the Fe–Pb–Sb– C system increases in the order of silver, copper, gold and platinum. For each element, the magnitude of distribution ratio is very similar to that in the Fe–Pb–As–C system even though LAgFe/Pb increases while LPtFe/Pb decreases with
increasing antimony content in the system. The distribution ratios of silver and gold in the Pb–Fe–Sb system without carbon,7) where the iron-rich phase is fusible with the
antimony content of more than 36 mass%, are shown in Fig. 9 with broken lines. It is also noteworthy that the present results, when extrapolated to the region of higher mass% Sb, are in good accordance to those for the Fe–Pb–Sb system without carbon.
4. Discussions
4.1 Activities of arsenic and antimony in Fe–As–C and
Fe–Sb–C systems
Since the contents of carbon and iron in the lead-rich alloy
phase and that of lead in the iron-rich alloy phase in the Fe– Pb–As–C and Fe–Pb–Sb–C systems are very small, these phases can be simplified to the Pb–As and Pb–Sb binary systems, and the Fe–As–C and Fe–Sb–C ternary systems, respectively. Based on the relationship given by eq. (2), the activities of arsenic and antimony in the Fe–As and Fe–Sb systems saturated with carbon can be derived from those in the Pb–As and Pb–Sb binary systems, respectively.
haXiPb¼ ½aXFe; ð2Þ
where X represents arsenic or antimony, andh iand [ ] are the lead-rich alloy and iron-rich alloy phases, respectively.
aX is the activity with the reference state of pure liquid
arsenic or antimony. aAs in the Pb–As binary system at
temperatures between 737 and 855 K are reported by Itagaki
et al.,4)and it was extrapolated at 1473 K by assuming the regular solution.aSbin the Pb–Sb binary system at 1473 K is
reported by Espeleta et al.5) By using these data and
0 6 12 18 24 30 36 42 48 54
mass% As in the system
LX
Fe/
Pb
0.01 0.1 1 10 100
Pt
Ag Cu
Au
Pb–Fe–As at 1473 K Azakami et al.
Ag Au
Fig. 8 Distribution ratios of minor elements in relation to the arsenic content in the Fe–Pb–As system saturated with carbon at 1473 K.
0 6 12 18 24 30 36 42 48 54
mass% Sb in the system
LX
Fe/
Pb
0.01 0.1 1 10 100
Pb–Fe–Sb at 1473 K Espeleta et al.
Pt
Ag Cu
Au
Ag Au
[image:4.595.323.533.73.270.2] [image:4.595.320.534.324.520.2]combining with the phase relations obtained in this study, the activities and Raoultian activity coefficients of arsenic and antimony in the iron-rich alloy phase were derived.
The activity coefficients,, of arsenic and antimony in the Fe–As and Fe–Sb systems saturated with carbon at 1473 K are shown in Figs. 10 and 11, respectively, in relation to the mole fractions of arsenic and antimony in the systems. It is noteworthy that a significant difference in the activity coefficients is observed between these systems.Asexhibits considerably small values of less than 0.02, whileSbis very large at more than 2. That is, they differ by two orders of magnitude. Since the limiting activity coefficients of arsenic8) and antimony9)in the carbon-free Fe–As and Fe–Sb systems at 1473 K are 0.036 and 0.32, respectively, the observed difference in the activity coefficients in the Fe–As and Fe–Sb
systems saturated with carbon can be ascribed to the effect of carbon containing in these systems with the amounts between 0.7 and 4 mass%. This effect will be discussed more or less quantitatively on the basis of interaction parameters, as follows.
4.2 Interaction parameters of Fe–As–C and Fe–Sb–C
systems
The activity coefficients of X (As or Sb) in the Fe–X–C ternary systems with iron as a solvent, and X and carbon as solutes might be expressed by eq. (3), which is valid when the higher order terms in Taylor’s series expansion can be neglected.
lnX¼lnXoþ"XXNXþ"XCNC (X = As, Sb); ð3Þ
where,Xois the limiting activity coefficient of X.NXandNC
are the mole fractions. "XX and "XC are the interaction
parameters of X and carbon for X, respectively. Although eq. (3) has been widely used to express the activity coefficients of solute in multi-component solutions, second order or higher terms in Taylor’s series expansion must be added to represent the activity coefficients in a condition where solute contents are rich, as in the present case that the mole fraction of carbon is considerably high. Mikiet al.10,11)
derived a thermodynamic expression with the higher order terms on the basis of quadratic formalism proposed by Darken,12,13) which can be applied to considerably higher solute contents. According to their expression, the activity coefficient of X in the present ternary solutions with iron as solvent, and carbon and X as solutes can be given by the following equation.
lnX¼ 2Fe{XNXþ ðX{CFe{XFe{CÞNC
þFe{XNX2þFe{CNC2
þ ðFe{XþFe{CX{CÞNXNCþlnXo
(X = As, Sb); ð4Þ
where, i{j is a constant which characterizes the thermody-namic property of i–j binary solution within the region of validity of the quadratic formalism at constant temperature and pressure. The following relations can be obtained by comparing eq. (4) with the first and second order terms in Taylor’s series expansion14)given by eq. (5).
lnX¼"XXNXþ"XCNCþXXNX2
þXCNC2þXðX,CÞNXNCþlnXo ð5Þ
"XX¼ 2Fe{X ð6Þ
"XC¼ ðX{CFe{XFe{CÞ ð7Þ
XX¼Fe{X ð8Þ
XC¼Fe{C ð9Þ
XðX,CÞ¼ ðFe{XþFe{CX{CÞ ð10Þ
where, "ij andij are the first and second order interaction parameters, respectively. The quadratic formalism includes all the first and second order terms represented by Wagner’s formalism.14)Hence, the valid composition region where the quadratic formalism stands is essentially wider than that in a case that Wagner’s formalism is available.
0 0.2 0.4 0.6 0.8 1.0 1.2
0 0.05 0.10 0.15 0.20 0.25 0.30 0.35
γAs
NAs
lead–rich alloy phase
[image:5.595.65.277.72.279.2]iron–rich alloy phase
Fig. 10 Activity coefficient of arsenic at the phase boundary in the miscibility gap of the Fe–Pb–As system saturated with carbon at 1473 K. (standard state: pure liquid As)
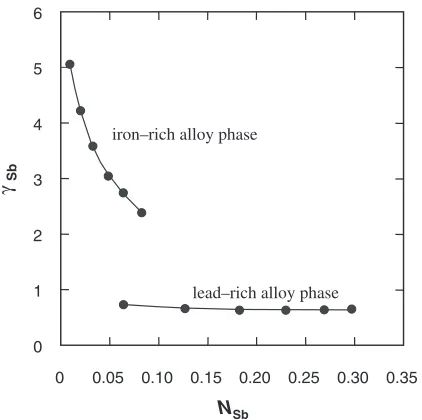
0 0.05 0.10 0.15 0.20 0.25 0.30 0.35 γSb
NSb
0 1 2 3 4 5 6
iron–rich alloy phase
lead–rich alloy phase
[image:5.595.66.277.337.547.2]By using the values ofXoand"XXfor the binary Fe–As8)
and Fe–Sb9)systems and"
CCfor the binary Fe–C system15)
and by combining the experimentally determinedXin the
Fe–As–C and Fe–Sb–C systems, the parameters in eqs. (6)– (10) were calculated. The averaged value of"AsCobtained by
applying the quadratic formalism is 9.7 with the standard deviation of 1.8, while "SbC is 18.6 with the standard
deviation of 0.6.AsandSbcan be approximately given by eqs. (11) and (12), respectively.
A lineal relationship between "XC and the content of carbon, which conforms to Darken’s quadratic formalism, was found in the concentration ranges of arsenic and antimony specified in eqs. (11) and (12), respectively.
lnAs¼ 6:0þ13NAsþ9:7NC6:5NAs2
5:4NC29:7NAsNC
ðNAs¼0:01{0:09Þ ð11Þ
lnSb¼ 1:4þ3:0NSbþ18:6NC1:5NSb2
5:4NC218:6NSbNC
ðNSb¼0:01{0:08Þ ð12Þ
4.3 Material balances in the proposed process
Based on the present experimental results, the material balances were evaluated for a new process proposed by the authors. In the process, excess carbon is added to the Pb–Fe base speiss to make immiscible liquid lead-rich alloy and iron-rich alloy phases at a fairly low temperature of about
1500 K. By using the phase separation, the recovery of valuable metals into the lead-rich alloy phase and the elimination of less valuable iron and arsenic or antimony into the iron-rich alloy phase for its harmless deposit might be possible in a less stringent condition if it is stable in the atmosphere.
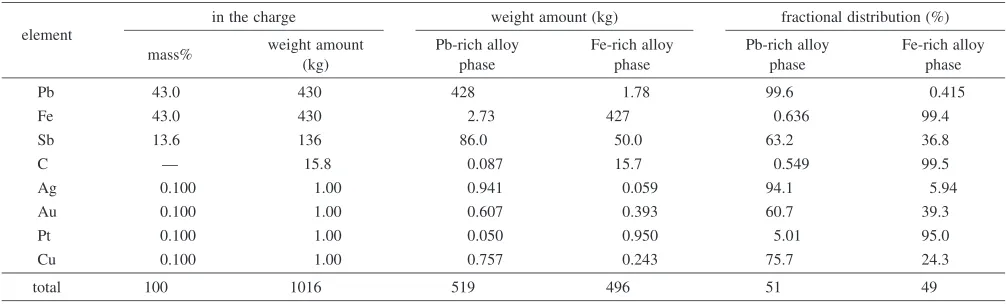
It was supposed in the calculation that 1000 kg of speiss containing lead, iron and arsenic or antimony with 43, 43 and 13.6 mass%, respectively, and silver, gold, platinum and copper with each 0.1 mass% is treated at 1473 K by adding 7.7 and 15.8 kg of carbon (minimum amounts required for their saturation in the melts) in the Fe–Pb–As and Fe–Pb–Sb systems, respectively. The loss of arsenic or antimony by volatilization was neglected in the calculation. The calcu-lated results are listed in Tables 3 and 4, representing the weight kg of all the elements in each phase and their fractional distribution (%) between both phases in the Fe– Pb–As–C and Fe–Pb–Sb–C systems, respectively.
[image:6.595.46.551.83.235.2]As is indicated in Tables 3 and 4 for both systems, almost entire iron together with more than 98% of carbon and more than 95% of platinum in the charge will be distributed into the iron-rich alloy phase, while practically the whole lead together with over 94% of silver into the lead-rich alloy phase. It is noted that the fractional distribution of gold in the lead-rich phase is fairly larger than that in the iron-rich phase. When Tables 3 and 4 are compared, two outstanding differences are observed between the Fe–Pb–As and Fe– Pb–Sb base speiss. The fractional distribution of antimony in the iron-rich alloy phase is notoriously small at 36.8% as
Table 3 Material balances in the treatment of 1000 kg of Fe–Pb–As speiss under saturation of carbon at 1473 K.
element
in the charge weight amount (kg) fractional distribution (%)
mass% weight amount (kg)
Pb-rich alloy phase
Fe-rich alloy phase
Pb-rich alloy phase
Fe-rich alloy phase
Pb 43.0 430 429 0.656 99.8 0.153
Fe 43.0 430 0.332 430 0.077 99.9
As 13.6 136 0.564 135 0.415 99.6
C — 7.7 0.108 7.58 1.40 98.6
Ag 0.100 1.00 0.974 0.026 97.4 2.55
Au 0.100 1.00 0.614 0.386 61.4 38.6
Pt 0.100 1.00 0.049 0.951 4.94 95.1
Cu 0.100 1.00 0.324 0.676 32.4 67.6
[image:6.595.46.549.270.422.2]total 100 1008 432 575 43 57
Table 4 Material balances in the treatment of 1000 kg of Fe–Pb–Sb speiss under saturation of carbon at 1473 K.
element
in the charge weight amount (kg) fractional distribution (%)
mass% weight amount (kg)
Pb-rich alloy phase
Fe-rich alloy phase
Pb-rich alloy phase
Fe-rich alloy phase
Pb 43.0 430 428 1.78 99.6 0.415
Fe 43.0 430 2.73 427 0.636 99.4
Sb 13.6 136 86.0 50.0 63.2 36.8
C — 15.8 0.087 15.7 0.549 99.5
Ag 0.100 1.00 0.941 0.059 94.1 5.94
Au 0.100 1.00 0.607 0.393 60.7 39.3
Pt 0.100 1.00 0.050 0.950 5.01 95.0
Cu 0.100 1.00 0.757 0.243 75.7 24.3
compared with that of arsenic with 99.6%. The fractional distribution of copper in the iron-rich alloy phase for the Fe– Pb–Sb speiss is considerably small at 24.3%, as compared with 67.6% for the Fe–Pb–As base speiss.
These results suggest that the recovery of valuable silver and gold from the Fe–Pb base speiss into the lead-rich alloy phase as well as the elimination of arsenic and about one third of the antimony into the iron-rich alloy phase might be feasible by means of the phase separation and the proposed process will be acceptable if the contents of platinum and copper in the initial charge are small. The lead-rich alloy may be further treated in a pyrometallurgical or hydrometallur-gical process to extract gold, silver, copper and antimony.
5. Summary
As a fundamental study to treat the speiss produced in smelting and recycling processes by utilizing the phase separation of iron base speiss in equilibrium with solid carbon, the phase relations in the miscibility gap of Fe–Pb– As and Fe–Pb–Sb systems saturated with carbon were determined at 1473 K and the activities of arsenic and antimony in the Fe–As and Fe–Sb systems saturated with carbon were derived. The distribution of some minor elements of Cu, Ag, Au and Pt between the liquid phases in the miscibility gap of the Fe–Pb–As and Fe–Pb–Sb systems saturated with carbon at 1473 K was also inves-tigated and the material balances in the proposed process to treat the iron base speiss were calculated. The results are summarized as follows.
(1) A miscibility gap composed of lead-rich alloy and iron-rich alloy phases extends over the wide concentration range. Carbon and arsenic are preferentially distributed in the iron-rich alloy phase, while the content of antimony in the lead-rich alloy phase is larger than that in the iron-rich alloy phase.
(2) A very large difference in the miscibility gap is observed between the Fe–Pb–As and Fe–Pb–Sb sys-tems saturated with carbon. This is ascribed to the difference in the activity coefficients between arsenic and antimony in the iron-rich alloy phase.
(3) Raoultian activity coefficients of arsenic and antimony in the Fe–As and Fe–Sb systems saturated with carbon
(the reference of activity is pure liquid) are in the ranges of 0.015–0.019 and 2.2–5, respectively. They are expressed by the following equations with the inter-action parameters of carbon for arsenic and for antimony;"AsC¼9:7and"SbC¼18:6, respectively.
lnAs¼ 6:0þ13NAsþ9:7NC6:5NAs2
5:4NC29:7NAsNC ðNAs¼0:01{0:09Þ
lnSb¼ 1:4þ3:0NSbþ18:6NC1:5NSb2
5:4NC218:6NSbNC ðNSb¼0:01{0:08Þ
(4) The distribution ratio of silver,LAgFe/Pb, is less than 0.1,
while that of platinum more than 10. LAuFe/Pb and
LCuFe/Pb are around unity. These results suggest that
silver is enriched in the lead-rich alloy phase, while platinum in the iron-rich alloy phase.
REFERENCES
1) Y. Chang, J. Newmann, A. Mikula and D. Goldberg:INCRA Series on the Metallurgy of Copper—Phase Diagrams and Thermodynamic Properties of Ternary Copper—Metal Systems, (International Copper Research Association, Milwaukee, Wisconsin, USA, 1979) pp. 367– 386.
2) L. Voisin, H. M. Henao and K. Itagaki: Mater. Trans.45(2004) 2851– 2856.
3) L. Voisin, H. M. Henao and K. Itagaki: Mater. Trans.46(2005) 74–79. 4) K. Itagaki, T. Shimizu and M. Hino: Bull. Res. Inst. Miner. Dress.
Metall. Tohoku Univ.34(1978) 45–52.
5) A. K. Espeleta, M. Hino and T. Azakami: J. Min. Mater. Process. Inst. Jpn.107(1991) 53–59.
6) T. Azakami and M. Hino: Can. Metall. Quart.18(1979) 389–394. 7) A. K. Espeleta, M. Hino and T. Azakami: J. Min. Mater. Process. Inst.
Jpn.106(1990) 825–830.
8) M. Hino and T. Azakami: Metall. Rev. MMIJ3(1986) 61–77. 9) M. Hino, J. Kim and T. Azakami: Bull. Inst. Adv. Mater. Process.
Tohoku Univ.50(1994) 38–46.
10) T. Miki, F. Ishii and M. Hino: Mater. Trans.44(2003) 1817–1823. 11) T. Miki and M. Hino: J. Iron Steel Inst. Jpn.44(2004) 1800–1809. 12) L. S. Darken: Trans. Metall. Soc. AIME239(1967) 80.
13) L. S. Darken: Trans. Metall. Soc. AIME239(1967) 90.
14) C. Wagner:Thermodynamics of Alloys(Addison-Wesley, Cambridge, MA., (1952) pp. 51–53.