Phenolic compounds are secondary metabolites naturally present in plants. They have great impor-tance for the food and drink products derived from plants, since these compounds are responsible for their organoleptic properties. As a consequence, they are closely related to the quality of such prod-ucts which makes their analysis considerably inter-esting as described by Robbins (2003).
The beer contains a complex mixture of phenolic compounds extracted from malt and hops which
have been shown to have useful antioxidant proper-ties as described by Goupy et al. (1999). Moreover, three groups of polyphenols are responsible for beer flavour and physical stability as described by a number of authors (Shahidi & Naczk 1995; Goupy et al. 1999; Čepička & Karabín 2002). Simple polyphenols derived from hydroxybenzoic acids (gallic acid, protocatechuic acid, etc.) and hydroxycinnamic acids (ferulic acid, p-coumaric acid, caffeic acid, etc.) are extracted mostly from
Supported by the Ministry of Education, Youth and Sports of the Czech Republic (Research Centre 1M0570).
Determination of Polyphenols in Beer by an Effective
Method Based on Solid-Phase Extraction
and High Performance Liquid Chromatography
with Diode-Array Detection
Markéta DVOŘÁKOVÁ, Petr HULÍN, Marcel KARABÍN and Pavel DOSTÁLEK
Department of Fermentation Chemistry and Bioengineering, Faculty of Food
and Biochemical Technology, Institute of Chemical Technology in Prague,
Prague, Czech Republic
Abstract
Dvořáková M., Hulín P., Karabín M., Dostálek P. (2007): Determination of polyphenols in beer by an effective method based on solid-phase extraction and high performance liquid chromatography with diode-array detection. Czech J. Food Sci., 25: 182–188.
The determination of polyphenols by spectrophotometric detection is complicated due to their low concentrations in beer. The beer samples have to be pre-concentrated before using the spectrophotometric detection for their quanti-fication. An analytical method based on solid-phase extraction (SPE) and followed by high performance liquid chro-matographic separation with diode-array detection is used for the determination of free gallic, protocatechuic, caffeic,
p-coumaric, ferulic and salicylic acids, of (+)-catechin, (–)-epicatechin, and quercetin. These phenolic compounds participate in colloidal and sensory stability of beer. Six different SPE cartridges were tested and three different types of elution with the most appropriate solvents (acetonitrile, acetone and methanol) were used. The performance of the HPLC method was assessed by the evaluation of parameters such as absolute recovery, relative standard deviation (RSD – lower than 10%), the limit of quantification (LOQ), and the limit of detection (LOD). The polyphenol content in various types of Czech beer is presented.
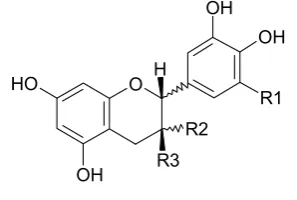
malt but are also present in small amounts in hops. Their structures are shown in Figures 1 and 2. Fla-vonols (quercetin, kaempferol etc.) come mostly from hop. Flavan-3-ols, including monomers such as (+)-catechin and (–)-epicatechin (Figure 3), dimers (prodelphinidin B3 and procyanidin B3), trimers (procyanidin C2), flavonoid-derived tan-nins up to higher molecular weights, arise equally from malt and hop. The final content of phenolic components of beer depends on both the raw materials and the brewing process.
For quality control, it is necessary to evaluate phenolic compounds by rapid analytical method because they can affect beer flavour and stabil-ity. Analytical methods for determining phenolic compounds in wort and beer are limited. Several authors determined phenolic compounds in beer matrices by direct injection HPLC after filtration, as described by Andersen et al. (2003). Another method is HPLC separation and online detection by diode-array spectroscopy after a chemical reaction with p-dimethylaminocinnamaldehyde (DMACA) as described by Pascual-Teresa et al. (2000). Nowadays, the solid-phase extraction (SPE) is
the common technique used for pre-concentra-tion and purificapre-concentra-tion prior to HPLC separapre-concentra-tion of phenolic compounds in wines,described by a number of authors (Betes-Saura et al. 1996; Guillen et al. 1997; Karagiannis et al. 2000). The most common method of the determination of polyphenols in wines, olive oils and other foods and drinks is HPLC with mass spectrometric detec-tion described by Robbins (2003). The separadetec-tion of phenolic compounds in beer was performed commonly by reversed liquid chromatography followed by ultravioletdetection described by Hayes et al. (1987), photodiode-array detection described by a number of authors (Sánchez et al. 1988; Es-Safi et al. 1999; Montanari et al. 1999), fluorimetric detection desribed by Dvořáková and Dostálek (2006), electrochemical detection described by Skerikova et al. (2004) or mass spectrometric detection described by Whittle and Eldridge (1999).
MAtEriAL AnD MEtHoDS
Reagents. Standards of gallic acid (97% purity) CAS No. [149-91-7], protocatechuic acid (97% pu-rity) CAS No. [99-50-3], caffeic acid (99% pupu-rity) CAS No. [331-39-5], gentistic acid (98% purity) CAS No. [490-79-9], p-coumaric acid (98% purity) CAS No. [501-98-4], salicylic acid (99% purity) CAS No. [69-72-7], ferulic acid (99% purity) CAS No. [1135-24-6], (+)-catechin hydrate (98% purity) CAS No. [88191-48-4], (–)-epicatechin (90% pu-rity) CAS No. [490-46-0] and quercetin dihydrate (98% purity) CAS No. [6151-25-3] were purchased from SigmaAldrich (Germany). Further used were solvents such as methanol super gradient from LabScan (Ireland), acetonitrile for HPLC from COOH
R2 R3
R4
R5 H
R2 R3
R4
R5 H
CH=CH-COOH
R2 R3 R4 R5 Name of the acid
H H H H cinnamic
H H OH H p-coumaric
H OCH3 OH H ferulic
[image:2.595.66.288.85.242.2]H OH OH H caffeic
Figure 2. Phenolic acids derived from cinnamic acid
R2 R3 R4 R5 Name of the acid
H H H H benzoic
OH H H H salicylic
H OH OH H protocatechuic OH H H OH gentistic
H OH OH OH gallic
[image:2.595.304.531.88.243.2]Figure 1. Phenolic acids derived from benzoic acid
Figure 3. Structure of monomeric flavan-3-ols O
O H
OH
OH OH
R1 H
R3 R2
(+) - catechin (R1=H, R2=H, R3=OH) (-) - epicatechin (R1=H, R2=OH, R3=H)
[image:2.595.95.244.616.716.2]SigmaAldrich (Germany), and acetone from Penta (Czech Republic).
A stock standard solution (ca. 500 mg/l) of each phenolic compound was prepared in methanol by weighing out approximately 0.025 g of the analyte into 50 ml volumetric flask and diluting to the respective volume. The mixed standard solution was prepared by dilution the mixed stock standard solutions in methanol to give a concentration of ca. 50 mg/l for each polyphenol. All standard solutions were stored in the dark at 5°C and were stable for at least three months.
Samples. The seven different types of Czech beer (labelled sample 1–7) produced by different manufacturers in the Czech Republic were tested and purchased at local markets. Four types of lager beer (samples 2, 3, 4, 7), one type of draught beer (sample 1), and two non-alcoholic beers (sample 5, 6) were analysed. The samples were stored in the dark at low temperature (5°C).
The unstabilised lager beer (sample 7) was used for testing SPE cartridges with the content of alco-hol 4.8 vol. % and with the addition of 1 ml mixed standard solution (spiked beer solution).
Solid-phase extraction.25 ml of the sample was submitted to the SPE process. This extrac-tion is performed in a vacuum device SPE Vacu-um Manifold Dorcus of Tessek (Prague, Czech Republic) using 6 different kinds of cartridges. We used Waters Oasis® Max cartridge (Milford, USA) of 60 mg of sorbent with reversed-phase and anion-exchange functionalities (encapped with quarternary amine groups), AccuBond II ODS-C18 (Agilent, USA) of 500 mg of sorbent with rever-sed-phase functionality (endcapped silica with octadecyl groups), Discovery DSC-Ph (Supelco, Germany) of 500 mg of monomerically bonded phenyl, Discovery DSC-C8 (Supelco, Germany) of 500 mg of sorbent with reversed-phase functiona-lity (modified silica with octyl groups), Discovery DPA-6S (Supelco, Germany) of 500 mg of sorbent with reversed-phase functionality (modified silica with amid groups), Supelclean LC-18 (Supelco, Germany) of 500 mg of sorbent with reversed-phase functionality (modified silica with octadecyl groups). The cartridges were selected due to their affinity to the analytes. The detailed characteri-sation of the sorbents used for SPE is described by Dvořáková and Dostálek (2006).
The cartridge was conditioned with 5 ml of methanol followed by 10 ml of distilled water. An aliquot part of the beer sample (25 ml) or spiked
beer solution, previously acidified to pH 1.5 with hydrochloric acid 36%, was passed through the cartridge. Subsequently, phenolic compounds were eluted with 12 ml of acetonitrile (in the case of DPA-6S, 12 ml of acetone was used for the elution, and in the case of Oasis® Max, we used 12 ml of methanol for the elution according to the appli-cation lists). The organic eluate was transferred into a 50 ml round-bottomed flask and evaporated under vacuum at 35°C to dryness. The residue obtained was dissolved in 1 ml of mobile phase (methanol:water 50:50, acidified with 1% acetic acid) and transfered to a vial. Certain samples had to be filtered through a cellulose filter (Millipore) 0.45 µm before the transfer to the vial.
Determination of total polyphenols (EBC). Ac-cording to the EBC method 9.11, we measured the content of total polyphenols. This method is described in detail in Anonymous(1998). The determination of total polyphenols in beer by spectrophotometry.
The 10 ml of degassed beer sample and 8 ml of CMC/EDTA reagent (Carboxymethyl cellulose/eth-ylenediaminetetraacetic acid) were transferred to a 25 ml volumetric flask and thoroughly mixed the content. Then 0.5 ml of ferric reagent (3.5% am-monium iron citrate) was added to the sample, which was then thoroughly homogenised. After that, 0.5 ml of ammonia reagent (ammonia:water, 1:2) was added and thoroughly mixed. Finally, the volume was made up to 25 ml with distilled water and homogenised. The absorbance at 600 nm was measured after 10 min, for reaction to take place and stabilise.
To obtain the content of polyphenols, the fol-lowing formula was used:
P = A × 820
where: P – polyphenol content (mg/l) A – absorbance at 600 nm
Chromatographic system and operating condi-tions. The analysis was performed with a HPLC system Alliance 2695 separation module with Photo Diode Array detector 2996 connected to a PC computer running the software program Empower (Waters, Milford, USA).
The mobile phase was acidified to ensure the total protonation of the compounds studied. For UV detection, the wavelength program was op-timised to monitor phenolic compounds at their respective maximum absorbance wavelengths as follows: λ 280 nm held for 12.7 min, changed to λ 330 nm and held for 2 min, changed to λ 306 nm and held for 2.9 min, changed to λ 280 nm and held for 3.1 min, changed to λ 306 and held for 15.3 min, changed to λ 280 nm and held for the rest of the analysis.
The detection and quantification of quercetin, gallic acid, protocatechuic acid, (+)-catechin, and (–)-epicatechin was done at 280 nm, of caffeic acid, p-coumaric acid, and salicylic acid at 306 nm, and of gentistic acid at 330 nm, respectively.
rESULtS AnD DiSCUSSion Solid-phase extraction – optimisation
of the method
For the extraction and purification of polyphe-nols, the removal of interfering compounds and recovery, 6 kinds of SPE cartridges were tested. Commercial beer samples (25 ml) were previ-ously degassed and acidified to pH 1.5, spiked with 1 ml of mixed standard solution (the con-centration of polyphenols being 50 mg/l) at the concentration of the added polyphenols of 2 mg/l. After equilibration, the spiked beer samples were processed according to the procedure described. Acetonitrile, methanol (Oasis-MAX) and ac-etone (DPA-6S) were used for the elution of the analytes from SPE cartridges (12 ml) according to their application lists. Triplicate analyses were performed with each cartridge. The absolute
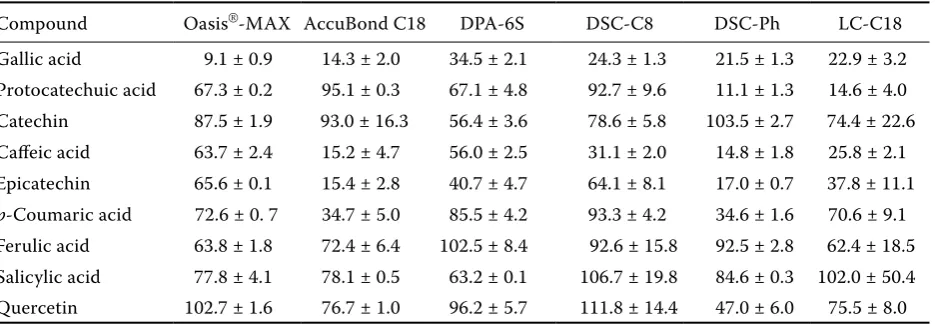
re-covery was calculated as the percentage content of polyphenols in the samples after SPE as related to the concentration of polyphenols in the spiked sample before SPE. The results are presented in Table 1. The ability in removing of interfering compounds is demonstrated in Figures 4 and 5. These cartridges show good recoveries and also low standard deviations for the compounds deter-mined. Other cartridges with very high recover-ies (presented in Table 1), DSC-C8 and LC-C18, unfortunately revealed very high standard devia-tions for several compounds determined. It shows that DSC-C8 and LC-C18 do not have a good repeatability and should not be used.
Method performance
[image:4.595.66.534.101.263.2]The quality parameters such as recovery values, relative standard deviation (RSD), the limits of Table 1. Absolute recovery (%) of phenolic substances ± standard deviation (%) (sample 7)
Compound Oasis®-MAX AccuBond C18 DPA-6S DSC-C8 DSC-Ph LC-C18
[image:4.595.306.531.582.756.2]Gallic acid 9.1 ± 0.9 14.3 ± 2.0 34.5 ± 2.1 24.3 ± 1.3 21.5 ± 1.3 22.9 ± 3.2 Protocatechuic acid 67.3 ± 0.2 95.1 ± 0.3 67.1 ± 4.8 92.7 ± 9.6 11.1 ± 1.3 14.6 ± 4.0 Catechin 87.5 ± 1.9 93.0 ± 16.3 56.4 ± 3.6 78.6 ± 5.8 103.5 ± 2.7 74.4 ± 22.6 Caffeic acid 63.7 ± 2.4 15.2 ± 4.7 56.0 ± 2.5 31.1 ± 2.0 14.8 ± 1.8 25.8 ± 2.1 Epicatechin 65.6 ± 0.1 15.4 ± 2.8 40.7 ± 4.7 64.1 ± 8.1 17.0 ± 0.7 37.8 ± 11.1 p-Coumaric acid 72.6 ± 0. 7 34.7 ± 5.0 85.5 ± 4.2 93.3 ± 4.2 34.6 ± 1.6 70.6 ± 9.1 Ferulic acid 63.8 ± 1.8 72.4 ± 6.4 102.5 ± 8.4 92.6 ± 15.8 92.5 ± 2.8 62.4 ± 18.5 Salicylic acid 77.8 ± 4.1 78.1 ± 0.5 63.2 ± 0.1 106.7 ± 19.8 84.6 ± 0.3 102.0 ± 50.4 Quercetin 102.7 ± 1.6 76.7 ± 1.0 96.2 ± 5.7 111.8 ± 14.4 47.0 ± 6.0 75.5 ± 8.0
Table 2. Method performance: relative standard deviation, limit of detection and limit of quantification (sample 7, cartridge Oasis®-MAX)
Compound RSD (%) (mg/l)LOD (mg/l)LOQ
Gallic acid 8 0.05 0.15
Protocatechuic acid 2 0.11 0.38
(+)-Catechin 4 0.29 0.78
Caffeic acid 3 0.06 0.21
(–)-Epicatechin 4 0.23 0.76
p-Coumaric acid 2 0.04 0.14
Ferulic acid 2 0.07 0.22
Salicylic acid 5 0.41 0.80
detection (LOD) and quantification (LOQ), were evaluated with the cartridge Oasis®-MAX. The
method performance results are demonstrated in Table 2. The recovery and RSD of the method were assessed by analysing 5 samples (n = 5) on the same day. The values show good precision of the method proposed (RSD < 10%, recovery > 60% except gallic acid).
The limits of detection (LOD) and quantification (LOQ) were evaluated on the basis of the signal obtained (n = 5). LOD and LOQ were defined as the
concentration of the analyte that produced the signal to noise ratio of three and ten, respectively; lower than 0.4 and 0.8 mg/l for all target compounds.
Polyphenol content in beer samples
[image:5.595.75.523.83.294.2]Seven beer samples produced by different Czech breweries were analysed. The identification of the peaks was carried out by their retention times in comparison with the standards, and the UV spectra of the samples and standards acquired by Figure 4. Chromatogram of spiked beer sample before SPE: 1 – gallic acid, 2 – protocatechuic acid, 3 – gentistic acid, 4 – catechin, 5 – caffeic acid, 6 – epicatechin, 7 – p-coumaric acid, 8 – ferulic acid, 9 – salicylic acid, 10 – quercetin
0.00 5.00 10.00 15.00 20.00 25.00 30.00 35.00
Time (min)
0.12 0.10 0.08 0.06 0.04 0.02 0.00 –0.02
A
U
Figure 5. Chromatogram of spiked beer sample after SPE on DPA-6S cartridge: 1 – gallic acid, 2 – protocatechuic acid, 3 – gentistic acid, 4 – catechin, 5 – caffeic acid, 6 – epicatechin, 7 – p-coumaric acid, 8 – ferulic acid, 9 – salicylic acid, 10 – quercetin
0.00 5.00 10.00 15.00 20.00 25.00 30.00 35.00
Time (min)
0.12 0.10 0.08 0.06 0.04 0.02 0.00
A
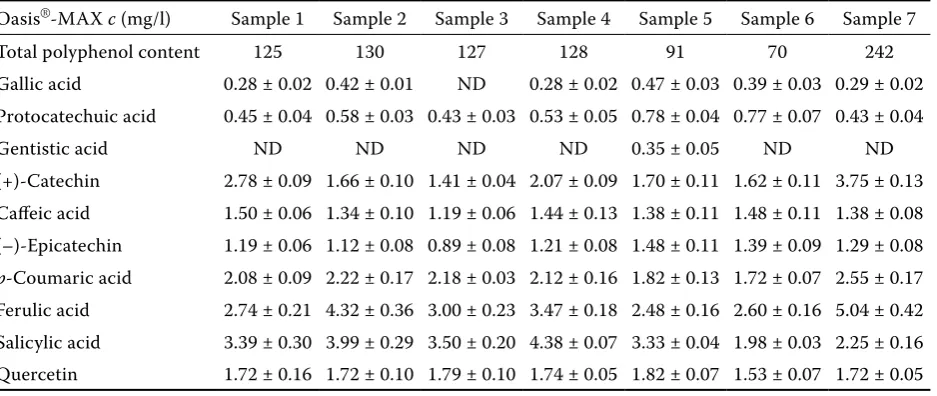
[image:5.595.64.511.498.712.2]photodiode array detector were compared. The results of the polyphenol content determination in the beer samples are shown in Table 3. Total polyphenol content ranged from 70 to 242 mg/l. The content of ferulic acid ranged from 2.48 to 5.04 mg/l, of salicylic acid from 1.98 to 4.38 mg/l, and of p-coumaric acid from 1.72 to 2.55 mg/l; these were found to be the highest. On the other hand, the content of gentistic acid ranged from ND to 0.35 mg/l and that of (–)-epicatechin ranged from 0.89 to 1.48 mg/l; these were found in the lowest concentrations. Ferulic acid concentrations are higher than p-coumaric acid concentrations since ferulic acid is formed from p-coumaric acid via the shikimic acid pathwayasdescribed by Kenyhercz and Kissinger (1977).
The levels of polyphenols found are in agreement with the data already published. McMurrough et al. (1984) determined the total content of phenolic acids in beers. The concentration range found was from 5 to 8 mg/l. The predominant acids were vanilic, p-coumaric, and ferulic acids. Hayes et al.(1987) determined the phenolic compounds commonly as benzoic acid derivatives, protocate-chuic and gallic acids as cinnamic acid derivatives, caffeic acid, p-coumaric and ferulic, finally (+)-ca- techin and (–)-epicatechin were also quantified. Floridi et al. (2003) determined 19 phenolic com-pounds in beer; average values of 23 different samples were 0.6 mg/l for gallic acid, 0.84 mg/l for protocatechuic acid, 0.4 mg/l for gentistic acid, 0.6 mg/l for caffeic acid, 1.4 mg/l for p-coumaric
acid, 2.4 mg/l for ferulic acid, and 2.9 mg/l for salicylic acid, respectively. García et al.(2004) compared the contents of ten polyphenols in nine alcohol-free beer samples produced in different Spanish breweries. Total content of the polyphenols selected ranged from 3.5 to 8.5 mg/l. The content of ferulic acid ranged from 0.7 to 2.3 mg/l, of p-coumaric acid from 0.1 to 0.7 mg/l, of caffeic acid from 0.2 to 0.4 mg/l, of protocatechuic acid from 0.7 to 5.1 mg/l, and finally of (+)-catechin from 0.3 to 4.5 mg/l.
ConCLUSionS
The optimised method is presented as an an-alytical tool for the determination of phenolic compounds in beer. The most convenient SPE cartridges for the pre-concentration of polyphe-nols and elimination of interfering substances that provide a low standard deviation and a good recovery are Oasis®-MAX anion-exchange
car-tridge and polyamide carcar-tridge DPA-6S. Their application to commercial beer samples ensures that the resulting levels of polyphenols do not affect the beer flavour and stability. Also very good recoveries were found with cartridges DSC C8 and LC C18, unfortunately, however, with very high standard deviations for the majority of the compounds determined. Gentistic acid was not detected in most of the samples.
The performance of the method for Oasis®-MAX
[image:6.595.66.535.115.313.2]was assessed by the evaluation of parameters such
Table 3. Polyphenol content (mean value ± standard deviation in mg/l) in beer samples with SPE on Oasis-MAX,
ND < LOD
Oasis®-MAX c (mg/l) Sample 1 Sample 2 Sample 3 Sample 4 Sample 5 Sample 6 Sample 7
Total polyphenol content 125 130 127 128 91 70 242
Gallic acid 0.28 ± 0.02 0.42 ± 0.01 ND 0.28 ± 0.02 0.47 ± 0.03 0.39 ± 0.03 0.29 ± 0.02 Protocatechuic acid 0.45 ± 0.04 0.58 ± 0.03 0.43 ± 0.03 0.53 ± 0.05 0.78 ± 0.04 0.77 ± 0.07 0.43 ± 0.04
Gentistic acid ND ND ND ND 0.35 ± 0.05 ND ND
(+)-Catechin 2.78 ± 0.09 1.66 ± 0.10 1.41 ± 0.04 2.07 ± 0.09 1.70 ± 0.11 1.62 ± 0.11 3.75 ± 0.13 Caffeic acid 1.50 ± 0.06 1.34 ± 0.10 1.19 ± 0.06 1.44 ± 0.13 1.38 ± 0.11 1.48 ± 0.11 1.38 ± 0.08 (–)-Epicatechin 1.19 ± 0.06 1.12 ± 0.08 0.89 ± 0.08 1.21 ± 0.08 1.48 ± 0.11 1.39 ± 0.09 1.29 ± 0.08 p-Coumaric acid 2.08 ± 0.09 2.22 ± 0.17 2.18 ± 0.03 2.12 ± 0.16 1.82 ± 0.13 1.72 ± 0.07 2.55 ± 0.17 Ferulic acid 2.74 ± 0.21 4.32 ± 0.36 3.00 ± 0.23 3.47 ± 0.18 2.48 ± 0.16 2.60 ± 0.16 5.04 ± 0.42 Salicylic acid 3.39 ± 0.30 3.99 ± 0.29 3.50 ± 0.20 4.38 ± 0.07 3.33 ± 0.04 1.98 ± 0.03 2.25 ± 0.16 Quercetin 1.72 ± 0.16 1.72 ± 0.10 1.79 ± 0.10 1.74 ± 0.05 1.82 ± 0.07 1.53 ± 0.07 1.72 ± 0.05
as absolute recovery (higher than 60%, except of gallic acid), relative standard deviation (lower than 10%), limit of detection (ranged from 0.04 to 0.41 mg/l), and limit of quantification (ranged from 0.14 to 0.80 mg/l).
references
Anonymous (1998): Analytica EBC (Analityca Euro-pean Brewery Convention). 5th Ed. Verlag Hans Carl Getränke-Fachverlag, Nürnberg.
Andersen M.L., Lauridsen R.K., Skibsted L.H. (2003): Optimizing the use of phenolic compounds in foods, Phytochemical Functional Foods. CRC Press LLC, Boca Raton: 315–346.
Betes-Saura C., Andrés-Lacueva C., Lamuela-Ra- ventos R.M. (1996): Phenolics in white free run juices and wines from Pened’es by High-Performance Liquid Chromatography. Journal of Agriculture and Food Chemistry, 44: 3040–3046.
Čepička J., Karabín M. (2002): Polyfenolové látky piva – přirozené antioxidanty. Chemické Listy, 96: 90–95. Dvořáková M., Dostálek P. (2006): Analytical methods
for determination of polyphenols in sweet wort, wort and beer. Kvasný Průmysl, 52: 111–114.
Es-Safi N., Fulcrand H., Cheynier V., Moutonet M. (1999): Competition between (+)-catechin and (–)-epi- catechin in acetaldehyde-induced polymerization of flavonols. Journal of Agriculture and Food Chemistry,
47: 2088–2095.
Floridi S., Montanari L., Marconi O., Fantozzi P. (2003): Determination of free phenolic acids in wort and beer by coulometric array detection. Journal of Agriculture and Food Chemistry, 51: 1548–1554. García A.A., Grande B.C., Gádara J.S. (2004):
Develop-ment of rapid method based on solid-phase extraction and liquid chromatography with ultraviolet absorbance detection for determination of polyphenols in alcohol-free beers. Journal of Chromatography, A, 1054: 175–180. Goupy P., Hugues M., Boivin P., Amiot M.J. (1999):
Antioxidant compounds of barley (Hordeum vulgare) and malt extracts. Journal of the Science of Food and Agriculture, 79: 1625–1634.
Guillen D.A., Merello F., Barroso C.G., Perez-Bustamante J.A. (1997): Solid phase extraction for sample preparation in the HPLC analysis of
polyphe-nolic compounds in “Fino” sherry wine. Journal of Agriculture and Food Chemistry, 45: 403–406. Hayes J.P., Smyth M.R., McMurrough I. (1987):
Com-parison of electrochemical and ultraviolet detection in High-Performance Liquid Chromatography for the determination of phenolic compounds commonly found in beers. Analyst, 112: 1197–1207.
Karagiannis S., Economou A., Lanaridis P. (2000): Phenolic and volatile composition of wines made from
Vitis vinifera cv. Muscat lefko grapes from the island
of Samos. Journal of Agriculture and Food Chemistry,
48: 5369–5375.
Kenyhercz T.M., Kissinger P.T. (1977): A new approach to the phenolic components in beer. Application to the determination of sinapic, ferulic, and p-coumaric acids. Journal of Agriculture and Food Chemistry,
25: 959–961.
McMurrough I., Roche G.P., Cleary K.G. (1984): Phenolic acid in beers and worts. Journal of the Insti-tute of Brewing, 90: 181–187.
Montanari L., Perreti G., Patella F., Giudi A., Fantozzi P. (1999): Organic and phenolic acids in beer. Lebensmittel-Wissenschaft & Technologie, 32: 535–539.
Pascual-Teresa S., Santos-Buelga C., Rivas-Gonza-lo J.C. (2000): Quantitative analysis of flavan-3-ols in spanish foodstuffs and beverages. Journal of Agriculture and Food Chemistry, 48: 5331–5337.
Robbins R.J. (2003): Phenolic acids in foods: An overview of analytical methodology. Journal of Agriculture and Food Chemistry, 51: 2866–2887.
Sánchez F.G., Carnero C., Heredia A. (1988): Deter-mination of p-coumaric and ferulic acids in mixtures by isodifferential derivative spectrophotometry. Analytical Letters, 21: 1243–1257.
Shahidi F., Naczk M. (1995): Food Phenolics; Sources, Chemistry, Effects, Applications. Technomic Publishing Co. Inc., Lancaster: 10–13.
Skerikova V., Grynova L., Jandera P. (2004): Using CoulArray detector for analysis of natural antioxidants. Chemické Listy, 98: 343–348.
Whittle N., Eldridge H. (1999): Identification of the polyphenols in barley and beer by HPLC/MS and HPLC/ electrochemical detection. Journal of the Institute of Brewing, 105: 89–99.
Received for publication August 31, 2006 Accepted after corrections April 18, 2007
Corresponding author:
Ing. Markéta Dvořáková, Vysoká škola chemicko-technologická v Praze, Fakulta potravinářské a biochemické technologie, Ústav kvasné chemie a bioinženýrství, Technická 5, 166 28 Praha 6, Česká republika