University of South Carolina
Scholar Commons
Theses and Dissertations
2017
Molecular Exploration of Bioavailable Dissolved
Organic Matter Across Aquatic Ecosystems
Yuan Shen
University of South Carolina
Follow this and additional works at:https://scholarcommons.sc.edu/etd Part of theMarine Biology Commons
This Open Access Dissertation is brought to you by Scholar Commons. It has been accepted for inclusion in Theses and Dissertations by an authorized administrator of Scholar Commons. For more information, please [email protected].
Recommended Citation
Shen, Y.(2017).Molecular Exploration of Bioavailable Dissolved Organic Matter Across Aquatic Ecosystems.(Doctoral dissertation).
M
OLECULAR EXPLORATION OF BIOAVAILABLE DISSOLVED ORGANIC MATTER ACROSS AQUATIC ECOSYSTEMSby
Yuan Shen
Bachelor of Science Xiamen University, 2009
Master of Science
University of South Carolina, 2011
Submitted in Partial Fulfillment of the Requirements
For the Degree of Doctor of Philosophy in
Marine Science
College of Arts and Sciences
University of South Carolina
2017
Accepted by:
Ronald Benner, Major Professor
James Pinckney, Committee Member
Lori Ziolkowski, Committee Member
Karl Kaiser, Committee Member
DEDICATION
I would like to dedicate this dissertation to my wife Jiani Zheng and my parents
ACKNOWLEDGEMENTS
I would like to express my deepest appreciation to my advisor, Professor Ronald
Benner, for his guidance, patience, encouragement, and support. His enthusiasm, vision,
and creative thinking have been a great influence on me throughout my graduate studies.
He made every project that we worked together so much enjoyable. One could not ask for
a better advisor. I thank James Pinckney, Lori Ziolkowski, and Karl Kaiser for being on
my committee and providing helpful comments and suggestions. I am very much
thankful to Karl Kaiser and Cédric Fichot for teaching me the amino acid analysis and the
DOC and CDOM analyses, respectively. I also thank my other lab mates and colleagues,
Mike Philben, Oliver Lechtenfeld, Shengkang Liang, Qinghui Huang, Dandan Duan,
Tae-Hoon Kim, Doug Bell, etc. for their companionship and the fun chatting on science
and life. Special thanks go to my friends at the Gamecock Badminton Club (Richard
Cheng, Xinyu Huang, Xinfeng Liu, Jo Evaristo, Xiaolong Liu, etc.), I appreciate their
friendship and the good times that we spent together making my journey more joyful and
memorable. Finally, I thank my collaborators for their contributions to this work and the
ABSTRACT
Dissolved organic matter (DOM) in aquatic ecosystems is a large reservoir of
reduced carbon that is mostly resistant to degradation. A small fraction of DOM cycles
relatively quickly and is biologically utilized on timescales of days to months. This
bioavailable DOM (BDOM) supports aquatic food webs, drives major elemental cycles,
and is coupled to atmospheric CO2. Despite wide-ranging importance, bioavailability of
DOM and its linkages to ecosystem properties (e.g., primary production, nutrients) are
poorly characterized, particularly at the ecosystem level. Bioassay experiments are
commonly used to determine BDOM, but this approach alters conditions and has limited
spatial and temporal coverage. In this dissertation, biochemical indicators of DOM
bioavailability were developed and implemented in a wide range of ecosystems to reveal
large-scale distributions of BDOM in the Arctic (Chapter 1) and Antarctic Oceans
(Chapter 2), locate seasonal biological hotspots in a subtropical ocean margin (Chapter
3), and to trace transport and fate of BDOM from surface to ground waters (Chapter 4).
Measurements of amino acids, a major bioactive component of BDOM, were
compared between the high (Chukchi Sea) and low (Beaufort Sea) productivity regions of
the western Arctic Ocean. Bulk concentrations of dissolved organic carbon (DOC) were
similar in the two systems despite their contrasting productivity, but DOM bioavailability
as indicated by amino acid yields was much higher in the more productive Chukchi Sea.
The use of amino acids as BDOM indicator was further tested in the Southern
Ocean during austral winter when primary production is light-limited and minimal. The
sampling encompassed ice-covered and ice-free waters along a latitudinal gradient in the
region of the Antarctic Peninsula, one of the fastest warming regions on Earth. Unlike the
DOC that varied irregularly, amino acid-based indices illustrated a significant northward
increase in DOM bioavailability from ice-covered to open waters. Overall, the
observations in the polar oceans indicate a correspondence between DOM bioavailability
and nutrient- and light-driven changes in ecosystem productivity.
A novel approach using two biochemical indicators (amino acids and
carbohydrates) of BDOM was developed during a large-scale seasonal survey of the
river-influenced Louisiana margin. These indicators revealed patchy distributions of
compositionally distinct types of BDOM hotspots that varied with phytoplankton biomass
and nutrient levels, and they further indicated a diel variability in sources of BDOM, with
zooplankton grazing at night and phytoplankton extracellular release during daytime
under nutrient limitation.
Biochemical indicators were extended to surface and groundwater in South
Carolina. Amino acids, lignin phenols, and chromophoric DOM were monitored monthly
over two years. Linking groundwater DOM with surface water DOM and precipitation
revealed differential transport of hydrophilic and hydrophobic molecules through soils
and depletion of BDOM in groundwater. These observations guided a development of the
Regional Chromatography Model to illustrate processes regulating the composition and
TABLE OF CONTENTS
DEDICATION ... iii
ACKNOWLEDGEMENTS ... iv
ABSTRACT ...v
LIST OF TABLES ... viii
LIST OF FIGURES ... ix
LIST OF ABBREVIATIONS ... xi
CHAPTER 1:DISSOLVED ORGANIC MATTER COMPOSITION AND BIOAVAILABILITY REFLECT ECOSYSTEM PRODUCTIVITY IN THE WESTERN ARCTIC OCEAN ...1
CHAPTER 2BIOAVAILABLE DISSOLVED ORGANIC MATTER AND BIOLOGICAL HOT SPOTS DURING AUSTRAL WINTER IN ANTARCTIC WATERS ...29
CHAPTER 3BIOLOGICAL HOT SPOTS AND THE ACCUMULATION OF MARINE DISSOLVED ORGANIC MATTER IN AHIGHLY PRODUCTIVE OCEAN MARGIN ...54
CHAPTER 4ORIGINS AND BIOAVAILABILITY OF DISSOLVED ORGANIC MATTER IN GROUNDWATER ...86
CHAPTER 5OVERVIEW AND SYNTHESIS ...120
REFERENCES ...123
APPENDIX A–SUPPLEMENTARY TABLES ...143
APPENDIX B–SUPPLEMENTARY FIGURES ...144
LIST OF TABLES
Table 1.1 Physicochemical characteristics in the Chukchi and Beaufort Seas ...19
Table 1.2 Comparisons of concentrations of DOC and TDAA, and TDAA yields ...20
Table 1.3 Comparisons of concentrations of DOC and TDAA, and TDAA yields ...21
Table 2.1 Summary of oceanographic parameters at the sampling stations ...46
Table 2.2 Physicochemical properties of water masses and biological hotspots ...47
Table 3.1 Average values and ranges for DOC, TDAA, and TDNS in the mixed layer during the five cruises on the Louisiana margin ...75
Table 3.2 Concentrations and compositions of DOM during the shipboard bioassays ...76
Table 3.3 Surface mixed layer reservoirs of DOC on the Louisiana shelf ...77
Table 4.1 DOC and amino acids in ground and surface waters and freshly-produced bacterial DOM ...106
Table 4.2 Optical properties of DOM in ground and surface waters ...108
Table 4.3 Correlation matrix between precipitation and DOM in groundwater ...109
Table 4.4 Lignin phenols in ground and surface waters ...110
LIST OF FIGURES
Figure 1.1 Locations of sampling stations in the western Arctic Ocean ...22
Figure 1.2 Mixing patterns of DOM in the Mackenzie River plume ...23
Figure 1.3 Concentrations of DOC in the Chukchi Sea and Beaufort Sea ...24
Figure 1.4 Concentrations of TDAA in the Chukchi Sea and Beaufort Sea ...25
Figure 1.5 DOC-normalized yields of TDAA in the Chukchi Sea and Beaufort Sea ...26
Figure 1.6 Average concentrations of DOC and TDAA, and TDAA yields in the Chukchi and Beaufort Seas ...27
Figure 1.7 Average concentrations of DOC and TDAA, and TDAA yields in the Chukchi Sea between 2002 and 2004 ...28
Figure 2.1 Sampling sites off the South Shetland Islands (Antarctica) in August 2012 ...48
Figure 2.2 Distributions of temperature and salinity ...49
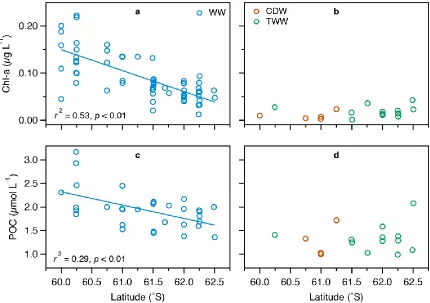
Figure 2.3 Latitudinal distributions of chl-a and POC in different water masses ...50
Figure 2.4 Latitudinal distributions of DOC and TDAA in different water masses ...51
Figure 2.5 Profiles of chl-a, DOC, TDAA and POC at ice-free and ice-covered stations 52 Figure 2.6 Depth profiles of TDAA yields, glycine, nonprotein amino acids, and D-amino acids at four ice-free stations ...53
Figure 3.1 Study area and sampling sites on the Louisiana margin ...78
Figure 3.2 Seasonal and spatial distributions of DOC, TDAA, and TDNS ...79
Figure 3.3 Seasonal distributions of TDAA and TDNS yields ...80
Figure 3.5 Conceptual illustration showing estimation of accumulated marine DOC ...82
Figure 3.6 Seasonal and spatial distributions of marine DOC (total and accumulated) ....83
Figure 3.7 Surface concentrations of accumulated marine DOC on the margin ...84
Figure 3.8 Average concentrations of DOC and accumulated marine DOC ...85
Figure 4.1 Temporal variations of DOC, a254, TDAA, and D-AA in groundwater ...112
Figure 4.2 Concentrations of DOC and TDAA during bioassay experiments ...113
Figure 4.3 Yields of TDAA during the unamended experiments, and relationship between bioavailable DOC and TDAA yields ...114
Figure 4.4 Seasonal variations of bioavailable DOC in groundwater and precipitation .115 Figure 4.5 Percentages of glycine, γ-Aba, and D-amino acids during the unamended experiments and in the field samples ...116
Figure 4.6 Seasonal variations in percentages of glycine, γ-Aba, and D-amino acids ...117
Figure 4.7 Seasonal variations in DOC, SUVA254, and bacterial DOC ...118
LIST OF ABBREVIATIONS
Ala ... Alanine
AMLR ... Antarctic Marine Living Resources
AR ... Atchafalaya River
Arg ... Arginine
Asx ... Asparagine + Aspartic Acid
β-Ala ... beta-Alanine
CDOM... Chromophoric Dissolved Organic Matter
CDW ... Circumpolar Deep Water
Chl-a ... Chlorophyll-a
CO2 ... Carbon Dioxide
CTD... Conductivity–Temperature–Depth
CuO ... Cupric Oxide
DOC ... Dissolved Organic Carbon
DOM ... Dissolved Organic Matter
γ-Aba ... gamma-Aminobutyric Acid
GF/F ...Glass Fiber Filter
Gly... Glycine
Glx... Glutamine + Glutamic Acid
His ... Histidine
Ile ... Isoleucine
Leu ... Leucine
Lys... Lysine
M-ARS ... Mississippi-Atchafalaya River System
mDOC ... Marine Dissolved Organic Carbon
MR ... Mississippi River
NGoM ... Northern Gulf of Mexico
PAL ... p-hydroxybenzaldehyde
PAD... p-hydroxybenzoic acid
Phe... Phenylalanine
PON... p-hydroxyacetophenone
S275-295 ... Spectral Slope Coefficient in the 275-295 nm range
S350-400 ... Spectral Slope Coefficient in the 350-400 nm range
SAL ... Syringylaldehyde
SAD... Syringic Acid
Ser ... Serine
SON... Acetosyringone
SR ... Ratio of S275-295 to S350-400
SSI ... South Shetland Islands
SUVA254 ...Specific UV Absorbance at 254 nm
TBW ... Transitional Bellingshausen Water
TDLP... Total Dissolved Lignin Phenols
tDOC ... Terrigenous Dissolved Organic Carbon
Thr ... Threonine
Tyr ... Tyrosine
TWW... Transitional Weddell Water
USGS ...U.S. Geological Survey
UV ... Ultraviolet
Val ... Valine
VAL ... Vanillin
VAD ... Vanillic Acid
VON ... Acetovanillone
CHAPTER
1
D
ISSOLVED ORGANIC MATTER COMPOSITION AND BIOAVAILABILITY REFLECT ECOSYSTEM PRODUCTIVITY IN THEW
ESTERNA
RCTICO
CEAN11.1 INTRODUCTION
Two contrasting systems, the Chukchi and Beaufort Seas, occur adjacent to each
other in the western Arctic Ocean. The Chukchi Sea is a large (620×103 km2) and shallow
(~80 m avg.) inflow shelf area that receives nutrient-rich Pacific waters via Bering Strait,
which support a very productive ecosystem (Jakobsson et al. 2004; Sakshaug 2004;
Grebmeier et al. 2006). In comparison, the Beaufort Sea is a narrow and small (178×103
km2) river-influenced interior shelf that is relatively deep (~124 m avg.) (Jakobsson et al.
2004). The major nutrient sources to the Beaufort shelf are the Mackenzie River and
upwelling (Macdonald et al. 1987). Primary productivity is limited in regions of the
Beaufort shelf due to the high water turbidity and stratification caused by coastal erosion
and river runoff (Carmack and Wassmann 2006).
The distinct shelf typology and nutrient supply lead to the contrasting productivity
between the Chukchi and Beaufort Seas. Primary productivity in the Chukchi Sea
parallels nutrient concentrations and increases from 30–90 g C m-2 yr-1 in the northeast to
1 Shen, Y., C. G. Fichot, and R. Benner. 2012. Dissolved organic matter composition and
bioavailability reflect ecosystem productivity in the Western Arctic Ocean.
720 g C m-2 yr-1 in the southwest (Walsh et al. 1989; Springer and Mcroy 1993; Cota et
al. 1996; Hill and Cota 2005). Areas associated with seasonal upwelling, such as Barrow
Canyon, are typically more productive (e.g., 8 g C m-2 d-1) than adjacent waters (Hill and
Cota 2005). In contrast, primary productivity in the Beaufort Sea is relatively low (10–70
g C m-2 yr-1) due to lower nutrient availability and reflects the strong influence from the
Mackenzie River (Carmack et al. 2004; Sakshaug 2004; Lavoie et al. 2009). Shelf waters
are less productive within the river plume (e.g., < 10 g C m-2 yr-1) as a result of limited
light penetration and become more productive outside the plume (30–70 g C m-2 yr-1)
(Sakshaug 2004; Carmack and Wassmann 2006). Relatively high primary production is
observed in the eastern Beaufort Sea where the Cape Bathurst polynya forms during
May–June at the entrance to the Amundsen Gulf. These open waters extend the
phytoplankton growth season, resulting in elevated primary production (Arrigo and Van
Dijken 2004; Brugel et al. 2009).
Off-shelf transport of organic matter from productive shelf waters is thought to be
an important carbon source for heterotrophic metabolism in the interior Arctic basins
(Walsh et al. 1989; Davis and Benner 2005; Davis and Benner 2007; Mathis et al.
2007b). The disparity between a large metabolic demand for carbon in the basins and low
concentrations of particulate organic carbon (POC) suggests the shelf-basin connection
likely relies on dissolved organic carbon (DOC) (Wheeler et al. 1997). The extent of this
reliance, however, is largely determined by the concentrations and bioavailability of
dissolved organic matter (DOM), which are likely to vary spatially and temporally along
therefore requires the assessment of DOM bioavailability under varying productivity
regimes.
DOM is often categorized into three pools of reactivity, labile, semi-labile and
refractory, which have broadly defined turnover times of hours to weeks, months to years
and centuries to millennia, respectively (Kirchman et al. 1993; Carlson and Ducklow
1995). Labile DOM is often operationally defined using bioassay experiments, but this
approach has limited utility for defining semi-labile and refractory DOM (Ogura 1975;
Søndergaard and Middelboe 1995; Del Giorgio and Davis 2002; Benner 2003). The
inherent biochemical properties of DOM shape its bioavailability, which in combination
with environmental conditions and microbial community composition, determine the
turnover time of labile and semi-labile DOM. Herein, we use amino acids as molecular
indicators of the bioavailability of DOM (Benner 2003). Amino acids are the building
blocks of peptides and proteins, and they are abundant in plankton and plankton-derived
DOM (Lee et al. 2004; Davis and Benner 2007). They are bioreactive components of
labile and semi-labile DOM, making them good indicators of the bioavailability of DOM
in aquatic systems (Amon et al. 2001; Davis and Benner 2007; Davis et al. 2009).
High concentrations of bioavailable DOM, as indicated by high concentrations
and DOC-normalized yields of total dissolved amino acids (TDAA), are observed in the
Chukchi Sea (Davis and Benner 2005; Davis and Benner 2007). It is speculated that
bioavailable DOM produced in the Chukchi shelf is entrained into the halocline of the
Canadian Basin and fuels oxygen utilization there (Walsh et al. 1997; Davis and Benner
2007). It is unclear whether a similar process is active in the Beaufort Sea due to a
productive than the Beaufort Sea, differences in surface-water concentrations of DOC are
not apparent (Davis and Benner 2005; Guéguen et al. 2005; Mathis et al. 2005). In the
present study, the concentrations of DOC and TDAA in the Chukchi and Beaufort Seas
were compared to investigate the composition and bioavailability of DOM in these
adjacent but quite different systems. Our results reveal that the contrasting productivity
between the Chukchi and Beaufort Seas is reflected in DOM bioavailability, as indicated
by the concentrations and yields of TDAA.
1.2 METHODS
The Chukchi and Beaufort Seas were surveyed during four summer cruises of
three different Arctic projects (Figure 1.1). In 2002 (17 July–21 August) and 2004 (18
July–26 August), water samples from the Chukchi Sea and the adjacent Canada Basin
were collected aboard the research vessel USCGC Healy, as part of the Western Arctic
Shelf-Basin Interactions (SBI) project (http://www.eol.ucar.edu/ projects/sbi/). In 2008
(19 July–29 July), water samples were collected from the Mackenzie River plume,
Beaufort Sea, and Amundsen Gulf on the CCGS Amundsen, as part of the Circumpolar
Flaw Lead (CFL) program (http://web.mac.com/barber1818/iWeb/IPY-CFL/). In 2009
(27 July–27 August), waters in the Mackenzie River plume, Beaufort Sea, and Canada
Basin were sampled on the CCGS Amundsen as part of the Malina (MAL) program
(http://malina.obs-vlfr.fr/). Water samples from the four cruises were collected at various
depths using Niskin bottles mounted on a rosette with a conductivity-temperature-depth
(CTD) sensor. Samples were filtered through combusted (450˚C, 4 h) GF/F glass fiber
bottles until analyses of DOC, total dissolved nitrogen (TDN), and TDAA were
performed in the home laboratory. The HDPE bottles were soaked in 0.5 mol L-1
hydrochloric acid (HCl) for 24 h and rinsed with Milli-Q UV-Plus water before cruises.
The broad spatial scale of sampling sites in this study covers a wide range of
environments that vary in primary productivity. The SBI 2002 and 2004 cruises covered
relatively productive waters of the Chukchi Sea, which receives nutrient-rich water from
the Pacific Ocean, whereas the CFL 2008 and MAL 2009 cruises covered the less
productive southern Beaufort Sea, which is influenced by runoff from the Mackenzie
River. In this study, sampling regions were separated into shelf (bottom depth ≤ 100 m,
salinity ≥ 27.0), slope (100 m < bottom depth ≤ 1000 m), and basin (bottom depth > 1000
m) areas. In the slope and basin regions, surface water was defined as 0–80 m depth,
which includes the chlorophyll maximum layer. The upper halocline in the slope and
basin was delimited by depth (80–180 m) and salinity (32.0 ≤ salinity ≤ 33.9; Table 1.1).
Aliquots of filtered (Whatman GF/F; 0.7-μm nominal pore-size) water samples
were acidified to pH ≈ 2 with 2 mol L-1 HCl for DOC and TDN analyses. DOC and TDN
were measured using high temperature combustion and a Shimadzu TOC-V analyzer
equipped with an inline chemiluminescence nitrogen detector (Shimadzu TN-1) (Davis
and Benner 2005). Milli-Q UV-Plus water (blank) and reference standards (deep
Sargasso Sea water obtained from the University of Miami) were injected every 6th
sample to check the accuracy of the measurements (Benner and Strom 1993). Blanks
were negligible and values for reference standards were within 5% of reported values.
Aliquots of filtered water samples were hydrolyzed for analysis of TDAA using
fluorescence detector (Excitation: 330 nm; Emission: 450 nm). Water samples were dried
with pure nitrogen gas and hydrolyzed using a vapor phase method with 6 mol L-1 HCl at
150˚C for 32.5 min. After neutralization, TDAA were measured as o-phthaldialdehyde
(OPA) derivatives following the method of Kaiser and Benner (2005). The separation of
compounds was performed on a Licrosphere RP18 (4.6×150 mm, 5 μm particles) or a
Zorbax SB-C18 (4.6×150 mm, 3.5 μm particles) column. Eighteen amino acids were
included in the analysis: asparagine + aspartic acid (Asx), glutamine + glutamic acid
(Glx), serine (Ser), histidine (His), glycine (Gly), threonine (Thr), β-alanine (β-Ala),
arginine (Arg), alanine (Ala), γ-aminobutyric acid (γ-Aba), tyrosine (Tyr), valine (Val),
phenylalanine (Phe), isoleucine (Ile), leucine (Leu), and lysine (Lys).
DOC-normalized yields of TDAA (%DOC) were calculated as the percentage of
DOC measured as amino acids. The degradation index (DI) is a diagenetic indicator
derived from a principal component analysis of protein amino acid compositions (Dauwe
and Middelburg 1998). In this study, the DI was calculated following the method of
Dauwe et al. (1999), as modified by Kaiser and Benner (2009) for application to DOM.
In general, positive DI values indicate recently produced DOM and declining values
indicate more diagenetically altered DOM (Davis et al. 2009).
Three categories of DOM biological lability (labile, semi-labile, and refractory)
were defined by Davis and Benner (2007) based on DOC-normalized yields of TDAA.
Refractory DOM refers to deep-water DOM (> 1000 m) that has an average TDAA yield
of 0.70%DOC in the Arctic Ocean and is resistant to biological utilization over long
TDAA yields > 0.70%DOC is considered bioavailable, and increasing yields of TDAA
reflect increasing concentrations of bioavailable DOM.
Statistical analyses were performed with SPSS 20.0 (IBM Statistical Package for
the Social Sciences Inc.). The significance of correlations between variables was
determined using the Spearman’s rho test (two-tailed, α = 0.05) because the data were not
normally distributed. Statistical differences were assessed using the Mann-Whitney U test
(two-tailed, α = 0.05) because of unequal group sizes and non-normal distribution of the
data.
1.3 RESULTS
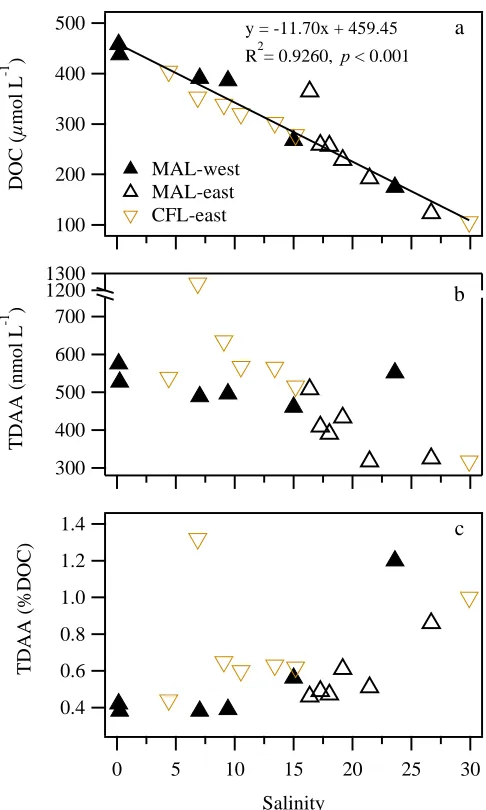
Small boat surveys of surface waters in the Mackenzie River plume (salinity:
0.15–29.90) were conducted during the CFL 2008 and MAL 2009 cruises (Figure 1.1).
Concentrations of DOC ranged from 106 to 458 μmol L-1, with the highest value
occurring in the Mackenzie River (salinity: 0.15). The concentrations of DOC across the
salinity gradient followed a similar conservative mixing trend during the two cruises (R2
= 0.9260, p < 0.001, n = 19; Figure 1.2a). Non-conservative mixing across the salinity
gradient was observed in concentrations of TDAA, and sources of TDAA were evident at
mid salinities (6.5–15.5; Figure 1.2b). DOC-normalized yields of TDAA were minimal in
the river (0.42 %DOC) and progressively increased with salinity (Figure 1.2c). The two
highest yields (1.20 and 1.32 %DOC) were observed at mid-salinity locations with
elevated TDAA concentrations, indicating a plankton source. Yields of TDAA were
generally higher at mid salinities (6.5–15.5) during CFL 2008 than MAL 2009 (Figure
DOC concentrations in Chukchi and Beaufort shelf waters ranged from 59 to 146
μmol L-1 (avg.: 81 μmol L-1) and showed considerable variability at all depths (Figure
1.3a). In comparison, DOC concentrations were lower in slope and basin waters (41–201
μmol L-1; avg.: 67 μmol L-1; Figure 1.3a–c; Table 1.1). Concentration ranges and depth
trends of DOC were similar among cruises, with elevated concentrations occurring in
near surface waters and decreasing concentrations with depth (Figure 1.3b–c).
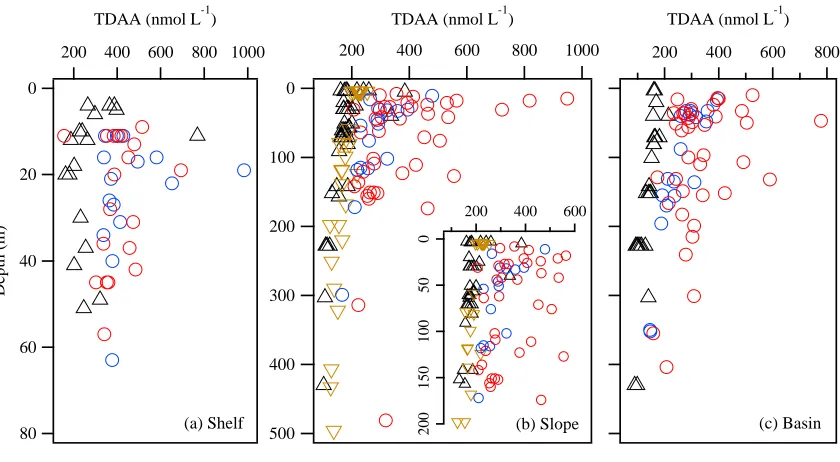
TDAA concentrations in shelf, slope, and basin waters were more variable than
DOC concentrations and ranged from 70 to 983 nmol L-1 (avg.: 311 nmol L-1; Figure
1.4a– c). TDAA concentrations were substantially higher in the Chukchi Sea (SBI 2002,
2004; avg.: 323 nmol L-1) than in the Beaufort Sea (CFL 2008, MAL 2009; avg.: 186
nmol L-1). Peak concentrations of TDAA in shelf waters were typically found at 10–30 m
(Figure 1.4a). Concentrations of TDAA generally declined from shelf waters to slope and
basin waters (Figure 1.4a–c; Table 1.1). Elevated concentrations of TDAA were found at
greater depths (~200 m) in slope and basin waters during SBI 2002 and 2004 (Figure
1.4b–c). Concentrations of TDAA in slope waters during CFL 2008 (avg.: 185 nmol L-1)
were significantly higher than those at similar depths during MAL 2009 (avg.: 161 nmol
L-1; p < 0.05; Figure 1.4b).
DOC-normalized yields of TDAA were much higher in the Chukchi Sea (0.39–
4.23 %DOC, avg.: 1.41%DOC) compared with the Beaufort Sea (0.47–3.29 %DOC,
avg.:0.84 %DOC) (Figure 1.5a–c). Maximal TDAA yields in shelf waters were found at
10–30m (Figure 1.5a). Yields of TDAA in slope and basin waters were particularly high
in the upper 200 m during SBI 2004 and sometimes exceeded those in shelf waters
were significantly higher than those at similar depths during MAL 2009 (avg.: 0.76
%DOC; p < 0.001; Figure 1.5b).
Average amino acid degradation index (DI) values for the four cruises ranged
from 1.58 to 1.08 (Table 1.1). During SBI 2002, 2004, and MAL 2009, DI values
decreased from shelf waters to slope-basin surface waters, and with depth (Table 1.1). An
opposite trend was observed during CFL 2008. In general, DI values were lower in the
Chukchi Sea (SBI 2002, 2004) than in the Beaufort Sea (CFL 2008, MAL 2009) (Table
1.1). The variable DI values reflect amino acid compositional heterogeneity, which is
influenced by source as well as diagenetic alterations. It appears source plays an
important role in shaping DI values in these margin waters, which can have high and
variable contributions of riverine DOM. The DI values for Mackenzie River DOM in
2008 and 2009, 1.34 and 0.37, respectively, were very different indicating large
variability in TDAA composition in riverine DOM. In contrast, the TDAA yields for
Mackenzie River DOM in 2008 and 2009, 0.44 and 0.38 %DOC, respectively, indicating
minimal variability in TDAA yields in riverine DOM. Correlations between DI values
and TDAA yields were quite variable among cruises (SBI 2002: r = 0.9064, p < 0.001;
SBI 2004: r = 0.4694, p < 0.001; CFL 2008: r = 0.2537, p = 0.2945; MAL 2009: r =
0.6838, p < 0.001), and it appears the influence of riverine DOM on DI values contributes
to the weak correlation between DI and TDAA yield during the CFL cruise in 2008.
Based on these observations, TDAA yields were considered better indicators of DOM
bioavailability than DI values. In addition, bioassay experiments with a variety of
substrates in waters from the Chukchi Sea concluded DI values are not reliable indicators
The SBI 2002 and 2004 data were combined to represent the Chukchi Sea region,
and the CFL 2008 and MAL 2009 data were combined to represent the Beaufort Sea
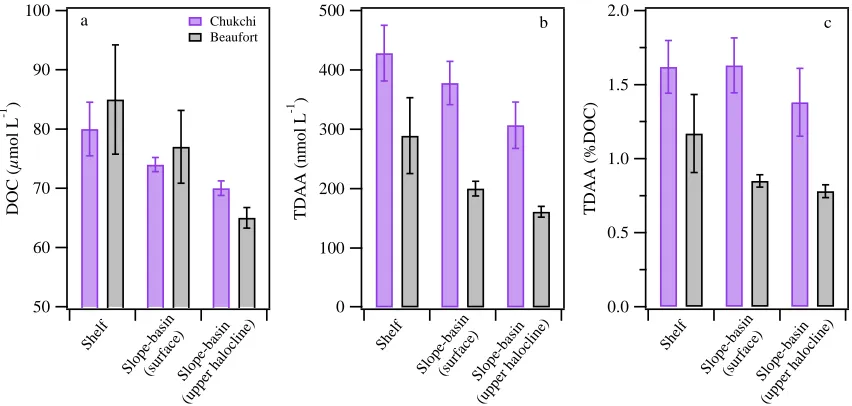
region. In both regions, average concentrations of DOC and TDAA, and TDAA yields
generally decreased from shelf waters to slope-basin surface waters, with a greater
gradient occurring in the Beaufort Sea (Figure 1.6a–c). One exception was that yields of
TDAA in Chukchi shelf and slope-basin surface waters were quite similar (~1.6 %DOC;
Figure 1.6c). Significant differences in DOC concentrations and TDAA yields between
shelf waters and slope-basin surface waters were found in the Beaufort Sea (p < 0.01) but
not in the Chukchi Sea (p > 0.1; Table 1.2; Figure 1.6a, c). Differences in TDAA
concentrations were highly significant among shelf waters, slope-basin surface waters,
and slope-basin upper halocline waters (p < 0.01; Table 1.2; Figure 1.6b). DOC and
TDAA concentrations and TDAA yields in the upper halocline of both regions were
substantially lower than those in shelf waters and slope-basin surface waters (Table 1.2;
Figure 1.6a–c).
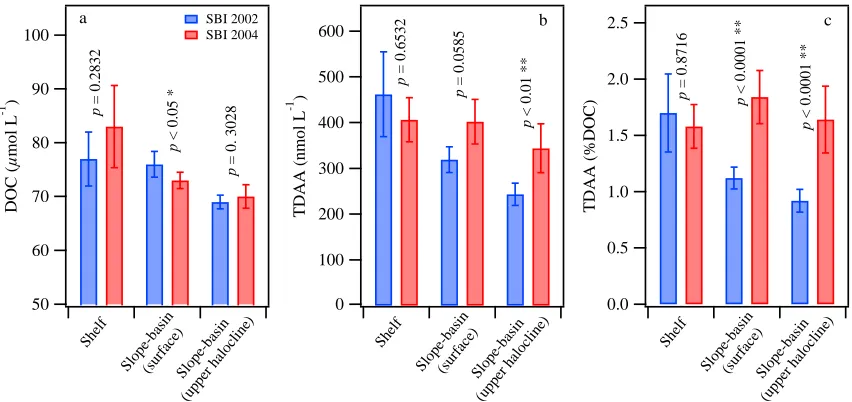
Interannual variation of DOM concentrations and composition in the Chukchi Sea
was examined by comparing data from SBI 2002 with data from SBI 2004. In shelf
waters, none of the three parameters were significantly different between 2002 and 2004
(p > 0.2; Figure 1.7a–c). Differences were significant in slope-basin surface waters,
where DOC concentrations were significantly higher in 2002 (p < 0.05; Figure 1.7a) and
concentrations and yields of TDAA were substantially higher in 2004 (concentration: p =
0.0585, yield: p < 0.0001; Figure 1.7b–c). In contrast to DOC (p = 0.3028; Figure 1.7a),
TDAA concentrations and yields in the upper halocline were significantly higher in 2004
and TDAA yields decreased from shelf to slope-basin waters (Figure 1.7a–c). In 2004,
however, elevated concentrations and yields of TDAA were observed in both slope-basin
surface and upper halocline waters (Figure 1.7b–c), and average yields of TDAA were
even higher in slope-basin surface and upper halocline waters than in shelf waters (Figure
1.7c).
Average DOC concentrations in both shelf waters and slope-basin surface waters
were slightly higher in the Beaufort Sea than in the Chukchi Sea (Figure 1.6a), but not
significantly different (shelf waters: p > 0.4; slope-basin surface waters: p > 0.05; Table
1.3). Significantly higher DOC concentrations were observed in upper halocline waters in
the Chukchi compared with the Beaufort (p < 0.0001; Table 1.3; Figure 1.6a).
Concentrations and yields of TDAA in shelf waters were significantly higher
(~1.5-fold) in the Chukchi than in the Beaufort (p < 0.0001; Table 1.3; Figure 1.6b–c).
The differences in concentrations and yields of TDAA between the two regions were
more pronounced in slope-basin surface and upper halocline waters, with the values in
the Chukchi Sea almost double those in the Beaufort Sea (p < 0.0001; Table 1.3; Figure
1.6b–c).
1.4 DISCUSSION
Surface concentrations of DOC and TDAA in the Chukchi Sea were spatially
variable and generally corresponded with chlorophyll-a concentrations and primary
productivity (Davis and Benner 2005; Hill and Cota 2005; Kirchman et al. 2009a).
Concentrations of DOC and TDAA decreased by ~10% from shelf to slope-basin surface
al. 2009a). DOC-normalized yields of TDAA displayed minor spatial variations in shelf
and slope-basin surface waters. The yields (~1.6 %DOC) were more than 2-fold greater
than those in refractory DOM (0.70 %DOC) (Davis and Benner 2007), indicating a
substantial supply of bioavailable DOM in surface waters of the Chukchi Sea. Maximal
concentrations and yields of TDAA were observed at depths of 10–30 m where
chlorophyll concentrations and primary production were also maximal in summer (Cota
et al. 1996; Hill and Cota 2005). This subsurface maximum was not observed for DOC
concentrations. In comparison, concentrations of DOC and TDAA and yields of TDAA
were significantly lower in the upper halocline (p < 0.01), but TDAA yields (1.38
%DOC) were greater than those of semi-labile and refractory DOM (1.1 and 0.70
%DOC, respectively; Davis and Benner 2007). This indicates that although there was a
substantial drawdown of bioavailable DOM below the euphotic zone, concentrations of
bioavailable DOM remained relatively high in these waters.
The seasonal variability of bioavailable DOM in the Chukchi Sea was previously
described by Davis and Benner (2005, 2007). Here, we further discuss the interannual
variations of bioavailable DOM in different Chukchi regions. Concentrations of DOC and
TDAA and yields of TDAA in shelf waters were high in the summers of 2002 and 2004
and were not significantly different between the two years (p > 0.2), indicating
bioavailable DOM in shelf waters was relatively abundant and displayed small
interannual variations. Concentrations and yields of TDAA decreased by over 30% from
shelf to slope-basin surface waters in 2002. In contrast, in 2004 concentrations of TDAA
in slope-basin surface waters remained high and the TDAA yields were even higher than
g C m-2 d-1) was ~2.5 times higher than that in 2002 (0.24 g C m-2 d-1), but the highest
production in 2004 occurred in shelf waters rather than in slope-basin waters (Kirchman
et al. 2009a). The observations of higher primary production in shelf waters and greater
DOM bioavailability in slope-basin surface waters suggest a rapid off-shelf transport of
bioavailable DOM in 2004. Concentrations and yields of TDAA in upper halocline
waters were significantly higher in 2004 than in 2002 (p < 0.0001). In 2004, the average
yield of TDAA in upper halocline waters (1.64 %DOC) was very similar to that of shelf
waters (1.58 %DOC), thereby suggesting a source of shelf-produced labile DOM (Davis
and Benner 2007). The off-shelf transport of bioavailable DOM, however, was not
apparent in 2002. These comparisons exhibit irregular interannual variability of
bioavailable DOM in different Chukchi regions, as controlled by both biological and
physical processes.
Concentrations of DOC in the Mackenzie River plume ranged from 458 μmol L-1
in the river to 106 μmol L-1 at a salinity of 29.9 and exhibited fairly conservative mixing
across the salinity gradient in 2008 and 2009, as observed previously (Emmerton et al.
2008) and in other Arctic river plumes (Cauwet and Sidorov 1996; Kattner et al. 1999;
Amon 2004). Desorption from sediments and plankton productivity can be major sources
of DOM in river plumes (Macdonald et al. 1998; Benner and Opsahl 2001; Dagg et al.
2004), whereas flocculation, bio- and photo-degradation can be important sinks of DOM
(Chin-Leo and Benner 1992; Uher et al. 2001; Bélanger et al. 2006; Garneau et al. 2006).
Concentrations and yields of TDAA in the Mackenzie River plume were more variable
across the salinity gradient, with elevated concentrations and yields of TDAA at mid
plumes at lower latitudes (e.g., the Mississippi River plume; Dagg et al. 2004), primary
production, production of bioavailable DOM, and microbial processes in the Mackenzie
River plume are relatively low (Retamal et al. 2007; Emmerton et al. 2008; Retamal et al.
2008).
Relatively high concentrations of DOC were observed in regions of the Beaufort
shelf and reflected the influence of the Mackenzie River. Riverine input of nutrients
supported patches of elevated primary production (Raimbault et al. unpublished data) and
elevated concentrations and yields of TDAA in shelf waters, but generally low nutrient
concentrations together with stratification of shelf waters during the summer typically
resulted in the formation of a chlorophyll and productivity maximum at ~30 m (Carmack
et al. 2004; Lavoie et al. 2009; Raimbault et al. unpublished data). This pattern is
reflected in elevated concentrations and yields of TDAA in subsurface waters. Bacterial
production was strongly correlated with TDAA concentrations in the Beaufort Sea
(Ortega-Retuerta et al. 2012), demonstrating amino acids are reliable indicators of
bioavailable DOM. DOC and TDAA concentrations and yields of TDAA decreased
rapidly (by 9%, 31%, and 27%, respectively) from shelf to slope-basin surface waters, as
conditions became more oligotrophic due to the extensive sea ice cover in the summer of
2009. The low levels of primary production were reflected in low concentrations (200
nmol L-1) and yields (0.85 %DOC) of TDAA during this study. Concentrations of DOC
and TDAA were lowest in upper halocline waters, and the off-shelf subsidy of
bioavailable DOM was not apparent. Yields of TDAA in the upper halocline (0.78
%DOC) were comparable to values in refractory DOM (0.70 %DOC), indicating DOM in
Heterogeneous distributions of bioavailable DOM in the Beaufort Sea were
apparent from comparisons of the Amundsen Gulf (CFL 2008) and the southeastern
Beaufort Sea (MAL 2009). Concentrations (p < 0.05) and yields (p < 0.001) of TDAA
were significantly higher in the Amundsen Gulf than in the southeastern Beaufort Sea,
but there was no significant difference (p = 0.4294) in DOC concentrations between the
two regions. These higher TDAA concentrations are likely attributable to higher primary
productivity (0.28 g C m-2 d-1) in the Amundsen Gulf than in the southeastern Beaufort
region (0.07 g C m-2 d-1) at the time of sampling (Raimbault et al. unpublished data)
(Sallon et al. 2011). Although the observed variability of DOM and productivity can also
be due to differences in sampling years (2008 vs. 2009), higher primary production in the
Cape Bathurst polynya (52–175 g C m-2 yr-1) than in the rest of the Beaufort Sea
(including the Mackenzie shelf) is a well recognized feature in the Amundsen Gulf
(Arrigo and Van Dijken 2004; Brugel et al. 2009; Forest et al. 2011). In addition to the
release of bioavailable DOM from plankton, bacterial degradation of particulate organic
matter and zooplankton activities provide additional sources of bioavailable DOM in the
Amundsen Gulf (Juul-Pedersen et al. 2010; Forest et al. 2011; Kellogg et al. 2011). The
elevated concentrations and yields of TDAA in the Amundsen Gulf are consistent with
the higher productivity in this region.
Interannual variability of DOM in the Beaufort Sea is difficult to address given
our limited data, but areas covering similar salinity ranges in the Mackenzie River plume
and some shelf and slope waters were sampled during CFL 2008 and MAL 2009.
Comparisons among these regions indicated higher TDAA concentrations and yields in
forcing governs biological productivity in the Beaufort Sea such that interannual
variability in DOM is not unexpected, but we anticipate less temporal variability in the
Beaufort than in the Chukchi. Previous field and remote sensing analyses indicate less
pronounced interannual variations in phytoplankton biomass and production in the
Beaufort Sea as compared with the Chukchi Sea (Arrigo and Van Dijken 2004; Brugel et
al. 2009).
It is important to explore how the contrasting productivity between the Chukchi
and Beaufort Seas influences the concentrations and bioavailability of DOM in the two
systems. Primary productivity in the Chukchi Sea (e.g., 30–720 g C m-2 yr-1; Springer and
McRoy 1993; Cota et al. 1996; Kirchman et al. 2009a) is typically much higher than that
in the Beaufort Sea (e.g., 12–28 g C m-2 yr-1; Carmack et al. 2004; Brugel et al. 2009;
Lavoie et al. 2009). Given the higher primary productivity, higher rates of DOM
production and consumption through the microbial loop are expected in the Chukchi Sea.
However, DOC concentrations in shelf and slope-basin surface waters were not
significantly different between the Chukchi and Beaufort Seas. Slightly higher
concentrations of DOC were often observed in the Beaufort Sea, apparently due to the
influence of the Mackenzie River. The difference in primary productivity between the
two regions was not reflected in the concentrations of bulk DOC.
In contrast to the similarities in DOC concentrations, TDAA concentrations in
Chukchi shelf and slope-basin surface waters were 50–90% higher (p < 0.0001) than
those in the Beaufort Sea. The bioavailability of DOM, as indicated by yields of TDAA,
was also significantly (p < 0.0001) higher (by 90%) in surface waters of the Chukchi Sea
the sampling periods ranged from 0.24 to 0.62 g C m-2 d-1 and resulted in the production
of DOM that is rich in amino acids and is of high bioavailability (Davis and Benner 2005;
Davis and Benner 2007; Kirchman et al. 2009a). In comparison, primary productivity in
nutrient-poor waters of the Beaufort Sea was low (0.03–0.45 g C m-2 d-1; Sallon et al.
2011; Raimbault et al. unpublished data) and led to lower concentrations of bioavailable
DOM. The contrasting productivity of the Chukchi and Beaufort Seas appears to be
reflected in the abundance and distribution of TDAA.
Significantly higher DOC and TDAA concentrations and yields of TDAA were
evident in the upper halocline of the Chukchi region in comparison to the Beaufort. High
concentrations and yields of TDAA were observed to depths of 200m in the Chukchi
region and appear to be derived from shelf and slope waters in the region (Davis and
Benner 2007). A variety of physical processes likely contribute to the transport of
bioavailable DOM into upper halocline waters, including the injection of dense Pacific
Winter Water and mesoscale eddies that form along the shelf break (Manley and Hunkins
1985; Mathis et al. 2007b; Spall et al. 2008). Additional sources of bioavailable DOM in
halocline waters include the direct release from plankton, grazing, viral lysis, and release
from sinking particles and sediments (Strom et al. 1997; Cooper et al. 2005; Azam and
Malfatti 2007). In contrast, these indicators of bioavailable DOM were not observed in
the upper halocline of the Beaufort Sea. Bioavailable DOM is important for sustaining
the heterotrophic community in the upper halocline (Wallace et al. 1987; Cota et al.
1996). Concentrations of bioavailable DOM in the upper halocline of the Chukchi region
Chukchi Sea in providing bioavailable DOM to low-productivity basins of the Arctic
Ocean. This strong shelf-basin interaction was not apparent in the Beaufort Sea.
The observed net accumulation of bioavailable DOM during the summer in the
Chukchi Sea and adjacent slope-basin waters indicates an uncoupling between the
biological production and utilization of DOM. The direct cause(s) of this uncoupling is
unknown, but it suggests DOM remineralization in the microbial loop is depressed.
Temperature, availability of labile substrates and nutrient concentrations play important
roles in regulating bacterial growth and the functioning of the microbial loop (Pomeroy
and Deibel 1986; Thingstad et al. 1997; Kirchman et al. 2009b; Ortega-Retuerta et al.
2012). Additions of relatively high concentrations of bioavailable substrates to water
collected from the Chukchi Sea can result in delayed responses from the microbial
community that can persist for days to weeks before utilization occurs (Davis et al. 2009).
This slow response to bioavailable substrates could also indicate deficiencies in the
metabolic diversity of the microbial community. In any case, the net accumulation of
bioavailable DOM in the Chukchi Sea and other productive shelves, such as the Barents
Sea, could be critical for sustaining heterotrophic microbial communities and microbial
19
Table 1.1 Physicochemical characteristics in shelf, slope and basin waters of the Chukchi and Beaufort Seas*
Cruise Depth
(m)
Temperature (˚C)
Salinity (psu)
DOC
(µmol L-1)
TDN
(µmol L-1)
TDAA
(nmol L-1)
TDAA
(%DOC) DI n
Shelf (0-80 m)
SBI 2002 24±11 1.29±3.26 31.17±1.41 77±12 8.0±4.5 462±177 1.70±0.66 -0.20±0.80 22
SBI 2004 26±16 4.53±3.37 31.40±0.89 83±17 7.9±4.4 406±107 1.58±0.43 -0.50±0.54 19
CFL 2008 nd nd nd nd nd nd nd nd nd
MAL 2009 19±16 1.56±2.48 29.95±1.67 85±20 6.1±1.9 289±138 1.17±0.57 0.45±0.90 18
Slope-basin (surface: 0-80 m)
SBI 2002 39±16 -1.32±0.41 31.40±1.17 76±6 10.1±5.8 319±61 1.12±0.21 -0.90±0.61 24
SBI 2004 35±17 -0.10±1.77 31.24±1.12 73±5 7.7±4.0 402±165 1.84±0.79 -1.17±1.09 44
CFL 2008 5±1 6.20±1.87 29.01±1.25 74±5 5.1±0.6 225±14 1.00±0.07 0.49±1.13 12
MAL 2009 37±26 0.09±2.17 29.69±3.51 78±25 5.8±2.0 192±47 0.80±0.14 -0.44±0.41 37
Slope-basin (upper halocline: 80-180 m, 32.0-33.9 psu)
SBI 2002 131±29 -1.53±0.17 33.22±0.41 69±3 18.6±2.1 243±41 0.92±0.17 -1.58±0.42 23
SBI 2004 129±23 -1.50±0.15 33.09±0.35 70±5 17.2±1.4 344±119 1.64±0.66 -1.35±1.43 20
CFL 2008 112±30 -1.39±0.12 33.20±0.33 66±4 16.9±2.8 177±19 0.84±0.06 1.08±1.15 9
MAL 2009 136±26 -1.38±0.06 32.93±0.39 64±3 16.2±1.6 150±18 0.75±0.11 -0.63±0.46 13
Table 1.2 Statistical comparisons of the concentrations of DOC and TDAA, and TDAA
yields in the Chukchi and Beaufort Seas (Mann-Whitney U test).
Chukchi Sea DOC
(µmol L-1)
TDAA
(nmol L-1)
TDAA (%DOC)
Shelf vs. Slope-basin surface p = 0.1408 p < 0.01 p = 0.3678
Shelf vs. Slope-basin upper halocline p < 0.001 p < 0.0001 p < 0.01
Slope-basin (surface vs. upper halocline) p < 0.0001 p < 0.01 p < 0.05
Beaufort Sea
Shelf vs. Slope-basin surface p < 0.01 p < 0.0001 p < 0.001
Shelf vs. Slope-basin upper halocline p < 0.0001 p < 0.0001 p < 0.0001
Table 1.3 Comparisons of the concentrations of DOC and TDAA, and TDAA yields in
the Chukchi and Beaufort Seas* (Mann-Whitney U test).
DOC (µmol L-1) TDAA (nmol L-1) TDAA (%DOC)
Chukchi Beaufort Chukchi Beaufort Chukchi Beaufort
Shelf 80±15 85±20 428±140 289±138 1.62±0.53 1.17±0.57
(p = 0.4338) (p < 0.0001) (p < 0.0001)
Slope-basin (surface)
74±5 77±22 378±147 200±44 1.63±0.74 0.85±0.15
(p = 0.0570) (p < 0.0001) (p < 0.0001)
Slope-basin (upper halocline)
70±4 65±4 307±109 161±22 1.38±0.64 0.78±0.10
(p < 0.0001) (p < 0.0001) (p < 0.0001)
*SBI 2002 and 2004 were combined to represent the Chukchi Sea region, whereas CFL
2008 and MAL 2009 were combined to represent the Beaufort Sea region. Data are
Figure 1.2 Mixing patterns of DOM in the Mackenzie River plume. Distributions of (a) dissolved organic carbon (DOC), (b) total dissolved amino acids (TDAA), and (c) yields of TDAA (%DOC) across the salinity gradient.
500 400 300 200 100 D O C ( µ m o l L -1 ) MAL-west MAL-east CFL-east
y = -11.70x + 459.45 R2= 0.9260, p < 0.001
Figure 1.3 Concentrations of dissolved organic carbon (DOC) in (a) shelf, (b) slope, and (c) basin waters of the Chukchi Sea (SBI 2002, SBI 2004) and Beaufort Sea (CFL 2008, MAL 2009). 90 80 70 60 50
DOC (µmol L-1)
(c) Basin 500 400 300 200 100 0 200 160 120 80 40
DOC (µmol L-1)
80 60 40 20 0 D ep th ( m ) 150 125 100 75 50
DOC (µmol L-1)
(a) Shelf 200
1 5 0 1 0 0 5 0 0 90 80 70 60 50 (b) Slope
Figure 1.4 Concentrations of total dissolved amino acids (TDAA) in (a) shelf, (b) slope, and (c) basin waters of the Chukchi Sea (SBI 2002, SBI 2004) and Beaufort Sea (CFL 2008, MAL 2009).
800 600 400 200
TDAA (nmol L-1)
(c) Basin 500 400 300 200 100 0 1000 800 600 400 200
TDAA (nmol L-1)
80 60 40 20 0 D ep th ( m ) 1000 800 600 400 200
TDAA (nmol L-1)
(a) Shelf 200
1 5 0 1 0 0 5 0 0 600 400 200 (b) Slope
Figure 1.5 DOC-normalized yields of total dissolved amino acids in (a) shelf, (b) slope, and (c) basin waters of the Chukchi Sea (SBI 2002, SBI 2004) and Beaufort Sea (CFL 2008, MAL 2009).
4.0 3.0 2.0 1.0 TDAA (%DOC) (c) Basin 500 400 300 200 100 0 4.0 3.0 2.0 1.0 TDAA (%DOC) 80 60 40 20 0 D e p th ( m ) 3.5 3.0 2.5 2.0 1.5 1.0 0.5 TDAA (%DOC)
(a) Shelf 200
1 5 0 1 0 0 5 0 0 2.0 1.6 1.2 0.8 (b) Slope
Figure 1.6 Spatial variability of average concentrations of (a) dissolved organic carbon (DOC) and (b) total dissolved amino acids (TDAA), and (c) yields of TDAA in shelf, slope, and basin waters of the Chukchi and Beaufort Seas. Error bars represent two times the standard error.
100 90 80 70 60 50 D O C ( µ m o l L -1 ) Shel f Sl op e-basi n (sur face ) S lope -bas in (upp er h
aloc line) Chukchi Beaufort a 2.0 1.5 1.0 0.5 0.0 T D A A ( % D O C ) Shel f Sl op e-basi n (sur face ) S lope -bas in (upp er h
aloc line) c 500 400 300 200 100 0 T D A A ( n m o l L -1 ) Shel f Sl op e-basi n (sur face ) S lope -bas in (upp er h
aloc line)
Figure 1.7 Temporal comparisons of average concentrations of (a) dissolved organic carbon (DOC) and (b) total dissolved amino acids (TDAA), and (c) yields of TDAA in shelf, slope, and basin waters between SBI 2002 and 2004. Error bars represent two times
the standard error. Significant (p < 0.05) and highly significant (p < 0.01) differences are
marked with one and two asterisks, respectively. 100 90 80 70 60 50 D O C ( µ m o l L -1 ) Shel f Sl op e-basi n (sur face ) S lope -bas in (upp er h
aloc line) SBI 2002 SBI 2004 a = 0 .2 8 3 2 < 0 .0 5 * = 0 . 3 0 2 8 2.5 2.0 1.5 1.0 0.5 0.0 T D A A ( % D O C ) Shel f Sl op e-basi n (sur face ) S lope -bas in (upp er h
aloc line) c = 0 .8 7 1 6 < 0 .0 0 0 1 * * < 0 .0 0 0 1 * * 600 500 400 300 200 100 0 T D A A ( n m o l L -1 ) Shel f Sl op e-basi n (sur face ) S lope -bas in (upp er h
CHAPTER
2
B
IOAVAILABLE DISSOLVED ORGANIC MATTER AND BIOLOGICAL HOT SPOTS DURING AUSTRAL WINTER INA
NTARCTIC WATERS22.1 INTRODUCTION
Ocean waters surrounding the Antarctic continent are dynamic and heterogeneous
environments characterized by pronounced spatial and temporal variability in light, ice
cover, water masses, and micronutrient conditions (Ducklow et al. 2007). Primary
production in these areas is limited to varying extents by light and iron, with high rates
occurring during the austral summer in iron-rich shelf waters (>1 g C m-2 d-1) and low or
negligible rates prevailing during the winter (Moore and Abbott 2000). Plankton activity,
including direct release from phytoplankton and release during protozoan grazing and
viral lysis, produces bioavailable dissolved organic matter (DOM) that supports the
microbial loop in which heterotrophic bacteria remineralize DOM (Pomeroy 1974; Azam
et al. 1983) and also produce refractory DOM (Ogawa et al. 2001; Lechtenfeld et al.
2015). The later process contributes to carbon sequestration and was recently
conceptualized as the “microbial carbon pump” (Jiao et al. 2010).
Previous studies of Antarctic marine ecosystems indicate a relatively small
2Shen, Y., R. Benner, A. E. Murray, C. Gimpel, B. G. Mitchell, E. L. Weiss, and C.
Reiss. 2017. Bioavailable dissolved organic matter and biological hot spots during austral
winter in Antarctic waters. J. Geophys. Res.-Oceans 122: 508–520. Copyright (2017)
fraction (<10%) of primary production is utilized by heterotrophic bacteria compared to
that in low-latitude oceans (Kirchman et al. 1995; Bird and Karl 1999; Duarte et al.
2005). The low bacterial activity in Antarctic waters has been attributed to low
temperature, high grazing pressure, and low bioavailability of DOM (Bird and Karl 1999;
Pomeroy and Wiebe 2001; Duarte et al. 2005). However, several studies have suggested a
minor effect of temperature on bacterial growth (Carlson et al. 1998; Ducklow and Yager
2007; Kirchman et al. 2009b), and also observed minor grazing on bacteria during
phytoplankton blooms (Anderson and Rivkin 2001; Ducklow and Yager 2007). Bacterial
production is often found to be significantly correlated with chlorophyll-a concentrations
and primary production, suggesting a close coupling between bacteria and phytoplankton
(Morán et al. 2001; Ortega-Retuerta et al. 2008; Murray et al. 2011; Ducklow et al. 2012;
Teira et al. 2012). Bioassay experiments and field measurements have shown rapid
bacterial responses to the supply of bioavailable DOM (Carlson et al. 1998; Obernosterer
et al. 2008; Ducklow et al. 2011). Kirchman et al. (2009b) reported a positive correlation
between bacterial growth rates and concentrations of semi-labile dissolved organic
carbon (DOC) in the Ross Sea. These observations suggest that heterotrophic bacterial
activity in Antarctic waters is strongly influenced by the bioavailability of DOM.
Previous research on DOM in the Southern Ocean has mostly focused on
measuring concentrations of organic carbon and nitrogen (Kähler et al. 1997; Wiebinga
and De Baar 1998; Ogawa et al. 1999; Carlson et al. 2000; Doval et al. 2002; Clarke et al.
2008), and few studies have addressed the composition and bioavailability of DOM
(Kähler et al. 1997; Carlson et al. 2000; Rosenstock et al. 2005; Tremblay et al. 2015).
little is known about microbial processes in the austral winter. DOM is generally
considered to be of limited bioavailability during the winter (Scott et al. 2000; Pearce et
al. 2007). However, active bacterial growth and production have been observed in
various dimly lit regions (55˚S–65˚S) during winter periods (Hanson et al. 1983;
Kottmeier and Sullivan 1987; Mordy et al. 1995; Manganelli et al. 2009). This suggests
the sporadic occurrence of bioavailable DOM, likely derived from production by
phytoplankton, ice algae, and chemoautotrophs (Kottmeier and Sullivan 1987; Cota et al.
1992; Manganelli et al. 2009). Patches of bioavailable DOM form hot spots that can
enhance biogeochemical processes relative to surrounding areas (Mcclain et al. 2003;
Azam and Malfatti 2007; Shen et al. 2016a; Shen et al. 2016b). The presence of reactive
DOM is not readily reflected in DOC concentrations but is detectable in the chemical
composition and bioavailability of DOM (Kirchman et al. 2001; Davis and Benner 2005;
Shen et al. 2012a).
The bioavailability of DOM is commonly determined using bioassay incubations
that measure biological consumption of DOM over time periods of weeks to months
(Søndergaard and Middelboe 1995; Lønborg et al. 2009). This approach provides insights
about the rates of DOM utilization as well as its relative bioavailability, but it is
impractical for large-scale oceanographic surveys of bioavailable DOM. An alternative
approach is based on the chemical analysis of specific molecular indicators of
bioavailable DOM that have been identified using bioassay incubations (Amon et al.
2001; Benner 2003; Davis et al. 2009; Goldberg et al. 2010). Molecular indicators of
bioavailable DOM can be directly measured in seawater and can provide insights about
acids have been used as qualitative and quantitative indicators of bioavailable DOM over
broad spatial and temporal scales in various aquatic systems (Davis and Benner 2007;
Shen et al. 2015; Shen et al. 2016b). Certain amino acids, such as glycine and nonprotein
amino acids (β-alanine and γ-aminobutyric acid), increase in relative abundance during
DOM degradation, thereby providing additional insights into the extent of DOM
alteration (Kaiser and Benner 2009; Shen et al. 2015). Furthermore, D-enantiomers of
amino acids are derived from bacteria and are useful biomarkers for tracing the bacterial
origin of DOM in the ocean (Mccarthy et al. 1998; Kaiser and Benner 2008).
The objective of this study is to investigate the concentration, chemical
composition, and bioavailability of DOM during winter in Antarctic waters and to
understand how these features vary with ecosystem productivity and hydrography.
Distributions of chlorophyll-a, particulate organic carbon (POC), DOC, and amino acids
are examined in different water masses in sea ice-free and ice-covered regions around the
South Shetland Islands off the northwestern Antarctic Peninsula during August 2012.
Various biochemical indicators are applied to identify specific locations (referred to as
biological hot spots) exhibiting elevated concentrations of bioavailable DOM relative to
surrounding waters. The western Antarctic Peninsula is among the fastest warming
regions on the planet and the most pronounced warming occurs during austral winter,
with the mean surface air temperature having risen 5–6˚C since 1950 (Vaughan et al.
2003; Ducklow et al. 2007). Such dramatic winter warming has reduced extent and
duration of sea ice, altered phytoplankton communities and production, and affected
ecosystem food web (Ducklow et al. 2007; Montes-Hugo et al. 2009), highlighting the
2.2 METHODS
Sampling was conducted as part of the Antarctic Marine Living Resources
(AMLR) Program aboard the RVIB Nathaniel B. Palmer off the Antarctic Peninsula and
South Shetland Islands (SSI) during August 2012 (Figure 2.1). The sampling areas are
characterized by the confluence of different water masses originating from the Antarctic
Circumpolar Current, Bellingshausen Sea, and Weddell Sea. A total of 110 seawater
samples were collected from discrete depths (5, 10, 15, 50, 75, 100, 200, 750 m) at 25
stations within the historic AMLR research area, extending from the southern Drake
Passage to the Bransfield Strait (Figure 2.1). A rosette sampler system with 24, 12 L
bottles and a Seabird Conductivity-Temperature-Depth (CTD) instrument was used for
water collections. Water samples for chlorophyll-a (chl-a) were filtered (GF/F; 0.7 mm
pore size; Whatman) immediately following collection. Samples for POC measurements
were collected mostly at 5 and 200 m, filtered (GF/F; Whatman; precombusted at 450˚C
for 5 h), and stored frozen until analysis. Water samples for analyses of DOC and amino
acids were stored frozen (280˚C) in 60 mL high-density polyethylene screw-cap bottles
immediately after collection. Hydrographic data were obtained from the CTD sensors and
were used to determine the depth of upper mixed layer and to identify water masses
(Table 2.1).
The filters for chl-a determinations were extracted in 7 mL of methanol for 24 h,
centrifuged, and measured for fluorescence using an acidification module in a Turner
Trilogy fluorometer. Readings were calibrated with a 5-point calibration curve using a
chl-a standard obtained from Sigma, the concentration of which was determined using a
with 10% v/v hydrochloric acid (HCl), dried at 60˚C, and analyzed using an Exeter
Analytical CEC 440HA elemental analyzer.
Water samples for DOC and amino acid measurements were filtered through 0.2
mm pore size membranes (SuporVR -200, Life Sciences). The Supor membranes were
cleaned with methanol and then rinsed thoroughly with Milli-Q UV-Plus water before
use. The DOC samples were acidified to pH 2–3 with 2 mol L-1 HCl. Concentrations of
DOC were determined by high-temperature combustion using a Shimadzu total organic
carbon TOC-V analyzer equipped with an autosampler. Milli-Q UV-Plus water and
seawater reference standards were injected every sixth sample (Benner and Strom 1993).
Blanks (Milli-Q water) were negligible and the measured concentrations of reference
standards were within the reported range (41–44 µmol L-1). The coefficient of variation
among four injections of a given DOC sample was typically ±1.1%.
The D-enantiomer and L-enantiomer of amino acids were analyzed using an
Agilent 1260 ultrahigh performance liquid chromatography (UPLC) system equipped
with a fluorescence detector (excitation: 330 nm; emission: 450 nm) (Shen et al. 2015).
Amino acids were determined in all samples that were filtered through Supor membranes
(0.2 µm pore-size) and in a subset of unfiltered samples as total dissolved amino acids
(TDAA) and total particulate amino acids (TPAA), respectively. Hydrolysis and
derivatization followed the procedures described by Kaiser and Benner (2005). Briefly,
water samples (100 mL) were dried and hydrolyzed using a vapor-phase technique with 6
mol L-1 HCl at 150˚C for 32.5 min. Amino acid enantiomers were derivatized with o
-phthaldialdehyde and N-isobutyryl-L-cysteine and were separated on a Poroshell 120
with 100% potassium di-hydrogen phosphate (KH2PO4; 48 mmol L-1, pH = 6.25) to 61%
KH2PO4 and 39% methanol:acetonitrile (13:1, v/v) at 13.3 min, 46% KH2PO4 at 19.2
min, 40% KH2PO4 at 21.3 min, and 20% KH2PO4 at 22 min. Eighteen amino acids were
included in the analysis: asparagine + aspartic acid (Asx), glutamine + glutamic acid
(Glx), serine (Ser), histidine (His), glycine (Gly), threonine (Thr), β-alanine (β-Ala),
arginine (Arg), alanine (Ala), γ-aminobutyric acid (γ-Aba), tyrosine (Tyr), valine (Val),
phenylalanine (Phe), isoleucine (Ile), leucine (Leu), and lysine (Lys). Acid-catalyzed
racemization was corrected according to Kaiser and Benner (2005). This method has a
limit of quantification of 0.5 nmol L-1 for individual amino acids. D-enantiomers of Asx,
Glx, Ser, and Ala are reported in this study.
Concentrations of TDAA and TPAA were determined as the total concentrations
of the eighteen dissolved and particulate amino acids, respectively. DOC-normalized
yields of TDAA were calculated as the percentage contributions of amino acid carbon to
the total DOC, using equation (1) and being reported in units of %DOC:
(1)
, where [DOC] and [TDAA-C] are the concentrations of bulk DOC and carbon measured
in the total dissolved amino acids, respectively. This calculation excluded the two
nonprotein amino acids (β-Ala and γ-Aba) that are thought to be byproducts of
decomposition (Cowie and Hedges 1994).
The significance of least squares linear regression analyses between variables was
determined using the enter approach in SPSS 20.0 (IBM Statistical Package for the Social
Sciences Inc.). Normality of residuals was tested using a Kolmogorov-Smirnov test
(two-α
TDAA(%DOC)=[TDAA-C]
nonparametric Mann-Whitney U test (two-tailed, α = 0.05), which makes no assumptions
of equal group size and normality of data distribution.
2.3 RESULTS
Areas around the South Shetland Islands (SSI) are influenced by various water
masses during austral winter, including Winter Water (WW), Transitional Bellingshausen
Water (TBW), Circumpolar Deep Water (CDW), and Transitional Weddell Water
(TWW). These water masses were identified at the sampling stations (5–750 m; Table
2.1; Figure 2.2a) according to their temperature and salinity characteristics as described
in previous studies (Sangrà et al. 2011; Teira et al. 2012). Cold (21.9 to 20.5˚C) and less
saline (33.5–34.3) WW was located in the upper 100 m within the surface mixed layer
(Figure 2.2b). Below the WW intrusions of relatively warm and dense waters from
adjacent seas resulted in elevated temperatures and salinities that were characteristic of
different water masses in the mesopelagic zone (200–750 m) in the region of the SSI
(Figure 2.2b). In the Drake Passage, the Antarctic Circumpolar Current brought warm (0–
2˚C) and salty (34.4–34.7) CDW that dominated the mesopelagic waters north of the SSI
(60.0–60.25˚S). By contrast, areas south of the SSI (SSI shelf and the Bransfield Strait;
60.5–62.5˚S) were influenced by inflows from the TBW and Weddell Sea (Figure 2.1).
The TBW was not well sampled in this study (n = 3) and is therefore not further
discussed. The relatively cold (21.8 to 20.5˚C) and saline (34.3–34.6) TWW entered
Bransfield Strait from the Weddell Sea and was a major component of mesopelagic
The sampling areas encompassed both sea ice-free and sea ice-covered waters
(Figure 2.1 and Table 2.1). Surface waters in the north of the SSI were largely ice-free,
whereas waters south of the SSI were mostly ice-covered. Sea ice affects light reflection
and penetration in the water column, and the varying sea ice extent could strongly affect
the spatial variability in primary production during this low-light season.
Concentrations of chl-a and POC in the surface WW were quite variable and
decreased significantly toward the south from 0.22 to 0.01 µg L-1 (r2 = 0.53, p < 0.01)
and from 3.2 to 0.8 µmol L-1 (r2 = 0.29, p < 0.01), respectively (Figure 2.3a,c; Table 2.2).
In comparison, concentrations of chl-a and POC in the CDW and TWW were
significantly lower (Mann-Whitney U test, p < 0.01), with most values below 0.04 µg L-1
and 2 µmol L-1 (Figure 2.3b,d; Table 2.2). No significant difference was observed in
concentrations of chl-a (Mann-Whitney U test, p > 0.05) and POC (Mann-Whitney U
test, p > 0.5) between the CDW and TWW.
Concentrations of DOC around the SSI ranged from 35 to 58 µmol L-1 (average:
42±4 µmol L-1) and showed no latitudinal gradients in the surface waters (r2 = 0.00, p >
0.5) or vertical gradients between surface and mesopelagic layers (Mann-Whitney U test,
p > 0.1) (Figure 2.4a,b; Table 2.2). In comparison, concentrations and DOC-normalized
yields of TDAA were more variable, ranging 3-fold from 84 to 257 nmol L-1 and from
0.6% to 1.7% in the surface WW and 2-fold from 83 to 144 nmol L-1 and from 0.5% to
1.1% in the mesopelagic waters, respectively (Figure 2.4c–f; Table 2.2). Concentrations
and yields of TDAA in the surface WW displayed weak but significant latitudinal trends
(r2 = 0.11–0.13, p < 0.05), while in the mesopelagic waters these values exhibited