Supported by the Ministry of Education, Youth and Sports of the Czech Republic (Project No. MSM 6215712403).
Effect of supplementation of various selenium forms
and doses on selected parameters of ruminal fluid
and blood in sheep
A. Panev, K. Hauptmanová, L. Pavlata, A. Pechová, J. Filípek, R. Dvořák
Ruminant and Swine Clinic, Faculty of Veterinary Medicine, University of Veterinary and Pharmaceutical Sciences Brno, Brno, Czech Republic
ABSTRACT: Effect of various doses and forms of selenium (organically bound vs. inorganic) on selected parameters of ruminal fluid and blood in sheep was evaluated. The trial was performed with 15 sheep divided into two groups. Animals from group A (n = 8) received a feeding mixture with selenomethionine, while sheep from group B (n = 7) were fed a mixture with sodium selenite. During the first 14 days, animals from both groups were fed a mixture with optimum dose of selenium (1 mg Se/kg dry matter). For another 28 days, all experimental animals received a Se-deficient mixture (0.1 mg Se/kg dry matter), whereas in the last 21 days of the experiment, animals were fed a high-Se diet (5.0 mg Se/kg dry matter). Throughout the trial, 4 samples of blood and ruminal fluid were taken from each animal. The samples of ruminal fluid were analyzed to deter-mine the concentration of Se and identify other parameters of ruminal fermentations. Selenium levels were also determined in ruminal biomass. In blood, Se concentration, glutathione peroxidase (GSH-Px) activity, and other selected biochemical parameters were measured. The results of the present study demonstrate that the actual intake of both organic and inorganic Se is reflected in Se concentration in ruminal fluid and ruminal biomass and, similarly, in Se content and GSH-Px activity in blood. The form of supplemented selenium did not have a significant effect on ruminal fermentation parameters in dependence on different doses of Se contained in feeding rations (except for the negative effect of a sudden start of feeding high levels of organically bound Se on infusoria count, which was accompanied by the increase of GMT, LDH, and AST enzymes activity in ruminal fluid). The results also suggest possible negative interaction between the intake of organically bound selenium and the concentration of copper in blood of sheep.
Keywords: selenomethionine; organic selenium; inorganic selenium; copper; glutathione peroxidase; zinc; interactions
The importance of a sufficient supply of mi-croelements is based on the fact that they take part in many biological processes and have many structural, catalytic, and regulatory functions in the organism. As such, they influence the organ-ism’s health state (Underwood and Suttle, 1999). Microelement supply in ruminants is significantly affected by the place where they are reared, as they are routinely fed on plant feedstuffs pro-duced locally. Feed grains usually contain higher concentrations of microelements than forage. The form of supplementation of microelements
Selenium, together with vitamin E, participates in antioxidant protection of the organism, as it is con-tained in glutathione peroxidase enzyme (GSH-Px). Selenium also plays an important role in the immune system and the metabolism of thyroid hormones. It is also crucial for reproduction (McKenzie et al., 1998; Ruz et al., 1999; Birringer et al., 2002).
Since the Czech Republic is situated in the area with insufficient content of Se in soil, there is no risk of selenium intoxication here. On the con-trary, animals living in this region are rather sus-ceptible to Se-deficiency diseases (Pavlata et al., 2002, 2005a; Ludvíková et al., 2005). In order to ensure adequate supply of Se, the animals must be supplemented with this element in an appropri-ate form. It should be noted that Se added in the feeding ration is not fully utilized by the animal’s organism, as its significant part is absorbed and metabolized by ruminal bacteria (Serra et al., 1994).
Sodium selenite and sodium selenate admin-istered at optimum dose show similar bioavail-ability. Also, they are distributed in rumen in a similar way and at a similar rate. Selenium is very quickly embedded in bacteria – in fact, 30% of Se is present in bacteria 1 h after the adminis-tration (Serra et al., 1994). It has been reported that supplementation of sodium selenite together with vitamin E affects ruminal activity in terms of increased production of fatty acids and growing number of protozoa. At the same time, average daily gain increases (Naziroglu et al., 1997). On the other hand, certain authors did not observe any significant changes after in vitro application of selenium (Kim et al., 1997; Feasenhiser, 2005). Mihaliková et al. (2005) reported that selenome-thionine has protective effect on the growth of some protozoa species. It has been also published that higher Se concentrations can harm ruminal microflora or even ruminal mucosa. Ruminal bac-teria and mucosa in the rumen contain enzymes whose concentration in ruminal fluid increases
after the cells are damaged. Monitoring of activity of selected enzymes in ruminal fluid can therefore provide information about possible toxic action of microelements in the rumen (Weekes, 1972; Cheng et al., 1976).
The present study evaluates the effect of the dose and form of supplemented selenium on selected parameters of ruminal fluid and blood in sheep. The aim is to find out whether the bioavailability of organic Se compounds is higher as compared with inorganic compounds and whether higher concentration of Se in one or other form affects ruminal environment, metabolic function of ru-men, or metabolism of other microelements.
MATERIAL AND METHODS
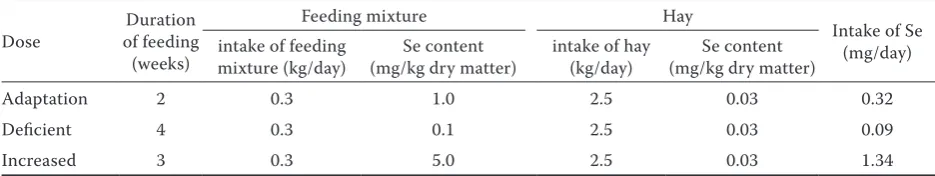
[image:2.595.63.531.668.756.2]The experiment was performed with 15 wethers which had been fed and housed in the same way for 4 months before the trial. The animals were divided in two groups (A and B) and housed in two independent open-air pens with ad libitum access to water. During the trial, all animals were fed the same feeding ration. The only exception was the form and concentrations of selenium added in the supplementary feed mixture (manufactured by Bio-kron s.r.o., Blučina, Czech Republic). Daily feeding ration of one animal included 2.5 kg meadow hay and 0.3 kg supplementary grain feeding mixture containing additional selenium. The ration was divided into two meals (one fed in the morning, the other in the evening – see Tables 1 and 2). Animals from group A (n = 8) received feeding mixture containing organic selenium (Sel-Plex 2000; Alltech, Nicholasville, USA). Wethers from group B (n = 7) were fed a mixture enriched with inorganic Se (sodium selenite, Na2SeO3). From day 1 to day 14, the animals received 1.0 mg of Se per 1 kg feeding mixture. In the second stage of the experiment (days 15–42), only a small amount
Table 1. Intake of selenium in feeding ration and hay per animal and day throughout the experiment (daily ration divided to two meals)
Dose of feeding Duration (weeks)
Feeding mixture Hay
Intake of Se (mg/day) intake of feeding
mixture (kg/day) (mg/kg dry matter)Se content intake of hay (kg/day) (mg/kg dry matter)Se content
Adaptation 2 0.3 1.0 2.5 0.03 0.32
Deficient 4 0.3 0.1 2.5 0.03 0.09
of Se was administered (0.1 mg/kg), whereas in the last three weeks (days 43–63), the wethers received high dose of selenium (5.0 mg/kg) in the supplementary grain feeding mixture (Table 1).
Throughout the trial, four samples of blood and ruminal fluid were taken from each animal. Ruminal fluid (300 ml) was collected by a rumi-nal probe and a suction pump 2 h after morning feeding. At the same time, blood was taken from
vena jugularis to two test tubes, one without an-ticoagulant to obtain serum sample, the other with heparin to obtain whole blood sample. The first sampling was done after 14 days of feeding the mixture containing 1 mg/kg Se (day 14), the second sample was taken after three weeks of feed-ing low dose of Se (day 35), the third sample was collected after the first feeding the mixture with higher concentration of Se (day 43), and the last sampling was performed after 3 weeks of feeding a diet high in Se (day 63).
The following parameters of ruminal fluid were examined: pH, total acidity, infusoria count, lactic acid concentration, ammonia, volatile fatty acids, percentage of individual acids (acetic, propionic,
n-butyric, and n-valeric), Se concentration, and ALP, ALT, AST, GMT, LDH, and amylase activ-ity. Concentration of Se in ruminal biomass was determined as well. The rumen fluid samples were preserved by toluene for determining volatile fatty acids, by formaldehyde for determining ciliate protozoa, and by mercuric chloride for deter-mining the other indicators (pH, total acidity, and ammonium). Total acidity was established by titration method. The pH level was measured
by the pH Meter Lab 850 (SCHOTT Instruments GmbH, Mainz, Germany). Lactic acid was meas-ured with the use of enzymes (Noll, 1988) and with the Quantum (STANGEST, Valls, Spain) and l-, d-lactate dehydrogenase test kits (Megazyme International Ireland Ltd., Wicklow, Ireland). Am-monia was determined by the modified Berthelot reaction according to Chaney and Marbach (1962). Volatile fatty acids (VFA) were determined by gas chromatography (Agilent 6820 Gas Chromatograph System; Agillent Technologies, Santa Clara, USA). The ruminal enzymes were analyzed with the use of AMS Liasys Clinical Chemistry System (AMS Diagnostics, Summerville, USA), the individual enzymes were analyzed using individual test kits produced by Lachema (Brno, Czech Republic): LDH (L LDH cat. No.12352), ALP (L ALP cat. No. 10061), AST (L AST cat. No.10351), ALT (L ALT cat. No. 10451). Individual test kits (BioVendor – Laboratorní medicína a.s., Brno, Czech Re-public) were as follows: GMT (GMT KIN 100 cat. No. 1003208) and amylase (AMS L 100 cat. No. 10003302). Infusoria count was done with the use of a microscope in a Fuchs-Rosenthal Count-ing Chamber (Hausser Scientific Co., Horsham, USA) by dilution 1 : 20 and staining with 0.1% methylen blue. Conservation was done by the use of 10% formaldehyde solution.
[image:3.595.63.290.113.302.2]The ruminal biomass separation was done accord-ing to the Czerkawski method (Czerkawski, 1976) which was slightly modified. The method begins with filtering of the ruminal fluid through several layers of cotton gauze. After this the filtrated fluid is passed through a 0.315 mm sieve. Centrifugation by 15 000 rpm for 15 min is the following step. The formed sediment is diluted with 0.9% NaCl and centrifuged again. The created sediment is first dried with heat and later it is placed in an exsiccator with silica gel. The biomass prepared in this manner was analyzed in the university’s laboratory. The following blood parameters were analyzed: concentrations of total protein, albumin, bilirubin, urea, and selenium and activity of AST, GMT, and GSH-Px. The glutathione peroxidase activity was assessed in whole heparinized blood according to the method described by Paglia and Valentine (1967) with the use of the Ransel set (Randox Laboratories Ltd., Crumlin, UK) and Roche Cobas Mira Automated Chemistry Ana-lyzer (Roche, Basel, Switzerland). Zinc and copper concentration in blood plasma were determined by flame atomic absorption spectrophotometry
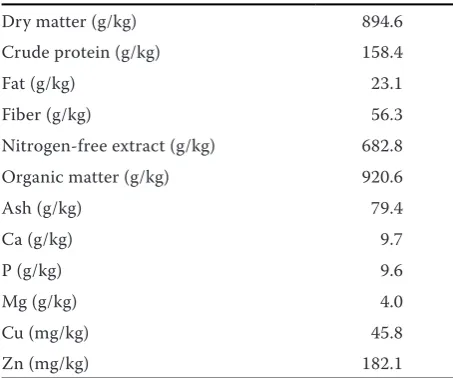
Table 2. Nutritional composition of supplementary feed-ing mixture
Dry matter (g/kg) 894.6 Crude protein (g/kg) 158.4
Fat (g/kg) 23.1
Fiber (g/kg) 56.3
Nitrogen-free extract (g/kg) 682.8 Organic matter (g/kg) 920.6
Ash (g/kg) 79.4
Ca (g/kg) 9.7
P (g/kg) 9.6
Mg (g/kg) 4.0
Cu (mg/kg) 45.8
using Solaar M6 (Unicam, Leeds, UK) follow-ing the previous deproteination of the sample by adding trichloracetic acid in the 1 : 1 ratio. The minerals were determined in the supernatant af-ter centrifugation. The catalytic activity of the GMT, AST and the concentration of TP, albumin, and bilirubin were determined with Cobas Mira Automated Chemistry Analyzer by standardized photometric methods using the tests supplied by Lachema, BioVendor – Laboratorní medicína a.s. (Total protein cat. No. 12751), Human (Wiesbaden, Germany) (ALBUMIN liquicolor cat. No. 10560), and JK – Trading s.r.o. (Prague, Czech Republic) (Total bilirubin cat. No. 10007762).
Concentrations of Se in all the examined bio-logical samples were determined by the hydride method of atomic absorption spectrophotometry after mineralization of the samples by microwave digestion technique (Pechová et al., 2005).
Statistical analysis of data in MS Excel 2007 was done using F test for the assessment of the vari-ance of individual samples and Student’s t-test for samples with equality/non-equality of variance to compare group A and B results. Dynamics of changes of individual parameters in each group was assessed by paired t-test. The parameters were also subjected to correlation analysis that tested mutual relations of all results obtained throughout the experiment as well as the results of groups A and B independently.
RESULTS AND DISCUSSION
Rumen parameters
Selenium concentrations measured in ruminal fluid and ruminal biomass are stated in Table 3. The results indicate that the vast majority of Se is contained in biomass. Dynamics of absolute Se concentrations in ruminal fluid and biomass roughly correspond with the amount of supple-mented selenium: Se concentrations in fluid and biomass were demonstrably lower at the second sampling. However, they significantly increased right after increased dose of Se started to be fed and they remained high until the end of the trial. The form of supplemented selenium did not have significant effect on the absolute content of Se in ruminal biomass. The present results are in accordance with the previously published find-ing that due to rapid absorption of Se by ruminal
bacteria, the highest selenium levels are found in ruminal biomass, whereas the lowest in ruminal fluid (Serra et al., 1994). Higher concentration of Se in ruminal fluid was observed after the supple-mentation of sodium selenite. After feeding the mixture with higher content of Se, the concentra-tion of selenium in ruminal fluid of animals fed sodium selenite almost doubled (4.61 ± 1.72 µg/l – 3rd sampling, 9.68 ± 5.24 µg/l – 4th sampling)
as compared with wethers fed organic selenium (2.60 ± 1.33 µg/l – 3rd sampling, 4.88 ± 2.16 µg/l –
4th sampling). The difference between the groups
was statistically significant (P < 0.05). Comparison of Se concentration in ruminal biomass and ruminal fluid indicated that biomass and fluid concentrations were highly significantly correlated (r = 0.78, P < 0.001, n = 60). This proves that selenium concentra-tions in ruminal fluid and ruminal biomass are to a certain degree balanced. Despite the differences in Se content determined in ruminal fluid, it can be said that supplementation of different forms of selenium does not significantly affect the distribu-tion of Se among ruminal fluid and ruminal biomass – particularly when absolute Se concentrations in biomass are taken into account. However, the calculated ratio of Se bound in ruminal biomass vs. ruminal fluid indicates a tendency of Se to bind with ruminal biomass of animals that received organic selenium. Not counting the results obtained at the end of feeding Se-deficient mixture (day 35), aver-age biomass concentrations in organic selenium group were 613, 416, and 487 times higher than fluid concentrations (samplings on days 14, 43, and 63), whereas in animals fed inorganic selenium, biomass concentrations were only 421, 258, and 194 times higher than fluid concentrations. This tendency corresponds with the results reported by Mainville et al. (2009) who observed that inorganic selenium has a lower ruminal microbial uptake than organic selenium sources.
acid 18.4 ± 1.5%, butyric acid 10.6 ± 1.2%, valeric acid 2.0 ± 0.6%, ammonia 7.62 ± 4.03 mmol/l, and infusoria count 194 000 ± 97 000/ml. The effect of supplementation of organic selenium (seleno-methionine) on concentrations of volatile fatty acids was not seen by Feasenhiser (2005) either. On the contrary, Kim et al. (1997), who studied the effect of selenium on ruminal fermentation
in vitro, found out that addition of selenomethio-nine (2 mg/kg) in the ruminal fluid resulted in higher production of certain volatile fatty acids as compared with addition of elementary selenium or sodium selenite, or no selenium supplementa-tion. Differences in production of volatile fatty
acids after supplementation of sodium selenite and vitamin E were observed also by Naziroglu et al. (1997): pre-feeding concentration of VFA in experimental group was lower than in control group, whereas their concentration 6 h post feed-ing was higher than in control group. Dutt and Chhabra (2008) report that supplementation of 0.5 ppm Se either in inorganic or organic form did not show any significant effect on nutrient intake, rumen microbial population, and protein synthesis in cattle and buffaloes.
[image:5.595.62.533.130.271.2]The results of the present study however indi-cate possible negative effect of high doses of Se on ruminal fermentation. This was seen after the
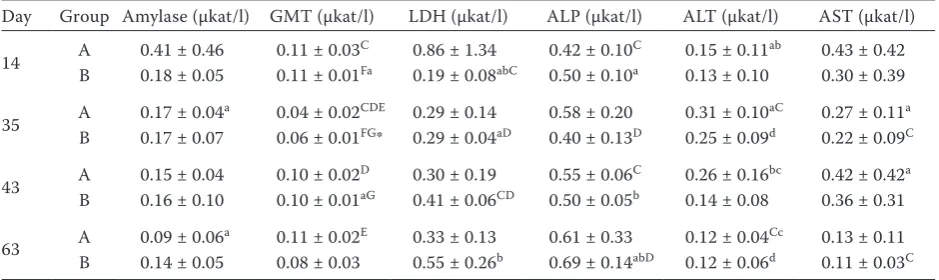
Table 4. Activity of selected enzymes in ruminal fluid of sheep during feeding optimum dose of Se (day 14), deficient dose of Se (day 35), 2 h after the first feeding of high-selenium diet (day 43), and during feeding increased dose of Se (day 63)
Day Group Amylase (µkat/l) GMT (µkat/l) LDH (µkat/l) ALP (µkat/l) ALT (µkat/l) AST (µkat/l)
14 A 0.41 ± 0.46 0.11 ± 0.03C 0.86 ± 1.34 0.42 ± 0.10C 0.15 ± 0.11ab 0.43 ± 0.42 B 0.18 ± 0.05 0.11 ± 0.01Fa 0.19 ± 0.08abC 0.50 ± 0.10a 0.13 ± 0.10 0.30 ± 0.39
35 AB 0.17 ± 0.040.17 ± 0.07a 0.04 ± 0.020.06 ± 0.01CDEFG* 0.29 ± 0.140.29 ± 0.04aD 0.58 ± 0.200.40 ± 0.13D 0.25 ± 0.090.31 ± 0.10aCd 0.27 ± 0.110.22 ± 0.09aC
43 AB 0.15 ± 0.040.16 ± 0.10 0.10 ± 0.020.10 ± 0.01DaG 0.30 ± 0.190.41 ± 0.06CD 0.50 ± 0.050.55 ± 0.06bC 0.14 ± 0.080.26 ± 0.16bc 0.36 ± 0.310.42 ± 0.42a
63 A 0.09 ± 0.06a 0.11 ± 0.02E 0.33 ± 0.13 0.61 ± 0.33 0.12 ± 0.04Cc 0.13 ± 0.11 B 0.14 ± 0.05 0.08 ± 0.03 0.55 ± 0.26b 0.69 ± 0.14abD 0.12 ± 0.06d 0.11 ± 0.03C
A = sheep fed organic selenium (n = 8), B = sheep receiving inorganic selenium (n = 7)
C:C to G:Gin one column P < 0.01, a:a to d:din one column P < 0.05
[image:5.595.63.533.571.711.2]*P < 0.05 (significantly higher value as compared with the other group at the same sampling day)
Table 3. Concentration of Se (mean ± standard deviation) in ruminal fluid and ruminal biomass of sheep during feeding optimum dose of Se (day 14), deficient dose of Se (day 35), 2 h after the first feeding of high-selenium diet (day 43), and during feeding increased dose of Se (day 63)
Sampling day Group Selenium in biomass (µg/kg dry matter) Selenium in ruminal fluid (µg/l)
14 AB 559.7 ± 195.7 683.5 ± 189.9CDHIJ 0.91 ± 0.471.62 ± 0.89CabGHI
35 A 197.9 ± 56.2CEF 0.34 ± 0.24*DEa
B 199.7 ± 43.3HKL 0.10 ± 0.08GJK
43 AB 1083.5 ± 517.81192.4 ± 279.2EGIKM 2.60 ± 1.334.61 ± 1.72*DFbHJ
63 A 2378.9 ± 974.0DFG 4.88 ± 2.16CEF
B 1881.4 ± 586.1JLM 9.68 ± 5.24*IK
A = sheep fed organic selenium (n = 8), B = sheep receiving inorganic selenium (n = 7)
C:C to M:Min one column = P < 0.01, a:a, b:bin one column = P < 0.05
first administration of a feeding mixture rich in organic selenium. In this group (A), significantly lower (P < 0.05) infusoria count in ruminal fluid (98 000 ± 50 000 infusoria per 1 ml ruminal fluid) was observed than in group B (171 000 ± 66 000). The decrease of infusoria count in group A was statistically significant (P < 0.01) also as compared with previous sampling on day 35 when 191 000 ± 68 000 infusoria/ml ruminal fluid were determined. This decrease of infusoria count after the admin-istration of higher dose of organic selenium could be explained by toxic activity of Se induced by a sudden rise of its levels without gradual transi-tion. Nevertheless, infusoria count significantly increased (P < 0.01) to 215 000 ± 67 000/ml after three weeks, which demonstrates that continuous intake of feed high in Se does not have persistent negative effect on infusoria count. In order to as-sess potential negative effect of high doses of Se, activity of selected enzymes in ruminal fluid was monitored. The measured values are stated in Table 4. Although enzymatic activity was relatively low throughout the experiment, it is obvious that the lowest values in ruminal fluid were determined on day 35. After high doses of Se started to be fed, significant increase of GMT activity was seen in groups A and B, of LDH in group B, and of AST in group A. Significantly higher GMT and ALP activities were observed in group A also on day 63. Considering the obvious tendency of growing enzymatic activities in ruminal fluid on day 43, it
can be assumed that higher activity of enzymes could indicate possible toxic effect of high Se doses. This hypothesis is supported also by the reduction of infusoria count seen in animals from group A. Higher enzymatic activities in ruminal fluid can be associated with disintegration of microorgan-isms in ruminal ecosystem, or possible damage of ruminal cells caused by supplementation of high doses of Se (Cheng et al., 1976; Moharrery and Das, 2001). Mihaliková et al. (2005) did not see different infusoria counts in ruminal fluid of sheep that received organic or inorganic selenium as compared with control sheep.
Blood parameters
In the present study, concentration of selenium in a feeding ration affected also biochemical pa-rameters of blood (Table 5, Figures 1–3). Animals from both groups showed increased Se levels and activity of GSH-Px in blood (P < 0.01) after feeding the mixture with high concentration of selenium. Similarly, Faixová et al. (2007) observed higher Se concentration and GSH-Px activity in lambs that received increased doses of Se.
Although Se concentration and GSH-Px activity in blood did not significantly differ between the groups, the animals receiving selenite tended to show higher values of these parameters. Higher GSH-Px activity can be caused by the fact that
A EFG B EH C FI ABC GH
I
0 50 100 150 200 250
day 14 day 35 day 42 day 63
(µ
g/
l)
[image:6.595.66.286.504.638.2]Sel-Plex sodium selenite
Figure 1. Dynamics of Se concentration in blood of sheep receiving organic selenium (Sel-Plex) or inorganic sele-nium (sodium selenite). Samples were taken when feeding optimum dose of Se (day 14), deficient dose of Se (day 35), 2 h after the first feeding of high-selenium diet (day 43), and during feeding increased dose of Se (day 63)
Groups labeled by the same letters show statistically highly significant differences (P < 0.01)
A B AB
C D E CDE
0 200 400 600 800 1000 1200 1400
day 14 day 35 day 42 day 63
(µ
ka
t/
l)
Sel-Plex sodium selenite
Figure 2. Dynamics of GSH-Px activity in blood of sheep receiving organic selenium (Sel-Plex) or inorganic sele-nium (sodium selenite). Samples were taken when feeding optimum dose of Se (day 14), deficient dose of Se (day 35), 2 h after the first feeding of high-selenium diet (day 43) and during feeding increased dose of Se (day 63)
[image:6.595.308.531.504.640.2]organically bound selenium (selenomethionine) becomes embedded in proteins and thus it is less available for production of biologically active selenium compounds such as GSH-Px (Pavlata et al., 2011b). The similar effect of inorganic and organic selenium was observed also by Misurova et al. (2009) in goats. Monterrosa et al. (2011), who compared the effect of supplementation of selenium products on the digestive function of lambs, did not find any differences in selenium absorption and digestibility between animals re-ceiving sodium selenite or selenomethionine. On the contrary, Rock et al. (2001) in lambs and Davis et al. (2008) in wethers observed higher concen-trations of Se in experimental groups receiving Se-yeast (i.e. organic selenium).
In the present study, statistically highly signifi-cant correlation (r = 0.83, n = 60, P < 0.001) was found between blood Se concentration and blood GSH-Px activity. Correlation between Se concen-tration and GSH-Px activity was observed also by other authors: Pavlata et al. (2000, 2001b) in cattle, Pavlata et al. (2011a) in goats, Rock et al. (2001) in lambs, Pavlata et al. (2012b) in sheep, and Ludvíková et al. (2005) in horses. Furthermore, significant correlations (P < 0.001, n = 45) were found between Se concentration in ruminal fluid, or ruminal biomass, and blood concentration of Se (r = 0.60; r = 0.68) or blood GSH-Px activity (r
= 0.55; r = 0.58).
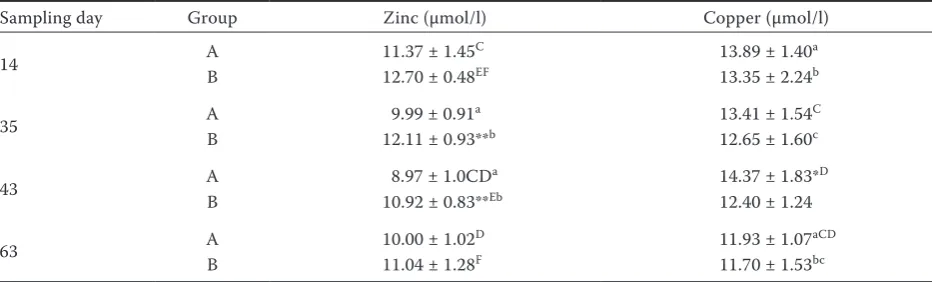
[image:7.595.64.289.82.243.2]After three weeks of feeding the increased dose of Se, concentration of copper in blood plasma dropped (Table 5) below physiological limit of 12 µmol/l (Pavlata, 2009) both in animals fed or-ganic (P < 0.01) and inorganic (P < 0.05) selenium. Moreover, organic Se group showed significant negative correlation (r = –0.64, P < 0.001, n = 32) between blood Se concentration (Figure 3), or blood GSH-Px activity and blood Cu concentra-tion (r = –0.63, P < 0.001, n = 32). No negative correlation was found in animals receiving sodium selenite. These results indicate possible negative interaction between organically bound selenium and copper. Antagonism between Cu and Se has been documented in animal studies (Hill, 1974). Some studies demonstrated that copper can inhibit selenite-induced cytotoxicity and apoptosis in HT-29 cells. Zeng and Botnen (2004) described that selenite and selenocysteine can cause cell cycle arrest via distinct mechanisms, and suggest that
Table 5. Concentration of zinc and copper in blood plasma of sheep during feeding optimum dose of Se (day 14), deficient dose of Se (day 35), 2 h after the first feeding of high-selenium diet (day 43), and during feeding increased dose of Se (day 63)
Sampling day Group Zinc (µmol/l) Copper (µmol/l)
14 A 11.37 ± 1.45C 13.89 ± 1.40a
B 12.70 ± 0.48EF 13.35 ± 2.24b
35 AB 9.99 ± 0.9112.11 ± 0.93**a b 13.41 ± 1.5412.65 ± 1.60Cc
43 AB 8.97 ± 1.0CD10.92 ± 0.83**Eba 14.37 ± 1.83*12.40 ± 1.24D
63 A 10.00 ± 1.02D 11.93 ± 1.07aCD
B 11.04 ± 1.28F 11.70 ± 1.53bc
A = sheep fed organic selenium (n = 8), B = sheep receiving inorganic selenium (n = 7)
C:C to F:Fin one column P < 0.01, a:a to c:c in one column P < 0.05
[image:7.595.64.531.569.710.2]*P < 0.05, **P < 0.01 (significantly higher value as compared with the other group at the same sampling day)
Figure 3. Relation between concentration of selenium and copper in blood of sheep receiving organic selenium (Sel-Plex) throughout the experiment, irrespective of the amount of Se added in the feeding ration (r = 0.642, n = 32)
C
u
(µ
m
ol
/l
)
19
17
15
13
11
9
-y = –0.0226x + 16.227 R2 = 0.4126
╵ ╵ ╵ ╵ ╵
Cu may interact with selenite extracellularly, which represents the basis on antagonism between copper and selenite. Wang et al. (2010) described interac-tion between selenomethionine and copper ions. The copper coordinated with selenomethionine by the formation of Cu-Se and Cu-OCO bonds or by the formation of Cu-N and Cu-OCO bonds. Sele-nium interactions with other elements rate among the factors bearing on selenium metabolism in an organism. There are descriptions of interactions of selenium and sulfur but also of selenium and cadmium, arsenic, copper, cobalt, manganese, lead, iron, and others (Shamberger, 1983). Increasing the sulfur content in the feedstuffs has impact on lowering the plasma concentration of selenium in dairy cows (Ivancic and Weiss, 2001). Pavlata et al. (2005b) described negative effect of higher doses of iodine on the metabolism of selenium in kids.
Furthermore, significant decrease of Zn con-centration in blood plasma in both experimental groups was noted after feeding Se-deficient grain mixture (Table 5). In group A, Zn blood con-centration dropped from 11.37 ± 1.45 to 8.97 ± 1.00 µmol/l (P < 0.01) and in group B from 12.70 ± 0.48 to 10.92 ± 0.83 µmol/l, though Zn levels in feed mixture did not change throughout the ex-periment (Table 2). This fact indicates possible positive effect of Se on utilization of dietary Zn. However, this trend has not been confirmed by provable correlation of both parameters.
Positive correlation was also found between blood Se concentration and albumin level (n = 32,
r = 0.63, P < 0.001) and between GSH-Px activity and albumin level (n = 32, r = 0.68, P < 0.001) in animals fed organic selenium. In wethers receiving inorganic selenium these provable correlations were not observed. These results suggest that organic Se in blood is more strongly bound with albumin than inorganic selenium. This could be due to the fact that selenomethionine is absorbed through absorption system of amino acids. Ingested selenomethionine is either metabolized directly into reactive forms of selenium or stored in place of methionine in body proteins. Selenomethionine metabolism is closely linked to protein turnover (Schrauzer, 2000, 2003).
Other monitored biochemical parameters of blood remained in the physiological range through-out the trial (total protein 62.3 ± 3.9 g/l, albu-min 36.4 ± 2.9 g/l, urea 3.85 ± 1.29 mmol/l, total bilirubin 6.37 ± 0.93 µmol/l, AST activity 1.72 ± 0.38 µkat/l, GMT activity 1.20 ± 0.27 µkat/l) and
were not significantly affected by different forms and doses of Se. This corresponds with the results of Cristaldi et al. (2005) in lambs and Davis et al. (2006) in reproducing ewes, who did not observe any changes of blood biochemistry (albumin, ALP, ALT, AST, CK, GMT) even after one year of feed-ing high doses of selenium (10 and 20 mg/kg re-spectively). If high doses of selenium were toxic, increase of enzymatic activity (AST, GMT, etc.) would be expected. In fact, activity of enzymes increases when cells are damaged and enzymes are released from intracellular space into blood. From the above-given it follows that levels of selenium that were used in the present study did not have any toxic effect on sheep.
CONCLUSION
The actual intake of selenium by sheep is reflected by Se concentration and GSH-Px activity in their blood as well as Se levels in ruminal fluid and, more importantly, in ruminal biomass. The form of sup-plemented selenium has neither significant effect on the total content of Se in ruminal biomass and blood, nor activity of GSH-Px in blood. However, animals receiving inorganic selenium tend to have higher Se concentration and GSH-Px activity in blood, whereas sheep fed organic selenium tend to show higher levels of Se in ruminal biomass. In ruminal fluid of animals receiving high doses of selenium, significant decrease of infusoria count as well as provable increase of GMT, LDH, ALP, and AST activity were observed. Other monitored parameters of ruminal fluid were not affected by the application of selenium. After administration of high Se doses, animals of both experimental groups showed decreased concentration of copper in blood. Decrease of Cu concentration was more marked in animals fed organic selenium, in which negative correlation between blood Se and Cu concentrations was seen. This indicates possible negative interaction between copper and selenium. On the contrary, addition of low doses of selenium in the feeding ration led to significant decrease of zinc levels in the blood of experimental sheep.
REFERENCES
Chaney A.L., Marbach E.P. (1962): Modified reagents for determination of urea and ammonia. Clinical Chemistry, 8, 130–132.
Cheng K.J., Hironaka R., Costerton J.W. (1976): Release of bacterial alkaline phosphatase in the rumen of cattle fed a feedlot bloat-provoking diet or a hay diet. Canadian Journal of Microbiology, 79, 409–421.
Cristaldi L.A., McDowell L.R., Buergelt C.D., Davis P.A., Wilkinson N.S., Martin F.G. (2005): Tolerance of inor-ganic selenium in wether sheep. Small Ruminant Re-search, 56, 205–213.
Czerkawski J.W. (1976): Chemical composition of micro-bial matter in the rumen. Journal of Science of Food and Agriculture, 27, 621–632.
Davis P.A., McDowell L.R., Wilkinson N.S., Buergelt C.D., Van Alstyne R., Weldon R.N., Marshall T.T. (2006): Tol-erance of inorganic selenium by range-type ewes during gestation and lactation. Journal of Animal Science, 84, 660–668.
Davis P.A., McDowell L.R., Wilkinson N.S., Buergelt C.D., Van Alstyne R., Weldon R.N., Marshall T.T., Matsuda-Fugisaki E.Y. (2008): Comparative effects of various di-etary levels of Se as sodium selenite or Se yeast on blood, wool, and tissue Se concentrations of wether sheep. Small Ruminant Research, 74, 149–158.
Dutt C., Chhabra A. (2008): Effect of inorganic selenium supplementation on nutrient intake and rumen microbial population and protein content in cattle and buffaloes. Indian Journal of Animal Sciences, 78, 758–763. Faixová Z., Faix Š., Leng L’., Váczi P., Maková Z., Szabóová
R. (2007): Haematological, blood and rumen chemistry changes in lambs following supplementation with Se-yeast. Acta Veterinaria Brno, 76, 3–8.
Feasenhiser D. (2005): The effects of organic selenium on rumen volatile fatty acid production in continuous cul-ture. Cantaurus, 13, 10–13.
Heindl J., Ledvinka Z., Englmaierová M., Zita L., Tůmová E. (2010): The effect of dietary selenium sources and levels on performance, selenium content in muscle and glutathione peroxidase activity in broiler chickens. Czech Journal of Animal Science, 55, 572–578.
Hill C.H. (1974): Reversal of selenium toxicity in chicks by mercury, copper, and cadmium. Journal of Nutrition, 104, 593–598.
Ivancic Jr. J., Weiss W.P. (2001): Effect of dietary sulfur and selenium concentrations on selenium balance of lactating Holstein cows. Journal of Dairy Science, 84, 225–232. Kim J., Van Soest P.J., Combs Jr. G.F. (1997): Studies on the
effects of selenium on rumen microbial fermentation in
vitro. Biological Trace Element Research, 56, 203–213.
Kuricová S., Boldižárová K., Grešáková L’., Bobček R., Levkut M., Leng L. (2003): Chicken selenium status when fed a
diet supplemeted with Se-yeast. Acta Veterinaria Brno, 72, 339–346.
Leeson S., Namkung H., Caston L., Durosoy S., Schlegel P. (2008): Comparison of selenium levels and source and dietary fat quality in diets for broiler breeders and layer hens. Poultry Science, 87, 2605–2612.
Ludvíková E., Pavlata L., Vyskočil M., Jahn P. (2005): Sele-nium status of horses in the Czech Republic. Acta Vete- rinaria Brno, 74, 369–375.
Mainville A.M., Odongo N.E., Betger W.J., McBride B.W., Osborne V.R. (2009): Selenium uptake by ruminal mi-croorganisms from organic and inorganic sources in dairy cows. Canadian Journal of Animal Science, 89, 105–110.
McKenzie R.C., Rafferty T.S., Beckett G.J. (1998): Selenium: an essential element for immune function. Immunology Today, 19, 342–345.
Mihaliková K., Grešáková L’., Boldižárová K., Faix Š., Leng L’., Kišidayová S. (2005): The effects of organic selenium supplementation on the rumen ciliate population in sheep. Folia Microbiologica, 50, 353–356.
Misurova L., Pavlata L., Pechova A., Dvorak R. (2009): Effect of long-term peroral supplementation with sodium sel-enite and selenium lactate-protein complex on selenium status in goats and their kids. Veterinarni Medicina, 52, 324–332.
Moharrery A., Das T.K. (2001): Correlation between micro-bial enzyme activities in the rumen fluid of sheep under different treatments. Reproduction Nutrition Develop-ment, 41, 513–529.
Monterrosa R.G.C., Bribiesca E.R., Peralta M.A.C., Vázques A.L.R., Galván M.M.C., Mora J.L.C. (2011): Selenium availability complemented with sodium selenite and sele-nomethionine in lambs. Revista Cientifica de la Facultad de Ciencias Veterinarias de la Universidad del Zulia, 21, 31–38. (in Spanish)
Naziroglu M., Aksakal M., Cay M., Celik S. (1997): Effects of vitamin E and selenium on some rumen parameters in lambs. Acta Veterinaria Hungarica, 45, 447–456. Noll F. (1988): l-(+) Lactate. Methods of Enzymatic
Analy-sis, 6, 582–588.
Paglia D.E., Valentine W.N. (1967): Studies on quantitative and qualitative characterization of erythrocyte gluta-thione peroxidase. Journal of Laboratory and Clinical Medicine, 70, 158–169.
Pavlata L. (2009): Disorders of copper metabolism. In: Hofírek B., Dvořák R., Němeček L., Doležel R., Pospíšil Z. (eds): Diseases of Cattle. Noviko a.s., Brno, Czech Republic, 708–710. (in Czech)
Pavlata L., Illek J., Pechová A. (2001a): Blood and tissue con-centrations in calves treated with inorganic and organic selenium compounds – a comparison. Acta Veterinaria Brno, 70, 19–26.
Pavlata L., Pechová A., Bečvář O., Illek J. (2001b): Selenium status in cattle at slaughter: analyses of blood, skeletal muscle, and liver. Acta Veterinaria Brno, 70, 277–284. Pavlata L., Illek J., Pechová A., Matějíček M. (2002):
Sele-nium status of cattle in the Czech Republic. Acta Veteri-naria Brno, 71, 3–8.
Pavlata L., Podhorsky A., Pechova A., Chomat P. (2005a): Differences in the occurrence of selenium, copper and zinc deficiencies in dairy cows, calves, heifers and bulls. Veterinarni Medicina, 50, 390–400.
Pavlata L., Slosarkova S., Fleischer P., Pechova A. (2005b): Effects of increased iodine supply on the selenium status of kids. Veterinarni Medicina, 50, 186–194.
Pavlata L., Chomat M., Pechova A., Misurova L., Dvorak R. (2011a): Impact of long-term supplementation of zinc and selenium on their content in blood and hair in goats. Veterinarni Medicina, 56, 63–74.
Pavlata L., Misurova L., Pechova A., Dvorak R. (2011b): The effect of inorganic and organically bound forms of selenium on glutathione peroxidase activity in the blood of goats. Veterinarni Medicina, 56, 75–81.
Pavlata L., Mišurová L., Pechová A., Dvořák R. (2012a): Comparison of organic and inorganic forms of selenium in the mother and kid relationship in goats. Czech Journal of Animal Science, 57, 361–369.
Pavlata L., Misurova L., Pechova A., Husakova T., Dvorak R. (2012b): Direct and indirect assessment of selenium status in sheep – a comparison. Veterinarni Medicina, 57, 219–223. Pechová A., Pavlata L., Illek J. (2005): Blood and tissue selenium
determination by hydride generation atomic absorption spectrophotometry. Acta Veterinaria Brno, 74, 483–490. Pechova A., Misurova L., Pavlata L., Dvorak R. (2008):
Moni-toring of changes in selenium concentration in goat milk during short-term supplementation of various forms of se-lenium. Biological Trace Element Research, 121, 180–191. Rabianski P.A., McDowell L.R., Velasquez-Pereira J., Wilkin-son N.S., Bates D.B., JohnWilkin-son A.B.B., Batra T.R., Salga-do-Madriz E. (1998): Feeding copper lysine and copper sulfate to cattle. Journal of Dairy Science, 81, 2042–2050. Rock M.J., Kincaid R.L., Carstens G.E. (2001): Effects of
prenatal source and level of dietary selenium on passive immunity and thermometabolism of newborn lambs. Small Ruminant Research, 40, 129–138.
Ruz M., Codoceo J., Galgani J., Muñoz L., Gras N., Muzzo S., Leiva L., Bosco C. (1999): Single and multiple selenium-zinc-iodine deficiencies affect rat thyroid metabolism and ultrastructure. The Journal of Nutrition, 129, 174–180. Schrauzer G.N. (2000): Selenomethionine: a review of its
nutritional significance, metabolism and toxicity. The Journal of Nutrition, 130, 1653–1656.
Schrauzer G.N. (2003): The nutritional significance, me-tabolism and toxicology of selenomethionine. Advances in Food and Nutrition Research, 47, 73–112.
Serra A.B., Nakamura K., Matsui T., Harumoto T., Fujihara T. (1994): Inorganic selenium for sheep I. Selenium balance and selenium levels in the different ruminal fluid fractions. Asian-Australasian Journal of Animal Sciences, 7, 83–89. Sevcikova L., Pechova A., Pavlata L., Antos D., Mala E.,
Palenik T., Panev A., Dvorak R. (2011): The effect of vari-ous forms of selenium supplied to pregnant goats on the levels of selenium in the body of their kids at the time of weaning. Biological Trace Element Research, 143, 882–892. Shamberger R.J. (1983): Biochemistry of Selenium. 1st Ed.
Plenum Press, New York, USA.
Skřivan M., Bubancová I., Marounek M., Dlouhá G. (2010): Selenium and alpha-tocopherol content in eggs produced by hens that were fed diets supplemented with selenom-ethionine, sodium selenite and vitamin E. Czech Journal of Animal Science, 55, 388–397.
Underwood E.J., Suttle N.F. (1999): The Mineral Nutrition of Livestock. 3rd Ed. CABI, Wallingford, UK.
Wang R., Bai Y., Liang Z.H., Liu Y., Huang L.L., Zheng W.J. (2010): Interaction between selenomethionine and cop-per ions. Acta Physico-Chimica Sinica, 26, 3225–3229. Wang Y.X., Zhang X.A., Yuan D., Zhang X.W., Wu R.J.
(2011): Effects of selenomethionine and sodium selenite supplementation on meat quality, selenium distribution and antioxidant status in broilers. Czech Journal of Ani-mal Science, 56, 305–313.
Weekes T.E.C. (1972): Effects of pregnancy and lactation in sheep on the metabolism of propionate by the rumen mucosa and on some enzymatic activities in the ruminal mucosa. The Journal of Agricultural Science, 79, 409–421. Zeng H., Botnen J.H. (2004): Copper may interact with
selenite extracellularly in cultured HT-29 cells. Journal of Nutritional Biochemistry, 15, 179–184.
Received: 2012–04–20 Accepted after corrections: 2012–08–27
Corresponding Author