Field Performance Evaluation of Micro Irrigation
Systems in Iran
Mohammad ZAMANIYAN
1, Rouhollah FATAHI
1and Saeed BOROOMAND-NASAB
21Department of Water Engineering, Faculty of Agriculture, Shahrekord University, Shahrekord,
Chaharmahal and Bakhtiari, Iran; 2Department of Irrigation and Drainage, Faculty
of Water Science Engineering, Shahid Chamran University, Ahwaz, Khuzestan, Iran
Abstract
Zamaniyan M., Fatahi R., Boroomand-Nasab S. (2014): Field performance evaluation of micro irrigation
systems in Iran. Soil & Water Res., 9: 135–142.
The efforts to introduce the micro irrigation system in Iran go back as far as the year 1990. The area under micro irrigation system in Iran covers about 400 000 ha and it is estimated to double (800 000 ha) during the next five years. The field performance of micro irrigation systems was studied in ten Iranian sites. Physical, chemical, and biological analyses of water samples derived from each site included pH, electrical conductivity (EC), total suspended solids (TSS), total dissolved solids (TDS), Fe, Mn, Mg, Ca, and bacterial number (BN). In this study
relative emitter discharge (R), percentage of completely clogged emitters (Pclog), emission uniformity (EU),
abso-lute uniformity emission (EUa), statistical uniformity (Us), coefficient of variation due to emitter performance in
the field (Vpf), and sector emission uniformity (EUs) were evaluated. Results showed that performance of micro
irrigation systems in Iran is low and poor. Average EU, Us, and Vpf values in different sites were 52.8, 61.3, and
38.2%, respectively. Most frequent problems detected in irrigation units were: inadequate working pressure, emitters clogging, and lacking farmers’ training.
Keywords: emitter clogging; emission uniformity; statistical uniformity
Micro irrigation system (MIS) is gaining impor-tance in the world, especially in areas with limited and expensive water supplies, since it allows limited resources to be more fully utilized. The extent of micro irrigated areas grew gradually from 1.1 million ha in 1986 to about 3.0 million ha in 2000. Today, the micro irrigation has been practiced in more than 70 countries covering an area of over 6 million ha and the area extended twice just during the last six years (Sne 2006).
Efficient use of water resources and improving water productivity is one of the important issues and priorities of the Islamic Republic of Iran, especially in the last two decades. This is highlighted in the national policies and in various five-year national development plans of the country. In Iran, efforts have been made to introduce MIS at farmer’s level since 1990. The yield has increased by up to 50% while saving water at a significant level. In Iran,
the area under MIS is about 400 000 ha and based on estimates it should double in the next 5 years. Development of water saving irrigation systems and technologies, especially pressurized irrigation systems in the irrigated area, has been one of the important goals of the policy makers and planners in the agriculture sector. However, despite consider-able attention devoted to the sustainconsider-able develop-ment of pressurized irrigation systems in Iran, the irrigated lands equipped with these systems cover still only 10.2% (0.89 million ha) of the total irrigated areas (8.7 million ha) of the country. In Iran, trees are the main plants irrigated by MIS (Heydari & Dehghanisanij 2011). The development plan of the pressurized irrigation systems in the country is provided in Table 1.
country. Improvement of on-farm irrigation efficiency is important not only to enhance the overall irriga-tion efficiency of the irrigairriga-tion district but also to increase the crop water productivity. Beside better use of other farm inputs like seed, fertilizers and energy, to increase crop yields under conditions of shortage of water for irrigation the use of sprinkler and micro irrigation methods has steadily been increasing glob-ally. At the same time, these pressurized irrigation techniques should not be considered as a panacea for improvement of on-farm water management. Experience has shown that if these systems are not designed, operated, and maintained properly, they may not give the expected benefits and even in some situations may adversely affect the crop growth. It is therefore essential to carry out periodic diagnostic analyses and performance evaluations of the pres-surized irrigation systems to ensure that they are operating optimally (Ghinass 2008).
Distribution uniformity of the irrigation system is accepted as one of the key criteria for evaluating the irrigation system performance. The uniformity of the infiltrated water through furrow and bor-der in surface irrigation systems, the uniformity of water collected in catch cans in sprinkle irrigation systems, and the uniformity of emitter discharges in MIS are overall measurements which are taken into consideration through performance evaluation (Wu & Barragan 2000).
The objective of the present study was to evaluate the performance of MIS after several years of its use in strenuous conditions in Iran.
MATERIAL AND METHODS
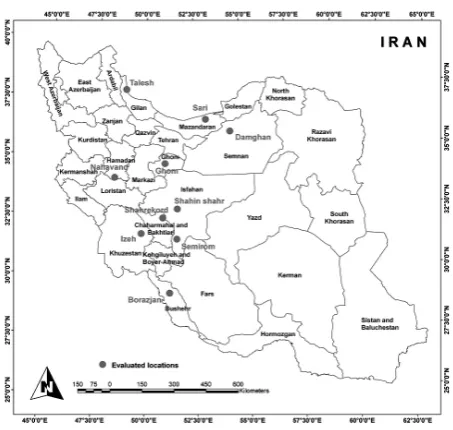
Experimental sites. Iran has 165 million ha of ar-able land out of which only 8 million ha are irrigated, 6 million ha are rain-fed, and 4.5 million ha remain in the form of fallow land. Climate of Iran exhibits one the greatest extremes due to its geographic location
and variation in topography. The summer is extremely hot in its central deserts while temperatures fall far below zero in the West Mountains. Annual rainfall ranges from less than 50 mm in the deserts to more than 1600 mm on the Caspian Plain. The average annual rainfall is 252 mm and approximately 90% of the country is arid or semiarid. Taken as a whole, about two-thirds of the country annually receives less than 250 mm of rainfall. Most of the rainfall is registered during the winter season, particularly in the northern parts of the country. In the central and southern parts of Iran, the annual rainfall ranges 0–200 mm (Aali et al. 2009).
A field study involving MIS was conducted at ten Ira-nian sites (Table 2) of various locations during summer 2012 (Figure 1). Climate classifications given in Table 2 are according to UNESCO (Ghafari et al. 2004).
[image:2.595.63.532.101.211.2]The evaluations have been carried out according to Merriam and Keller’s (1978) recommendations,
Table 1. Trend of development of pressurized irrigation systems in Iran (Heydari and Dehghanisanij 2011)
National development plans Planned Achieved Percent of achievement (%)
(thousands of ha)
1st plan and before (1990–1994) 277 67 24.2
2nd plan (1995–1999) 807 204 25.3
3rd plan (2000–2004) 609 216 35.5
4th plan (2005–2009) 500 381 76.2
5th plan (2010–2014) 1000 74.8* 7.5
*this plan has not been officially started yet and the data are just for the start of the year 2010
[image:2.595.305.532.506.721.2]followed also by other authors (Keller & Bliesner 1990; Ortega et al. 2002; Yavuz et al. 2010; Noori & Thamiri 2012).
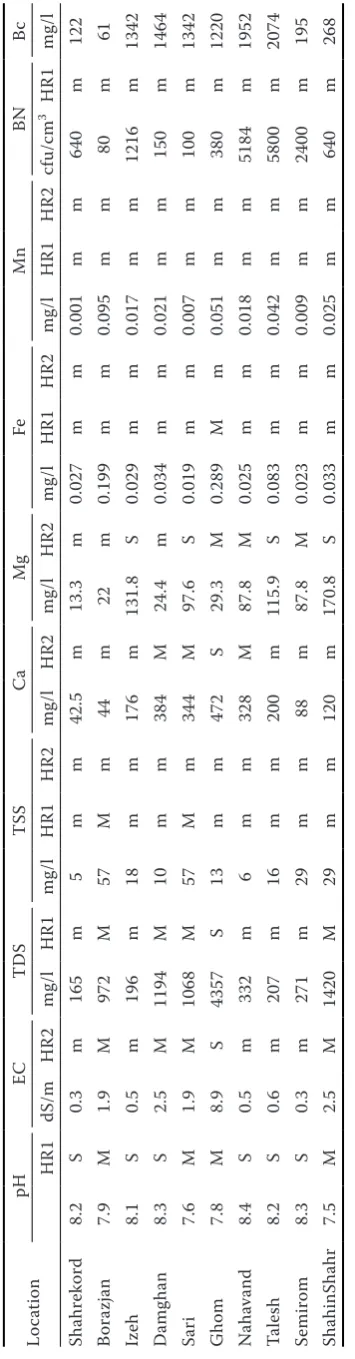
Water quality. Water samples were taken during the field test to determine the most important fac-tors affecting emitter clogging (Nakayama & Bucks 1991; Capra & Scicolone 1998): electrical conduc-tivity (EC), pH, total suspended solids (TSS), total dissolved solids (TDS), total iron (Fe), calcium (Ca), magnesium (Mg), manganese (Mn), bicarbonates (Bc), and bacterial number (BN). Water analyses were car-ried out in the laboratory; chemical and microbial changes in some factors were stopped by appropriate sample treatment (APHA 2005).
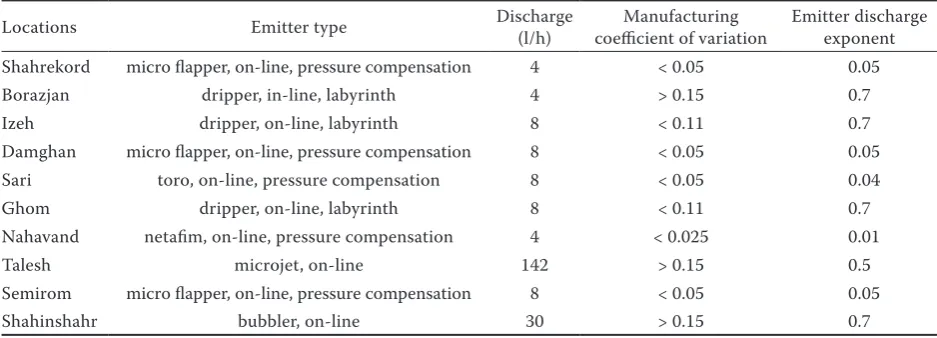
Emitters. The hydraulic characteristics of the emitters for all locations were taken over from the irrigation system manufacturer’s manual and listed in Table 3. According to ASAE Standards (2003) defining coefficient of variation (CVm) for emitters manu-facturing, emitter types in Shahrekord, Damghan, Sari, Nahavand, and Semiromsites were classified as excellent (CVm < 0.05), whereas emitter types in Borazjan, Izeh, Ghom, Talesh, and Shahinshahr were classified as poor and unacceptable (CVm > 0.11).
Evaluation parameters. According to the meas-ured data, the parameters obtained to characterize uniformity were as follows (Liu & Huang 2009):
(1) Relative emitter discharge (R) was calculated as:
(1)
where:
q, qini – mean emitters discharge for each measurement
(l/h) and emitters nominal discharge (l/h), respectively
(2) Percentage of completely clogged emitters (Pclog) was calculated as:
(2)
where:
Nclog, N – number of completely clogged emitters and
the total number of emitters in experimental manifold, respectively
(3) Emission uniformity (EU) is one of the most frequently used design criteria for MIS. It is one of the indices for evaluation of micro irrigation
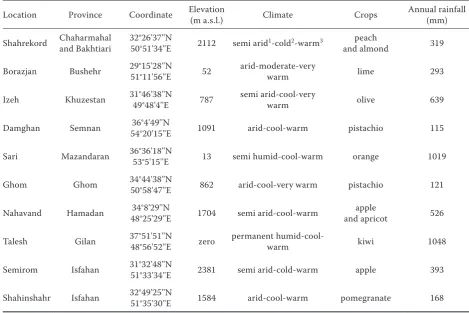
per-Table 2. Characteristics of different locations
Location Province Coordinate Elevation (m a.s.l.) Climate Crops Annual rainfall (mm)
Shahrekord Chaharmahal and Bakhtiari 32°26'37''N50°51'34''E 2112 semi arid1-cold2-warm3 peach
and almond 319
Borazjan Bushehr 29°15'28''N51°11'56''E 52 arid-moderate-very warm lime 293
Izeh Khuzestan 31°46'38''N49°48'4''E 787 semi arid-cool-very warm olive 639
Damghan Semnan 54°20'15''E36°4'49''N 1091 arid-cool-warm pistachio 115
Sari Mazandaran 36°36'18''N53°5'15''E 13 semi humid-cool-warm orange 1019
Ghom Ghom 34°44'38''N50°58'47''E 862 arid-cool-very warm pistachio 121
Nahavand Hamadan 48°25'29''E34°8'29''N 1704 semi arid-cool-warm and apricotapple 526
Talesh Gilan 37°51'51''N48°56'52''E zero permanent humid-cool-warm kiwi 1048
Semirom Isfahan 31°32'48''N51°33'34''E 2381 semi arid-cold-warm apple 393
Shahinshahr Isfahan 32°49'25''N51°35'30''E 1584 arid-cool-warm pomegranate 168
1moisture regime; 2winter regime; 3summer regime
ini R
q q
N Nclog clog 100 P
[image:3.595.61.531.101.414.2]formance recommended by the ASAE Standards (ASAE 1982).
(3)
where:
q1/4min – mean discharge of lower quartile (l/h)
q – mean discharge of emitters in irrigation unit (l/h)
The evaluated system is classified according to the EU values, following Merriam and Keller (1978) and Capra and Scicolone (1998) (Table 4).
(4) Absolute uniformity emission (EUa) that is defined by Keller and Karmeli (1974), and it considers not only the possible effects derived from the lack of water in certain points of the plant zones, but also the excess produced as a consequence of the application hetero-geneity of the system. Its expression is given in Eq. (4).
(4)
where:
q1/8min – average flow perceived by the 1/8 of plants which perceive the highest flow in the test subunit (l/h)
(5) Statistical uniformity (Us) between the emitters is determined by Eq. (5) (Bralts & Kesner 1983).
(5)
where:
Us – statistical uniformity (%)
Vq – overall change in emitters discharge
Sq – standard deviation of emitters discharge (l/h)
[image:4.595.63.532.102.271.2]Statistical uniformity is evaluated according to ASAE (2003) and Capra and Scicolone (1998), based on the classification criterion presented in Table 5.
(6) Coefficient of variation due to emitter perfor-mance in the field (Vpf) according to Bralts (1986) is:
(6)
where:
Vpf – coefficient of variation of emitters discharge at the
constant pressure Table 3. Hydraulic characteristics of emitters
Locations Emitter type Discharge (l/h) coefficient of variationManufacturing Emitter discharge exponent
Shahrekord micro flapper, on-line, pressure compensation 4 < 0.05 0.05
Borazjan dripper, in-line, labyrinth 4 > 0.15 0.7
Izeh dripper, on-line, labyrinth 8 < 0.11 0.7
Damghan micro flapper, on-line, pressure compensation 8 < 0.05 0.05
Sari toro, on-line, pressure compensation 8 < 0.05 0.04
Ghom dripper, on-line, labyrinth 8 < 0.11 0.7
Nahavand netafim, on-line, pressure compensation 4 < 0.025 0.01
Talesh microjet, on-line 142 > 0.15 0.5
Semirom micro flapper, on-line, pressure compensation 8 < 0.05 0.05
[image:4.595.303.532.616.755.2]Shahinshahr bubbler, on-line 30 > 0.15 0.7
Table 4. System classifications according to emission uni-formity (EU) values
EU (%)
Classification Merriam and Keller
(1978) Capra and Scicolone (1998)
< 66 poor low
66–70 poor mean
70–80 acceptable
80–84 good
84–90 good high
> 90 excellent
Table 5. System classifications according to statistical uniformity (Us) values
Us (%)
Classification
ASAE (2003) Capra and Scicolone (1998)
< 60 unacceptable low
60–70 poor
70–71 acceptable
71–80 acceptable mean
80–89 good
89–90 good high
> 90 excellent
q q1/4min 100 EU max 8 / 1 min 4 / 1 a 2 1 100 EU q q q q max 8 / 1 min 4 / 1 a 2 1 100 EU q q q q max 8 / 1 min 4 / 1 a 2 1 100 EU q q q q q S Vq 1001 q 1
100
Us
q S Vq 1001 q 1
100 Us
2 0.52 2 5 . 0 2 2 2 100
100
h S x V V x V
Vpf
q h
q h5 . 0 2 2 2 5 . 0 2 2 2 100
100
h S x V V x V
Vpf
q h
q h5 . 0 2 2 2 5 . 0 2 2 2 100
100
h S x V V x V
[image:4.595.63.290.631.756.2]x – emitter flow-rate exponent
Vh – coefficient of variation of the pressure head
Sh – standard deviation of pressure measured in
irriga-tion unit (N/m2)
h – mean pressure in irrigation unit (N/m2)
Coefficient of variation due to emitter performance in irrigation unit is evaluated according to ASAE (2003) and Capra and Scicolone (1998), following the classification criterion shown in Table 6.
(7) Sector emission uniformity (EUs) that is de-termined starting from the tested subunit EU, and then correcting it by a multiplicative (f ) that consid-ers pressure distribution among the subunits that constitute the irrigation sector (Eq. (7)). Correction factor (f) calculations based on pressure distribution are stated in Eq. (8).
EUs = f × EU (7)
(8)
where:
P1/4min, P – mean of low quarter and average pressure
values (N/m2), measured at the beginning
of the lateral pipe and in each subunit of the operational irrigation unit, respectively
RESULTS AND DISCUSSION
Water quality.The physical, chemical, and biologi-cal properties of water from the experimental sites are listed in Table 7, and were compared with the water quality criteria for emitter clogging proposed by Bucks et al. (1979) and Capra and Scicolone (1998). According to Bucks et al. (1979), based on their properties (pH, TDS, TSS, Fe, Mn) the tested irrigation waters can be classified, in general, as minor hazardous to severe hazardous in some cases. According to Capra and Scicolone (1998), the hazard rating is, in general, from minor to moderate for EC except Ghom where it was severe, minor for TSS, from minor to moderate for Ca except Ghom where it was severe, from minor to severe for Mg, minor for Fe and Mn. The bicarbonate values for Izeh, Damghan, Sari, Ghom, Nahavand, and Talesh waters were high.
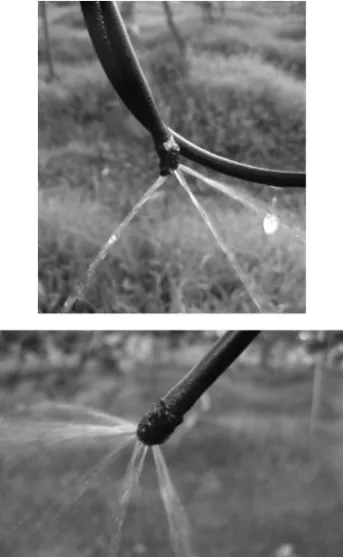
Bicarbonate concentrations of more than 305 mg/l caused serious problems due to precipitates in the irrigation system (Ayers & Westcot 1985). In Talesh, large formations of biological biofilm were observed, which occurred also in the micro jet orifice (Figure 2).
[image:5.595.305.532.114.255.2]Evaluation parameters. The partially and com-pletely clogged emitters were analyzed using the relative emitter discharge (R). According Capra and Scicolone (1998), R is divided into three classes: high (≥ 0.79), moderate (0.79–0.61), and low (< 0.61). As shown in Figure 3, R value for Shahrekord site was very high because of the damage of the elastic membrane by nail and installation of emitter on lateral side in an inverted position for exit excess discharge. The result implies that pressure compensation types of emitters show a better anti-clogging potential than the labyrinth types of emitters, and this result
Table 6. System classifications according to variation
coeffi-cient of emitter performance (Vpf) values
Vpf (%)
Classification
ASAE (2003) Capra and Scicolone (1998)
> 29 unacceptable low
20–29 unacceptable mean
15–20 poor
11–15 acceptable
10–11 acceptable high
5–10 good
< 5 excellent
Figure 2. Formation of biological biofilm in micro jets in Talesh
x
P P
f
[image:5.595.332.504.446.725.2]agrees with the findings of Liu and Huang (2009). The R values for Borazjan and Talesh sites were low.
The Pclog for all sites is presented in Figure 4, in-dicated by the blank bar. Results show that Pclog in Shahrekord, Borazjan, Sari, and Shahinshahr is high. Most sensitive emitters to clogging were found in Shahrekord and Borazjan sites that had the lowest discharges among the studied sites. Ravina et al.
(1997), Trooien et al. (2000), and Liu and Huang (2009) found that emitters with higher discharge are clogged less than those with lower discharge.
Emitter clogging greatly reduces the water distri-bution uniformity in irrigated fields (Ravina et al.
[image:6.595.305.531.80.232.2]1997; Capra & Scicolone 1998; Puig-Bargues et al. 2005; Liu & Huang 2009), which negatively influ-ences crop growth and yield. Ortega et al. (2002) evaluated local trickle irrigation units and calculated average emission uniformity, average absolute emission uniformity, and system emission uniformity. Accord-ing to the criteria proposed by Merriam and Keller (1978) and Capra and Scicolone (1998), EU values in Shahrekord, Borazjan, Izeh, Sari, Nahavand, and
Figure 3. Relative emitter discharge in different locations
Figure 4. Percentage of completely clogged emitters at different locations Re la tive emit ter di sc har ge 10 8 6 4 2 0 Location Shahr ekord Bora
zjan Izeh Damg
han Sari Ghom
Nahavand Tale sh Semir om Shahins hahr Location Com ple te ly c lo gg ing emit ters (%) 40 30 20 10 0 Shahr ekord Bora zjan Izeh
Damg
han Sari Ghom
[image:6.595.79.257.82.763.2]Nahavand Tale sh Semir om Shahins hahr Ta
ble 7. Re
sult
s of w
at
er sam
ple
s analy
se
s and c
la ssific ation r el at ed t o p ot en tial ha zar
d of emit
ter c lo gg ing Lo ca tion pH EC TD S TS S Ca Mg Fe Mn BN Bc H R1 dS/m H R2 mg/l H R1 mg/l H R1 H R2 mg/l H R2 mg/l H R2 mg/l H R1 H R2 mg/l H R1 H R2 cf u/c m 3H R1 mg/l Shahr ek or d 8.2 S 0.3 m 165 m 5 m m 42.5 m 13.3 m 0.027 m m 0.001 m m 640 m 122 Bora zjan 7.9 M 1.9 M 972 M 57 M m 44 m 22 m 0.199 m m 0.095 m m 80 m 61 Ize h 8.1 S 0.5 m 196 m 18 m m 176 m 131.8 S 0.029 m m 0.017 m m 1216 m 1342 D amg han 8.3 S 2.5 M 1194 M 10 m m 384 M 24.4 m 0.034 m m 0.021 m m 150 m 1464 Sar i 7.6 M 1.9 M 1068 M 57 M m 344 M 97.6 S 0.019 m m 0.007 m m 100 m 1342 Ghom 7.8 M 8.9 S 4357 S 13 m m 472 S 29.3 M 0.289 M m 0.051 m m 380 m 1220 N aha vand 8.4 S 0.5 m 332 m 6 m m 328 M 87.8 M 0.025 m m 0.018 m m 5184 m 1952 Tale sh 8.2 S 0.6 m 207 m 16 m m 200 m 115.9 S 0.083 m m 0.042 m m 5800 m 2074 Semir om 8.3 S 0.3 m 271 m 29 m m 88 m 87.8 M 0.023 m m 0.009 m m 2400 m 195 ShahinShahr 7.5 M 2.5 M 1420 M 29 m m 120 m 170.8 S 0.033 m m 0.025 m m 640 m 268 EC – ele ctr ic al conduc tiv ity ; TD S – tot al di ss olve d solid s; T SS – tot al su sp ende d solid
s; BN –
bac ter ial numb er ; B c – bic arb ona te s; H
R1 – ha
zar d ra ting ac cor ding to Buc ks et a l
. (1979); H
R2 – ha
zar d ra ting ac cor ding t o Cap ra and Sc ic ol one
(1998); m – minor
; M – mo
dera
te; S – s
ever
[image:6.595.306.530.566.723.2]Shahinshahr were poor and low (Figure 5). Average EU values in different locations of Iran are 52.8%, those according to Merriam and Keller (1978) and Capra and Scicolone (1998) were poor and low, respectively. In most cases an incorrect management of the maintenance led to low emission uniformity. Thus, several important problems in the equipment evaluated have been detected: inadequate working pressures, high pressure differences in subunits, emit-ters clogging, and high manufacturing coefficient of variation of emitters. Inadequate working pressure values are often due to malfunctioning installation and management (pumping station regulation, clean-ing status of the filters, etc.) and are, occasionally, a consequence of installation design problems.
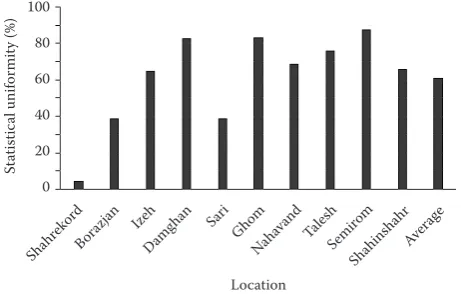
According to Capra and Scicolone (1998), Us values of all locations were low and/or mean and also according to ASAE (2003), values of Us in all sites except Damghan, Ghom, Talesh, and Semirom were unacceptable and poor (Figure 6). At different studied locations of Iran average Us value is 61.3%, Us values according to ASAE (2003) and Capra and Scicolone (1998) are considered as poor and low, respectively.
According to the classification of Capra and Sci-colone (1998), Vpf values of all studied locations are categorized as low to mean; also according to ASAE (2003), Vpf values of all locations except Semirom and Shahinshahr are classified as unacceptable and poor (Figure 7). Average Vpfvaluein different stud-ied locations of Iran is 38.2%, which is, according to ASAE (2003) and Capra and Scicolone (1998), considered as unacceptable and low, respectively.
CONCLUSION
It is necessary to know the uniformity of operating MIS to improve system’s performance. The study involved the MIS performance investigation under field conditions in Iran. Average EU, Us, and Vpf val-ues determined in different locations (52.8, 61.3, and 38.2%, respectively) are insufficient. The following suggestions and causes of performance reduction in Iranian trickle irrigation systems were identified: – Inadequate working pressures and high pressure differences in subunits that are often due to mal-functioning installation and management (pumping station regulation, cleaning status of the filters, etc.) and are, occasionally, a consequence of installation design problems.
– Unavailability of completely soluble solid fertiliz-ers or liquid fertilizfertiliz-ers created problems in some of the systems manifested as clogging of emitters by solids.
– Most of the farmers did not know how much water should be applied or how to adjust the emitters to achieve the needed application. They did not know a way of measuring the delivery discharge. – Farmers were not trained in how to maintain trickle
[image:7.595.306.533.83.230.2]irrigation systems (filtration, acidification, and chlorination).
Figure 5. Emission uniformity (EU) of different locations
[image:7.595.65.291.84.231.2]Figure 6. Statistical uniformity of different locations
Figure 7. Variation coefficient of emitter performance in different locations
Location
Emi
ssion unif
or
mity (%)
100
80
60
40
20
0
Shahr ekord
Borazjan Ize h
Damg
han Sari Ghom Nahavand Tale
sh Semir
om
Shahins hahr
Average EU EUa EUs
Location
St
ati
stic
al unif
or
mity (%)
100
80
60
40
20
0
Shahr ekord
Borazjan Ize h
Damg
han Sari Ghom Nahavand Tale
sh Semir
om
Shahins hahr
Average
Location
Var
ia
tion c
oeffic
ien
t of emit
ter
per
for
manc
e (%)
100
80
60
40
20
0
Shahr ekord
Borazjan Ize h
Damg
han SariGhom Nahavand Tale
sh Semir
om
Shahins hahr
[image:7.595.62.293.590.737.2]Emitters discharge must be regularly checked during the process of irrigation and in case of identification of clogging, flushing or acid injection or chlorination processes must be applied.
References
Aali K.A., Liaghat A., Dehghanisanij H. (2009): The effect of acidification and magnetic field on emitter clog-ging under saline water application. Journal of Agricul-tural Science, 1: 132−141.
APHA (2005): Standard Methods for the Examination of Water and Wastewater. 21st Ed. American Public Health
Association, Washington, DC.
ASAE (1982): Design, Installation and Performance of Trickle Irrigation Systems. Agricultural Engineers Year-book, Standards of ASAE, American Society of Agricul-tural Engineers, St. Joseph, 519−522.
ASAE (2003): Field evaluation of micro irrigation systems. EP458. American Society of Agricultural Engineers, St. Joseph, 760−765.
Ayers R.S., Westcot D.W. (1985): Water Quality for Ag-riculture. FAO, Rome.
Bralts V.F., Kesner C.D. (1983): Drip irrigation field uniform-ity estimation. Transactions of the ASAE, 26: 1369−1374. Bralts V.F. (1986): Field performance and evaluation in
trickle irrigation for crop production. In: Nakayama F.S., Bucks S.A. (eds): Design, Operation and Management. Elsevier, Amsterdam.
Bucks D.A., Nakayama F.S., Gilbert R.G. (1979): Trickle irrigation water quality and preventive maintenance. Agricultural Water Management, 2: 149−162.
Capra A., Scicolone B. (1998): Water quality and distribu-tion uniformity in drip/trickle irrigadistribu-tion systems. Journal of Agricultural Engineering Research, 70: 355−365. Ghafari A., Ghasemi V., Depao V. (2004): Agricultural
cli-mate zone classification with UNESCO method. Drought and Drought, 12: 30−35.
Ghinass G. (2008): Manual for performance evaluation of sprinkler and drip irrigation systems in different agro-climatic regions of the world. ICID, New Delhi.
Heydari N., Dehghanisanij H. (2011): Socio-economic and policy-institution issues and challenges in sustainable development of pressurized irrigation systems in Iran. In: 8th Int. Micro Irrigation Congr. October 21, 2011, Tehran.
Keller J., Karmeli D. (1974): Trickle irrigation design parameters. Transcations of the ASAE, 17: 678−684. Keller J., Bliesner R.O. (1990): Sprinkle and Trickle
Ir-rigation. AVI Book. Van Nostrand Reinhold, New York. Liu H., Huang G. (2009): Laboratory experiment on drip
emitter clogging with fresh water and treated sewage effluent. Agricultural Water Management, 96: 745−756. Merriam J.L., Keller J. (1978): Farm Irrigation System
Evaluation: A Guide for Management. Utah State Uni-versity, Logan.
Nakayama F.S., Bucks D.A. (1991): Water quality in drip/ trickle irrigation: a review. Irrigation Science, 12: 187−192. Noori J.S., Thamiry H.A. (2012): Hydraulic and statisti-cal analyses of design emission uniformity of trickle irrigation systems. Journal of Irrigation and Drainage Engineering, 138: 791−798.
Ortega J.F., Tarjuelo J.M., De-Juan J.A. (2002): Evalu-ation of irrigEvalu-ation performance in localized irrigEvalu-ation systems of semi-arid regions (Castilla-La Mancha, Spain). Agricultural Engineering International: The Cigr Journal of Scientific Research and Development, 4: 1−17. Puig-Bargues J., Arbat G., Barragan J., Ramirez de
Cartagena F. (2005): Hydraulic performance of drip irrigation subunits using WWTP effluents. Agricultural Water Management, 77: 249−262.
Ravina I., Paz E., Sofer Z., Marcu A., Schischa A., Sagi G., Yechialy Z., Lev Y. (1997): Control of clogging in drip irrigation with stored treated municipal sewage effluent. Agricultural Water Management, 33: 127−137. Sne M. (2006): Micro Irrigation in Arid and Semi-arid
Regions – Guidelines for Planning and Design. Israel Export & International Cooperation Institute, Tel-Aviv. Trooien T.P., Lamm F.R., Stone L.R., Alam M., Rogers
D.H., Clark G.A., Schegel A.J. (2000): Subsurface drip irrigation using livestock wastewater: drip line flow rates. Applied Engineering Agriculture, 16: 505−508.
Wu I.P., Barragan J. (2000): Design criteria for micro ir-rigation systems. Transactions of ASAE, 43: 1145−1154. Yavuz M.Y., DemirelK., Erken O., Bahar E., Deveciler M. (2010): Emitter clogging and effects on drip irrigation systems performances. African Journal of Agricultural Research, 5: 532−538.
Received for publication February 11, 2013 Accepted after corrections February 14, 2014
Corresponding author: