USING TECHNOLOGY TO INSPIRE AND ENHANCE THE LEARNING
OF STATISTICS IN A LARGE COHORT OF DIVERSE ABILITY
I. Weir, Rh. Gwynllyw, K. Henderson
University of the West of England, Bristol (UNITED KINGDOM)
Abstract
In this paper we illustrate how we have used technology to teach and efficiently assess statistics within a Level 2 research skills module delivered to Business School students. The student cohort was a large diverse group of non-mathematicians and the syllabus comprised a short course in statistics together with learning the SPSS statistical software package. Student learning was enhanced through the use of multimedia and this enabled students to self-learn SPSS output creation. This freed up time in lectures and subsequent computer practicals for staff to concentrate on giving higher level interpretative advice.
The statistics assessment comprised a contribution from each computer practical to a Learning Journal and two e-Assessments. For each Learning Journal question, students were given a pre-prepared template which was designed to represent a complete statistical analysis. It had the SPSS output removed, numerical values blanked out and inserted multiple choice interpretation decisions to make. Setting it up in this way enabled students to concentrate on the mechanics of the creation of SPSS output and interpretation of results. The e-Assessment system used was DEWIS as it can communicate with the R statistical package which was employed to generate bespoke student data and generate answers that would match SPSS screen output; implement continuation marking for a large number of inputs; run staged assessments; provide dynamic feedback specific to student inputs. Results have been excellent. Teaching and assessing in this way has made the challenging task of delivering and assessing this material in a short space of time achievable. The fact that students can refer to their Learning Journals and access “how-to” SPSS videos will be beneficial to their further studies.
Keywords: e-Assessment, statistics, SPSS, multimedia, higher education.
1
INTRODUCTION
We report on our experiences of and innovations used in the teaching and assessing of statistics within a new Level 2 research skills module delivered to over 750 Business School students at the University of the West of England, Bristol, (UWE) and partner institutions (such as Alexandra College, Cyprus and British College Kathmandu, Nepal.) The module contains a short course on statistics covering a challenging amount of material together with learning to use the statistical software package, SPSS. The skills learned in this module are designed to provide a solid foundation for students to undertake Level 3 project work. Assessment of the statistical elements comprised a contribution from each computer lab to a Learning Journal and two e-Assessments.
Being an effective student requires the ability to guide one's own learning activities effectively (e.g. [1], [2]). For the learning of SPSS, some standard techniques need to be mastered and, as with other software applications [3], the use of multimedia has been found to be beneficial. This enables students to learn at their own pace, as well as to review topics as necessary. Using Adobe® Captivate™ software has enabled the creation of professional-quality software demonstrations. The advantage of this approach is that scheduled teaching time can be used for higher level learning and interpretation of data, whilst the mechanics of SPSS data generation can be self-taught by students through access to these videos.
2 METHODOLOGY
2.1 Overview
The statistics component of the module was taught in a six week period and the weekly schedule is shown below:
Week 1: Exploratory data analysis (EDA), one sample T-test & nonparametric equivalent; Week 2: Two sample T-tests & nonparametric equivalents;
Week 3: One-way ANOVA & nonparametric equivalent; Week 4: Correlation & simple linear regression;
Week 5: Multiple regression;
Week 6: Principal Component Analysis (PCA) & Cluster Analysis.
Although students have studied some statistics in the first year, the syllabus presented above constituted a challenging amount of material to cover, especially since the student cohort was a large, diverse group of non-mathematicians. In addition, students were expected to learn how to use SPSS and to gain sufficient competency/understanding of the techniques so that they would be able to perform data analysis in their level 3 project module the following year. Some of the challenges to overcome in designing the way the statistics material was to be taught and assessed were identified as follows:
1. How to efficiently assess the large number of students; 2. How to make sure all staff were teaching the same way; 3. How to give students access to resources for future years; 4. Enabling students to independently learn SPSS.
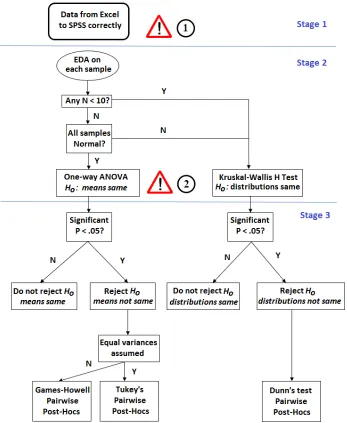
Point 1 was addressed through the use of e-Assessment and further detail is provided in Section 2.3. In total, two e-Assessments were established which were used to assess the material covered in weeks 1-5. These skills are typically assessed using a written report, which is very time-consuming to mark. The first e-Assessment tested the material covered in weeks 1-3 and the second e-Assessment tested the material covered in weeks 4-5. It was deemed too difficult to automatically assess the material covered in week 6 due to the subjective nature of the analysis required. Point 2 was particularly important given that the e-Assessment tests would mark using set rules. In practice, practitioners sometimes make judgements based on their analyses, it was necessary when teaching novices to simplify things and to employ `rules of thumb' say for not trusting the parametric approach with ‘small’ sample sizes. For example, in Fig. 1 the rules used for the marking of the first e-Assessment are illustrated. Once these were decided upon, it was necessary that all members of the teaching team stick to this script as these are the rules that the e-Assessment marks to. In order to address points 3 & 4, multimedia materials were produced to give students access to good quality video and pdf “how-to” instructions for the generation of and interpretation of SPSS output. Further details are provided in Sections 2.2 and 2.3.
2.2 Teaching strategy
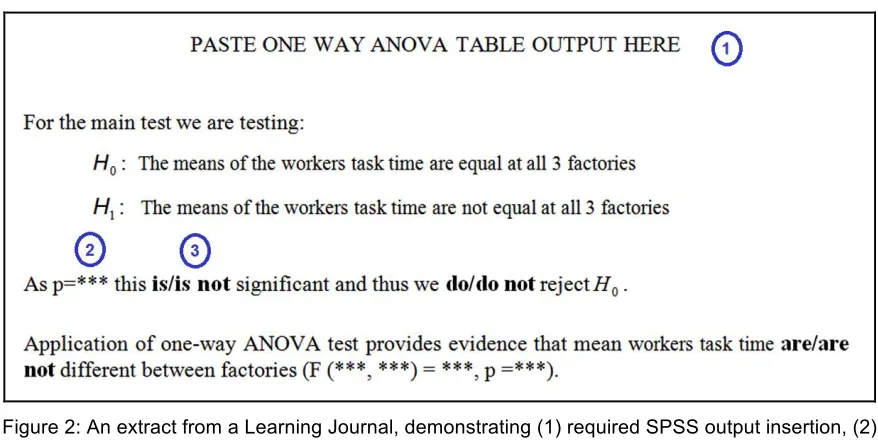
removed for the student to complete. An extract from a Learning Journal is shown in Fig. 2. Typically, each Learning Journal template was quite large, ranging from 5 to 16 pages in length. Each Learning Journal question was pre-prepared for the students, in that they had to paste in SPSS output where indicated, enter numeric values where they saw *** and make a selection where there was a choice in boldface. The advantage to this approach was that students would have access to a well-structured statistical report format, so could concentrate on statistical data creation and interpretation as opposed to spending time on the structure of the report. Also their completed Learning Journal would serve as a template for future investigations that they will be expected to carry out in their further studies. If, during the computer practicals, students required SPSS “button pushing” help, then they were directed to the available instruction pamphlets and videos. Knowing students had access to these self-help notes allowed staff to concentrate in the practicals on giving statistical understanding and interpretation advice as opposed to wasting time on the mechanics of producing SPSS output. These instructional videos and pamphlets are also embedded within the feedback of each e-Assessment.
Figure 1: Illustration of the flow of the analysis that needs to be performed on each data set for the first e-Assessment, together with the marking rules used. Note that the warning signs indicate potential
Figure 2: An extract from a Learning Journal, demonstrating (1) required SPSS output insertion, (2) numerical value extraction from SPSS output and (3) interpretation decisions of SPSS output.
2.3 E-Assessment
The e-Assessment system used was DEWIS as it can communicate with the R statistical package which was employed to generate bespoke student data and generate answers that would match SPSS screen output; implement continuation marking for a large number of inputs; run staged assessments; provide dynamic feedback specific to student inputs [6]. DEWIS is a fully algorithmic open-source e-Assessment system which was designed and developed at UWE. It is a completely stand-alone web based system used for both summative and formative assessments [7], [8]. It was primarily designed for numerate e-Assessments and is currently used in the fields of Business, Computer Science, Nursing, Engineering and Mathematics. This algorithmic approach enables the separate solution, marking and feedback algorithms to respond dynamically to a student's input and as such can perform intelligent marking [9], [10].
Two e-Assessments were used to test the material covered in weeks 1-5 and students were given two attempts at each e-Assessment. For each assessment attempt, students were given their own bespoke data set to work on. Apart from the final deadline date, students did not have a time limit to submit, so students were able to download their data directly into Excel, perform the necessary operation in SPSS before re-logging back into DEWIS to submit their answers.
2.3.1 Assessment 1 (ANOVA)
The first e-Assessment concerns the data dependent choice of the application of either the one-way ANOVA or Kruskal-Wallis test on a data set that comprises the run lives of three brands of batteries. The business scenario relates to the testing for a significant difference in the mean runlives of each of three brands with the aim of identifying whether there is clearly a brand that has the longest mean runlife. The basic statistical analysis tasks tested in this e-Assessment were the ability to transfer data from Excel to the required SPSS format, perform an exploratory data analysis for summary statistics, graphics and assumption testing; identification of appropriate statistical test (parametric or nonparametric equivalent), interpretation and reporting of test output. A diagram showing the flow of the analysis is shown in Fig. 1 where the warning symbols indicate potential danger points; not being able to correctly import the data into the required SPSS format (Warning 1) or being incorrect in their selection of test to be performed (Warning 2). The presence of these danger points prompted this e-Assessment to be run as a three-stage assessment as follows:
Stage 1: Importing the data from Excel to SPSS (Multiple submissions allowed). Stage 2: EDA and identifying the appropriate test (One submission allowed).
Students were allowed to attempt Stage 1 with their bespoke data set as many times as they wished, but they were not allowed to proceed to Stage 2 until they had successfully completed this stage. This ensured that students did not progress with the statistical analysis until they had successfully imported and manipulated their data set in SPSS. Without this check there would have been the possibility that none of their further analysis would have been correct, due to not correctly implementing this task. Similarly, if the incorrect parametric or nonparametric test was selected at the end of Stage 2 then the analysis of their data using this incorrect test in Stage 3 would be worthless. If the student selects the incorrect test at the end of Stage 2, this is corrected as they start Stage 3. DEWIS automatically keeps track of how each student is progressing through the e-Assessment and presents the student with the relevant stage when they log into the e-Assessment.
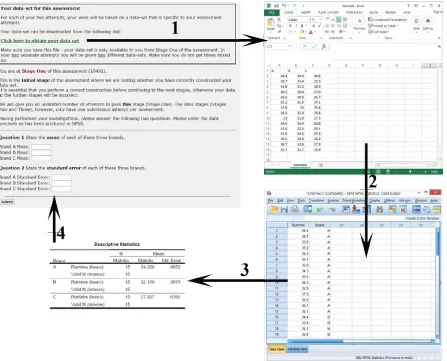
[image:5.595.75.522.275.636.2]The process flow for the Stage 1 activity is illustrated in Fig. 3. Students receive their bespoke data set from DEWIS in a three column format as an EXCEL file. The student then needs to manipulate the data into the two column format that SPSS requires. In order to make sure that the data is displayed to the same accuracy in the SPSS Data Viewer, the student should note the accuracy the data is recorded to and to enter the generated means and their standard errors for each of the three samples.
Figure 3: The activity process flow of Stage 1 of the first e-Assessment.
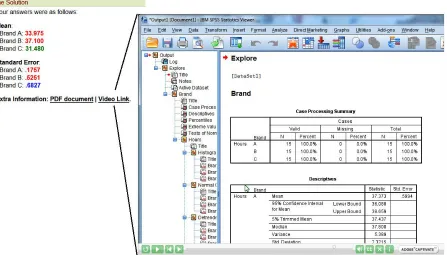
here, as it is important that students successfully complete this stage independently to guarantee that the data transfer to SPSS is successful; the colour coding response is aimed to help them achieve this. From the feedback page, students also have access to Extra Information which takes the form of a pdf document and video link which gives step by step instructions on how to achieve these tasks for a general data set, as shown in Fig. 4.
Figure 4: An example of the feedback from Stage 1 of the first e-Assessment. The right-hand side is a snapshot from the video that students may use to determine how to complete the process successfully
themselves. Note that the video concerns the same data scenario but with a generic data set.
Once students have passed the Stage 1 check, they are instructed to save the SPSS file and work solely with this file for the next two stages. Stage 2 involves EDA using output from the SPSS Explore command; this is where students get to know their data set through simple summary statistics and to consider the assumption of normality that the one-way ANOVA test requires. There are a total of 67 entries which are required for this stage, which take the form of numeric entry and drop down questions. A realisation of the final two questions asked in this stage is shown in Fig. 5. Students are only allowed to submit this stage once, but using the continuation feature on DEWIS, they may shut down their browser, without submitting their answers, and return to this stage at a later date if required. At the end of this stage students are asked which test should be employed for the main analysis. If a student chooses the wrong test they are told so in the feedback that DEWIS gives them and they are directed to Stage 3, in which they will be required to continue using the output from the correct test. This ensures that each student performs the correct test on their bespoke data set, despite possible earlier errors in analysis.
Figure 5: A realisation of the final two questions of Stage 2 of the e-Assessment concerning normality tests and subsequent choice of main analysis test, along with the relevant SPSS output and a boxplot of the data. Note that some numeric answers have been entered and drop down entries selected for
illustration purposes.
2.3.2 Assessment 2 (Regression)
The second assessment requires the student to perform a backwards elimination regression analysis to model the sales of a particular product using six potential explanatory variables. The analysis can be broken down into the following activities:
• Manipulating the data from the supplied Excel format to that required in SPSS;
• EDA of the data set;
• Initial regression model that containing all of the explanatory variables;
• Finding a parsimonious regression model using the Backwards elimination method;
• Obtaining sales predictions from the final model.
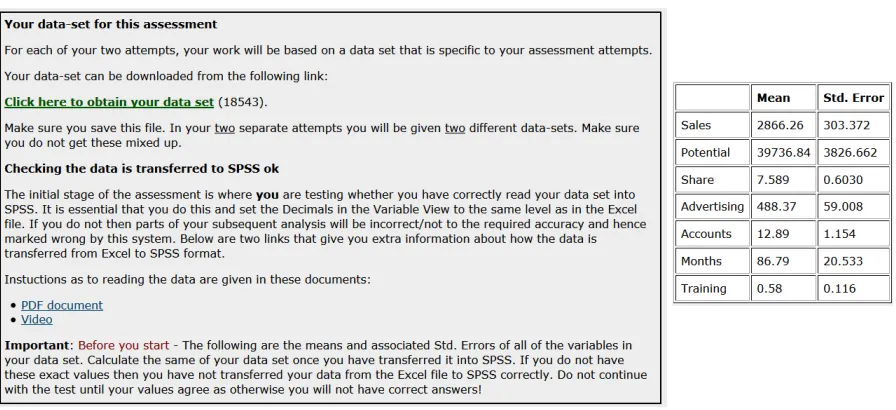
Unlike the analysis in the first e-Assessment, this analysis does not require the student to make any data dependent decisions on techniques to apply. Therefore, in this case, we decided there was not a need for implementing a staged assessment. However, in order to still make sure the transfer process for their bespoke data was correct, we reported the means and standard errors of all variables to the student and advised them not to proceed unless they had achieved exactly the same as shown to them from DEWIS (see Fig. 6). So the onus for checking the data transfer has been carried out correctly is passed to the student in this e-Assessment.
Figure 6: A snapshot of the instructions for checking that the data is transferred to SPSS correctly in assessment 2.
2.3.3 Feedback
Feedback for Stages 2 and 3 of the first e-Assessment and for the second e-Assessment is full and bespoke to the data set that the student worked with. Their submission is reproduced in its entirety, with the colour coding previously seen in Fig. 4, as well as the correct answers being supplied. An example of this is shown in Fig. 7 for Questions 13-15 of the second e-Assessment. Access to full and bespoke feedback is important because it has been found that students learn from e-Assessment feedback, using it to perfect their technical knowledge [11]. In addition, for each part question, students are able to access Extra Information in the form of a video of how to create the SPSS output and an Extra Information pdf document that interprets the output of a generic data set for the same problem they are analysing. This approach embeds immediate bite-sized formative materials within the e-Assessment at the point where the student is most curious and open to learning some aspect they have yet to master.
Figure 7: An example of the feedback provided for Questions 13-15 of the second e-Assessment. The correct answers, for the students bespoke data set, are provided on the left, together with links to Extra Information on each separate question. The students marked submission is shown on the right.
3 RESULTS
[image:8.595.78.517.471.648.2]analyses, with a lot more success than I believed possible at the beginning!" The module has run over two academic years. The resources were reviewed after the first year and improvements were made in light of our experiences, so we present data for only the 2014/15 academic year here. The results over the two e-Assessments have been excellent and remarkable similar (e-Assessment 1: ANOVA: M=90.6, SD=16.05; e-Assessment 2: Regression: M=87.6, SD=18.52).
We shall analyse the impact of using staging in the first e-Assessment by firstly considering how many submissions students needed in order to successfully proceed through Stage 1; that is to correctly re-format the data from Excel into SPSS and setting the correct number of decimal places required. Of the 752 students we found that 548 (72.9%) were able to correctly perform this task on their first attempt whilst 192 (25.5%) required more attempts to master this stage, with the highest value being 13. Additional feedback, in the form of pdf and video `how-to' instructions for a generic dataset, are available to students after submitting their answers to Stage 1, as shown in Fig. 4, and provided that students follow these instructions they should be able to progress. However we found that 12 students (1.6%) did not get through Stage 1, despite multiple attempts in some cases.
These results show that although the majority of students were able to pass through this stage on their first attempt, a significant number did not. This would have meant, had the first e-Assessment not been set up in this way, that students would have been performing analysis on an incorrectly set-up database and may have resulted in no marks being awarded for their resulting work.
We found that 11.1% students made the incorrect choice of test at the end of Stage 2 of the first e-Assessment and thus have benefited from DEWIS correcting their choice. This shows that this stage check is a highly desirable feature in involved statistical analysis e-Assessments.
All students were given the opportunity to have a second attempt at each e-Assessment with a different dataset. The final assessment mark was the higher of the two attempts. From Table 1 we can see that for both tests about 32% of students utilised the opportunity of a second attempt. It can be seen that there has been a sizeable increase in marks for both e-Assessments on the second attempt. This demonstrates that access to a wealth of feedback at the end of the first attempt has had a positive effect, thus the e-Assessment was formative as well as being summative.
Table 1: Summary statistics for those students that utilised the opportunity of a second attempt
e-Assessment Number of students
1st Attempt mark
2nd Attempt mark
Mean mark uplift (95% C.I.)
1: ANOVA 245 (32.5%) M=78.9 SD=21.88
M=92.4 SD=9.74
13.5 (11.1-15.9)
2: Regression 243 (32.3%) M=60.7 SD=31.36
M=81.6 SD=23.48
20.9 (17.2-24.6)
4 CONCLUSIONS AND DISCUSSION
Attendance at classes is not compulsory at UWE and as such no formal monitoring of student attendance takes place. Anecdotally it was reported from the module leader that the attendance for the six statistical computer practical sessions was noticeably higher than had been experienced for the other 18 weeks of the module. However it must be the case that not all students were able to attend every session, so the fact that the e-Assessment marks are high seems to indicate that students were able to use the resources produced to self-learn/reinforce their statistical skills. This certainly is true when looking at the data in Table 1, which shows a considerable uplift in mean mark on the second attempt of both e-Assessments.
One of the goals of the module was to equip students with the tools and knowledge to be able to perform statistical analyses of data that they would encounter in their level 3 project work. We plan to try and assess how well we have achieved this goal by following the progress of students through their academic journey and by running a questionnaire. We also plan to monitor the use of the Mathematics support drop-by station, espressoMaths [13], by these students to see how much additional support they require in their third year.
REFERENCES
[1] Finley, J., Tullis, J. and Benjamin, A. (2009) Metacognitive control of learning and remembering. In: Khine MS, Saleh IM, editors. New Science of Learning: Cognition, Computers and Collaboration in Education. Springer Science & Business Media; New York.
[2] Metcalfe, J. (2009) Metacognitive judgments and control of study. Current Directions in Psychological Science 18, pp.159–163.
[3] Kerr, M. and Payne, S. (1994). Learning to use a spreadsheet by doing and by watching. Interacting with Computers 6(1), pp.3-22.
[4] Sangwin, C. (2013). Computer Aided Assessment of Mathematics. Oxford University Press. [5] Baglin, J. and Da Costa, C. (2012). A theoretical framework for developing statistical package
competence as an outcome of statistical literacy. Proceedings of the International Association of Statistics Education (IASE) 2012 Roundtable Conference: Technology in Statistics Education: Virtualities and Realities.
[6] Gwynllyw, R., Weir, I. and Henderson, K. (2015). Using DEWIS and R for multi-staged statistics e-Assessments. Submitted to Teaching Mathematics and its Applications.
[7] DEWIS welcome page: http://www.cems.uwe.ac.uk/dewis (accessed 19/05/2015)
[8] Gwynllyw, R. and Henderson, K. (2009). DEWIS: a computer aided assessment system for mathematics and statistics. CETL-MSOR 2008 Conference Proceedings, pp. 38-44.
[9] Gwynllyw, R. and Henderson, K. (2012). Intelligent marking in summative e-assessments. Proceedings of the HEA STEM Learning and Teaching Conference.
[10] Walker, P., Gwynllyw, R. and Henderson, K. (2015). Diagnosing student errors in e-assessment questions. Accepted for publication in Teaching Mathematics and its Applications.
[11] Greenhow, M. and Gill, M. (2008). How effective is feedback in computer-aided assessments? Learning, Media and Technology 33(3), pp. 207-220.
[12] Statstutor: http://www.statstutor.ac.uk (accessed 20/05/2015)