Enhancing Cyber Situation Awareness for
Non-Expert Users using Visual Analytics
Philip A. Legg
Department of Computer Science and Creative Technologies Faculty of Environment and Technology
University of the West of England Bristol, UK
Abstract—Situation awareness is often described as the per-ception and comprehension of the current situation, and the projection of future status. Whilst this may be understood in an organisational cybersecurity context, there is a strong case to be made for effective cybersecurity situation awareness that is tailored to the needs of the Non-Expert User (NEU). Our online usage habits are rapidly evolving with smartphones and tablets being widely used to access resources online. In order for NEUs to remain safe online, there is a need to enhance awareness and understanding of cybersecurity concerns, such as how devices may be acting online, and what data is being shared between devices. In this paper, we explore the notion of personal situation awareness for NEUs. We conduct a small-scale study to understand how NEUs perceive cybersecurity. We also propose how visual analytics could be used to help encourage NEUs to actively monitor and observe their activity for greater online awareness. The guidance developed through the course of this work can help practitioners develop tools that could help NEUs better understand their online actions, with the aim to result in safer experiences when acting online.
I. INTRODUCTION
There is no doubt that the modern Internet has revolu-tionised how society interact today. Whether it be commu-nication with friends using social media, searching for local restaurants, buying a new home, or reading the daily news, the Internet now plays a significant role in many aspects of both our work lives and our personal lives. Usage habits have also drastically changed in recent years, with smartphones and tablets bringing about greater convenience for quickly accessing information whilst on the move. In the UK, Ofcom reported in August 2015 that smartphones had overtaken laptops as the number one device for Internet users, with two thirds of people now owning a smartphone and using this for nearly two hours every day to access the Internet [14]. As society begins to embrace the concept of the Internet of Things (IoT), we are moving to a state where more and more of our electronic devices will be communicating online.
[image:1.612.320.556.221.382.2]However, as Internet adoption continues to grow, so do the threats that are posed online. Symantec state in their Internet Security Threat Report 2015 that non-targeted attacks still make up the majority of malware and that in 2014 there were more than 317 million new pieces of malware created [20]. The report also states that ransomware has rapidly increased since the previous year, including the first piece of
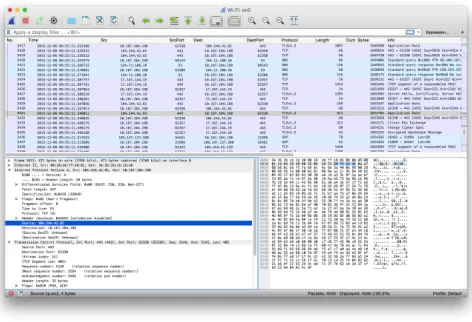
Fig. 1. Screenshot of the Wireshark Network Protocol Analyser. Whilst this provides an excellent tool for experienced security analysts, non-expert users may have difficulty in identifying activities of interest from the network traffic.
crypto-ransomware to infect an Android mobile device. Of particular interest, the report also flags that from a recent survey conducted by Norton, one in four people admitted that they did not know what they had agreed to give access to from their phone when downloading an application. With the increase of threats online, and the lack of awareness that many of those acting in cyber space have, there is a serious need to think about how we as researchers can help to alleviate this situation. One step towards this is to consider how users can observe and monitor their own personal cybersecurity. If users could see and explore their online activity data, it may help them make better informed decisions, and as a result, better protect themselves when acting online.
However, these tools often require experience and knowledge about low-level networking concepts, and are not designed with novice users as the intended audience. Similarly, the typ-ical security measures that NEUs may currently have in place - such as anti-virus and firewalls - do not allow for exploration of network communication activity between devices. There are a number of reasons why a NEU may wish to visualize their home network - for example, to identify devices that are using large amounts of data, or to identify changes in device behaviour which may imply that malicious software is being used. It could also help to reveal the transmission of personal or sensitive data, such as credit card numbers, passwords, geolocation, or phonebook contacts. Most importantly, the ability to visualize network activity and make sense from this would begin to empower a NEU, where previously they may have acted unaware of what data is shared across the network. In this way, the visualize can begin to educate NEUs on cybersecurity concerns, and allow them to be proactive about their own personal safety when acting online.
The work described in this paper makes the following contributions:
• We position cyber situation awareness in the context of non-expert users (NEUs). We argue the need for greater online awareness and protection for NEUs, which could be enhanced through self-monitoring of online activity. • We conduct a small-scale survey of NEUs to understand
their current perceptions of personal cyber security. • To support self-monitoring, we present a visual analytics
approach to cyber situation awareness, specifically de-signed for NEUs. We consider how this should differ from traditional security analysis, and how to engage NEUs to promote security awareness.
• We demonstrate a malware security case study, and show how the tool can help to identify and resolve this.
II. BACKGROUND
Within the field of security visualization, there has been much work that addresses the topic of network traffic visual-ization. The survey by Shiravi et al. presents different visu-alization techniques for understanding network security [18]. Dang and Dang also provide a survey on security visualization techniques for web information systems [5]. The work of Ball et al. describes a network visualization tool that is designed to be ‘home-centric’ [2], however this is still with the target audience of the security analysts in mind. From the education viewpoint, Schweitzer and Brown discuss how visu-alization can be used as a technique for teaching security [17]. The textbooks by Marty [11] and Conti [4] also illustrate a number of different techniques for how visualization can help better understand the problems that exist within security. More recently, works such as [8], [10], [3] have all addressed how expert security analysts can visualize network or user activity data in large organisation environments. There are many different commercial and open-source tools available online for monitoring and analysing network activity. It is almost overwhelming how many tools are available when
searching online, including Wireshark (Figure 1), tcpdump, Splunk, Cuckoo Sandbox, LiveAction, and SolarWinds Net-Flow Traffic Analyser. However, the majority of these tools are designed with technical users in mind. They may have complicated installation processes, or require a large amount of configuration to be able to use them. They do not cater for the needs of a NEU and are most often designed with organisation security analysts as the primary audience.
Looking more broadly at how visualization is currently used for NEUs, Fulda [6] considers information visualization for non-expert users, and how such techniques can be evaluated, such as by observation. Gough et al. [7] propose a set of guidelines for creative practitioners developing visualizations for Non-Expert Users, which we build upon for security analysis. Michel et al. [12] propose to use virtual worlds as a method for managing cyber situational awareness. They outline an experimentation of injecting anomalous activity into SecondLife and WoW, to observe whether participants can identify anomalous activity. However, they do not give their results, or divulge on their approach for visualizing such information or detecting such anomalies. Miller and Stasko developed a metaphorical visualization tool calledInfoCanvas
that can report on various data attributes such as number of unread e-mail, via a visual depiction [13]. Stasko et al. extend the work to explore how a user may customise their display to create Informative Art [19]. Pousman et al.
discuss Casual Information Visualization, which is the focus of InfoVis for the masses rather than only for bespoke or expert users [15]. Huang et al.present the topics of Personal Visualization and Personal Visual Analytics [9] - two areas within the visualization community that are begin to attract attention as individuals carry sensors such as mobile phones and accelerometers. Abdullah et al. describe a visualization framework for self-monitoring of web-based information dis-closure [1]. Van Kleek et al. propose Eyebrowse as a real-time web activity sharing and visualization tool [21], to help individuals better understand how they spend their time of the web. In recent years, society has become more data-driven, which has resulted in more engagement with interactive visualizations in online spaces. Therefore, the challenge of addressing NEUs is an interesting one given that society today is more familiar with interaction and visual representation techniques. We position our work with this, to find the appropriate balance between functionality and learnability for NEUs.
III. CYBERSITUATIONAWARENESS OF
NON-EXPERTUSERS
The ability to access information and resources online is now easier than ever. Smartphones and tablets have led the general public to be able to access information from wherever they may be, and so the Internet is no longer confined to traditional PCs. However, many users may have little or no knowledge of what their devices are doing ‘under the hood’ - such as what other devices they are communicating with, when they are communicating, and what data is being shared between them. It could be argued that the general user may not need, or may not care about how their device is acting - all they care about is being able to use it as and when required. However, as we continue to rely on technology it is important that users understand the cybersecurity concerns that are asso-ciated with Internet-enabled devices. As an example, observing that a device on your home network has unexpectedly started sending or receiving large volumes of data may well warrant a cause for concern.
For those tasked with analysing network activity, tools such as Wireshark provide a tabular view of network activity. For a novice user who is interested to explore network traffic, this list of activity may prove interesting, but not necessarily useful. For a novice user to identify periods of large traffic vol-ume, or which devices and connected at what time, the tabular format does not provide these answers well. In particular, the novice user may be interested to see how many connections are made by a particular device on their network. The vast amount of data that is involved with network packet capture makes understanding this a challenge, however the aim here is to alleviate this barrier to allow NEUs to begin to understand characteristics in their network activity.
To facilitate this research, we conducted a small-scale survey involving 24 participants to establish the views of NEUs on personal cyber security. In order to obtain the opinions of non-expert users, we randomly selected partic-ipants based on them choosing to use a library within a University Music department. We chose this setting since the library is predominantly used by Music students, and it was anticipated that these participants would use the Internet frequently, but would not have a technical background or have extensive knowledge on cybersecurity. The hypothesis that motivated the study was that NEUs are probably concerned about cybersecurity issues, and yet have very little awareness of how their devices communicate online. If the right kind of tools were available for better understanding device activity, NEUs may well be more inclined to take a more active role in their own cybersecurity.
[image:3.612.331.544.53.171.2]From the results gathered, 13 participants were male and 11 were female. 16 participants were aged between 18 and 21, and 8 were between 22 and 26. In response to“How would you rate your technology skill level?”, 17 identified themselves as intermediate, and 5 said that they were advanced. Some chose not to declare for this question. With regards to cybersecurity, 15 participants (63%) stated that they were concerned about
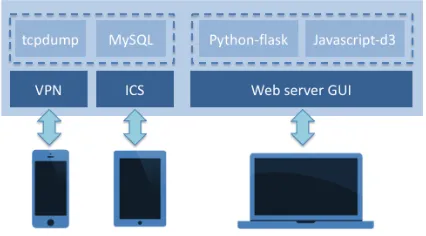
Fig. 2. Overview of the ePSA framework. Internet Connection Sharing (ICS) and Virtual Private Network (VPN) allows users to connect to the Internet. On these connections, tcpdump and MySQL capture and store packet data respectively. The web server provides a GUI, that utilises Python-flask and Javascript-d3 for the analysis and visualization of network activity data.
their cybersecurity when accessing the Internet, 8 participants (33%) stated that they were aware of the information that their laptop/desktop communicates online, and 6 participants (25%) stated that they were aware of the information that their smartphone/tablet communicates online.
Participants were then asked whether they use any secu-rity tools when they access the Internet, either from their traditional PC or from their smartphone/tablet. Of the 24 respondents, only 4 reported that they use any tools on their smartphone/tablet (two use an antivirus tool, and two use a VPN). For their laptop/desktop security, 16 participants reported using an anti-virus tool, and 12 participants reported using a firewall. When asked“What do you perceive as your greatest security concern when you are online?”, most par-ticipants mentioned online banking as their primary concern. Other responses given by participants include spam e-mails, data fraud, identity fraud, and malicious hyperlinks.
From the responses given, none of the participants currently monitor or analyse their Internet activity. The participants make use of Internet resources on average for 6.68 hours a day, mostly using laptops (79%) or smartphones (17%). 13 participants stated that they wish they could monitor their Internet activity (with 6 providing a ‘don’t know’ response). 21 participants stated that they thought visualization could be useful for identifying potential threats (with 3 providing a ‘don’t know’ response).
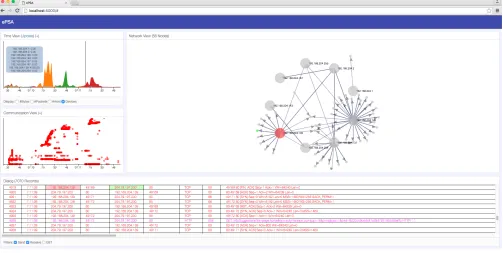
Fig. 3. Full view of the ePSA web-based user interface. There are three primary views: timeline view, communication view, and network view. A dialog view is also available that provides detail. Each view can be minimised if not desired, and layout is configurable for preferred layout (e.g., on a smartphone). All views are linked via interaction techniques. In this example, the user hovering on the timeline shows the timebar, highlights the corresponding row in the dialog view, and highlights the corresponding source (red) and destination (green) nodes in the network view.
IV. DEVELOPINGCYBERSITUATIONAWARENESSTOOLS FORNON-EXPERTUSERS
From our small-scale survey, it became apparent that NEUs may be inclined to take an active role in understanding cybersecurity if appropriate tools were available to better understand their cyber activity. In this section, we describe the process of developing an initial prototype tool that we call ePSA (Enhanced Personal Situation Awareness) for collecting, monitoring, and visualizing device activity. The prototype consists of two main components: the first is responsible for the collecting and storage of network activity, and the second is responsible for the analysis and visualization of network activity.
A. Data collection and storage
Figure 2 shows an overview of the ePSA framework. Devices connect to the service that runs on a dedicated workstation using either a Virtual Private Network (VPN) or by Internet Connection Sharing (ICS). By using ICS, the system will broadcast a wireless network, much like the wireless network from the main home router. The VPN option extends upon this to support monitoring of activity on smart devices whilst away from the home. The collection of network traffic is performed using the tcpdump command line tool. A simple python script is used to manage the continual execution of tcpdump and to store the packet data (packet number, timestamp, source IP, source port, destination IP, destination port, protocol, packet size, and summary information) into
a MySQL database. The full packet capture can be stored to support deeper packet investigation, however for many NEUs this would be outside the scope of their usage. The system has been designed to be able to run continuously, with minimal requirements on available memory or CPU usage so that this can be left running on a home computer. The graphical user interface is provided by a web server, based on python-flask and javascript-d3. By using this configuration, the visualization tool can be accessed by smartphone, tablet or PC, and similarly, the packet capture can be performed for any Internet-enabled device in real-time.
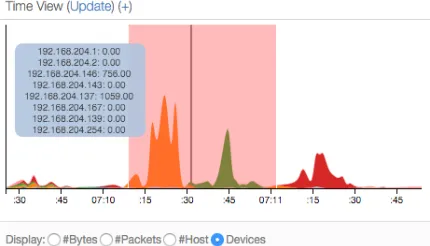
Fig. 4. Timeline View. We use a streamgraph to show the amount of activity on each device. This reveals that of 8 local IP addresses, there are 3 devices that are responsible for the majority of the activity (shown by the orange, green, and red peaks). We have brushed a particular time period to drill down, show by the translucent red highlight. The black line shows the selected time point, and the blue overlay shows the corresponding values at that time.
B. Data visualization and analysis
Visualization is playing an increasingly-important role in our society when it comes to analysing and understanding large volumes of data. Here, we focus on how visual analytics can be utilised to allow NEUs to engage and interact with network data related to their Internet-enabled devices. By visualizing and interacting with network activity data, users may begin to discern how, and what, their devices are com-municating online. In doing so, the objective is to promote cyber security and cyber situation awareness for NEUs so that they become more vigilant of threats when acting online.
Figure 3 shows the main ePSA user interface. We purposely adopt visual components that are believed to be relatively simple and clear to understand so as to avoid overloading the user. The three main visuals are the timeline view, the communication view, and the network view. In addition, the dialog view at the bottom provides detail of the raw activity data. This level of detail is possibly out of scope for many NEUs to engage with initially. However, by using a linked view approach with the visualizations, the detail can be filtered based on users selections and interactions. In this fashion, we believe that this can help to facilitate the understanding of network activity for those users who may be interested to know more detail. In addition, by using a window-based GUI, views can be minimised or repositioned so that the user is presented only with the level of detail that they are interested in. Likewise, the GUI is designed to be responsive for smartphone and tablet displays so that the GUI fits the screen size appropriately. We choose not to hide any views from the user, but instead allow them to choose what they wish to see and how their wish for this to be laid out. As they become more familiar and confident in using such a tool, they may find that more detailed views are useful in conjunction with the visualizations.
[image:5.612.67.282.55.178.2]Figure 4 shows the timeline view from the main interface. This serves as a the main starting point for exploration and analysis, by providing an overview of activity on a timeline.
Fig. 5. Communication View. This shows source and destination devices for a particular time period. Each row of the scatterplot is a distinct IP address. When the user selects a device (red), all destination hosts are revealed (blue). Opacity relates to the volume of traffic at a given time. Patterns can be seen such as single points of contact, or when communications begin with a particular host.
The visualization is based on a streamgraph, which presents a stacked area chart, across a period of time. The visualization is designed to show the count data, such as bytes sent/received, packets sent/received, number of hosts currently connected, or the volume of traffic for each device connected. In the view shown in Figure 4, each colour represents a local device, and the area denotes the amount of traffic at a given time. Here, we see quite clearly that there are three main devices on the network (shown by the orange, green and red areas). The user can hover over the timeline to obtain details for a particular moment in time, or the user can filter a particular time period (shown by the pale red region) which then updates the other views accordingly. In this fashion, the view provides a clear overview of activity, and a means to filter the data to a particular period of interest based on some characteristic (e.g., volume of traffic from a particular device).
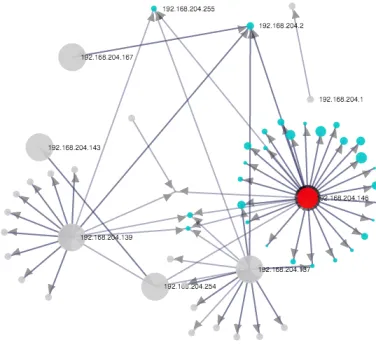
Fig. 6. Network View. We use a fixed ring layout for local devices, with a dynamic force layout on all other nodes (i.e., external hosts). The red node has been selected for investigation due to the large number of connected hosts. When selected, destination nodes are highlighted in cyan.
Figure 6 shows the interactive network view. A semi-force-directed layout is utilised, where local devices (i.e., devices that IP addresses are in the range 192.168.*.*) are fixed in a radial layout and represented by a large node in the graph. Smaller nodes are indicative of all other (typically external, or specialist) IP addresses. Compared to a traditional force-directed approach, this provides clearer indication of what nodes are of particular interest which would be highly beneficial for NEUs. Here, it becomes clear to see that there are three nodes of particular interest that generate most activity on the network, shown by the connections to smaller nodes that are in proximity of the larger nodes. This reinforces what was seen from the streamgraph timeline, however now we can also see additional information such as commonalities between the three devices (i.e., nodes that all three devices connect to). Users can interact with the view to help enhance their understanding - including typical drag and selection techniques. When the mouse is positioned over a particular node (like the red node shown), the destination nodes are shown in blue. We also incorporate a logarithmic-scale for the destination nodes, which can be mapped to different attributes. In this example, the node scaling shows a relative view of the amount of communication between the selected node and each destination, which allows nodes with high traffic to be easily identified.
Filters can be easily incorporated to search the packet details and reduce the complexity of each linked visualization. We also provide common filters as default checkboxes that the user can toggle on or off. An example of this is a GET filter, that simply identifies traffic that states ‘GET’ in the information tag. Whilst simple, it effectively filters all traffic except that of file resource requests for loading web content, making it a powerful tool for more informative investigation. Figure 7 shows the network view with the GET filter applied. In addition, since we would expect this to relate to HTTP
Fig. 7. Network View with the GET filter applied. This reveals the three main local devices, and the hosts that web content was downloaded from. The filter can also be used to reveal anomalous activity. Here, size is mapped to anomalous port activity. The large cyan node communicated over port 27800, compared against other GET traffic that used port 80. The dialog view shows five packets that reveal this as the source of the malicious software.
traffic on port 80, we can employ an anomaly detection routine with the filter to identify deviation from this expectation. The scaling of the destination nodes represents the amount of anomalous traffic based on the expectation of the filter. We can see one particular node that appears larger than the others. With this filter applied, an obfuscated URL becomes clear in the dialog view (which was the source of the malware), which is then followed by a number of files being downloaded on port 27800. Of course, we can not expect a NEU to identify this purely from the traffic data in the detail view alone. However, with the support of the visualizations to obtain an overview of the activity, along with the linked interaction between the different views, the ability to filter in on potentially interesting activity becomes much easier to achieve. The visualizations and interactions are designed to be simple yet intuitive for representing, and analysing, the underlying data, which can potentially help encourage users to engage with such tools, and help to promote their awareness of such activity.
V. DISCUSSION
we have identified over the course of this work, and consider how this work may be developed further.
A. Visualization
With regards to the visualization designs, we have made a conscious effort to use relatively simple and clear techniques for illustrating network activity. This is primarily to avoid the issue of overloading for NEUs, which would instinctively discourage users from engaging with the system. There is debate over the effective use of network graph visualizations, since these can become unmanageable when there are a large number of nodes and connections. To alleviate this, we have used filtering of the timeline, and also incorporated the semi-fixed radial layout of local devices. Other approaches such as a matrix view can be useful to show corresponding source and destinations for large volumes of data, however we believe the abstract nature of these does not fit well for supporting a NEU. It may be that as a user becomes more familiar and more confident, then the tool could support a variety of representations and interactions.
One possible extension to the current work is to consider how different visualisation forms could be used to represent Internet activity. In this initial prototype we choose a clear, yet functional, approach that provides a good starting point. Other ideas may include metaphorical visualizations, such as cityscapes and other human environments (e.g., gardens). In addition, by integrating anomaly detection techniques, the visualization could alter based on this deviation, so that they user can identify that something requires investigation. Although we have considered this approach, one challenge for a NEU is that the mapping becomes more complex between the data and the visual representation. It may also obscure the original data so that analysis of the situation becomes much more difficult to perform. In the future, we would like to extend our preliminary survey to a larger user study, that would examine the use of personal network activity visualization by NEUs, to see whether seeing their own network activity helps to enhance their online awareness.
B. User engagement
Another important challenges associated with this work is how we encourage NEUs to engage and analyse their online activity. From our small-scale survey, whilst most felt that visualization would help to identify threats, only 54% of participants wish that they could monitor their own Internet activity. In some way this is unsurprising - people want to access the information they are looking for online, rather than being burden with information about how they accessed this. However, it is important that if they should want to, or need to, understand what is happening at the network level that they are able to do this and do not believe that such capability is out of their reach.
In addition to this, many NEUs may believe that cyber-security is something that they should not need to actively monitor, and that automated tools should be designed to do this for them. As our survey showed, many are familiar with
anti-virus and firewall products for their desktops/laptops, but not for their smartphones and tablets. We acknowledge that users are not necessarily going to, or expected to, constantly monitor their activity in this fashion. We would argue however, that should there be reason to do so, that users should have simple and intuitive tools available to support them rather than having to rely on expert users. In particular, as the Internet of Things continues to evolve and we have more and more devices on our home networks, it may become more crucial to support this form of home monitoring. This work represents the early stages of how to support NEUs with understanding cybersecurity. In the future, we would like to incorporate more sophisticated tools based around machine learning, such as multiple anomaly detectors that can provide clear reports for the user of what has been detected and what action they should take. We would also look to integrate firewall configurations that can check traffic before it reaches the user endpoint, to provide a more complete solution for home network monitoring. In addition, we would also like to explore how user intent can be captured so as to characterise typical behaviour, which may further help for identifying unexpected anomalous activity. Currently, the visualizations only report on the network activity, but do not provide much contextual information for the user, which would help enhance their awareness further.
To support the research of visual analytics for cy-ber situation awareness further, we intend to release our software tools online as open source (please visit http://www.plegg.me.uk for more details). In doing so, we hope that users and organisations will use the tool to visualize their own networks, to obtain greater ‘network cognisance’. Despite the primary target audience being NEUs, there is clear potential for organisations to benefit from better approaches for visualizing their network activity. We hope that in the future we can extend this work based on input from individuals and from organisations, to see how this can be utilised for better network understanding and defence, whilst also maintaining a clear and comprehendible view of the underlying network complexity. We would anticipate that many security professionals could utilise our software in collaboration with existing security tools. In particular, the dialog view links with Wireshark so that our tool can support exploration and filtering, and Wireshark could then be used for deep packet investigation.
VI. CONCLUSION
differently to what the user may expect, such as sending or receiving large volumes of traffic, or communicating with new hosts that are unexpected. We believe that the ability to visualize network activity helps to promote awareness of how and when devices are communicating, and what information they may be sharing, which can help NEUs to take appropriate steps towards improving their cybersecurity. Whilst we have primarily addressed NEUs in this work, we believe that better approaches for visualization of network activity would be highly beneficial in many organisational contexts to provide clearer understanding of online activities. This becomes increasingly valuable as more and more devices are being utilised on corporate networks.
It is clear that online activity is becoming more and more present in our everyday activity, as smartphones and tablet computer continue to outweigh traditional PCs for online access. With the Internet of Things becoming more prominent, it will soon become even more important to understand the activity of our Internet-enabled devices within our households and our organisations to ensure that only permitted information is being shared. Online threats are constantly evolving and are not confined to traditional attacks such as viruses, so there is a real need to help both NEUs and industry to enhance their understanding of how devices communicate online. By providing a clear and intuitive representation of our online activities, we can help all users of cyberspace to enhance their personal situation awareness.
ACKNOWLEDGEMENTS
Thank you to the Faculty of Music (University of Oxford), for facilitating the small-scale survey. This work was funded by the University of the West of England VCECR award.
REFERENCES
[1] K. Abdullah, G. Conti, and R. Beyah. A visualization framework for self-monitoring of web-based information disclosure. In Communica-tions, 2008. ICC ’08. IEEE International Conference on, pages 1700– 1707, May 2008.
[2] R. Ball, G. A. Fink, and C. North. Home-centric visualization of network traffic for security administration. In Proceedings of the 2004 ACM Workshop on Visualization and Data Mining for Computer Security, VizSEC/DMSEC ’04, pages 55–64, New York, NY, USA, 2004. ACM. [3] B. Cappers and J. van Wijk. SNAPS: Semantic network traffic analysis through projection and selection. In Visualization for Cyber Security (VizSec), 2015 IEEE Symposium on, pages 1–8, Oct 2015.
[4] G. Conti.Security Data Visualization. No Starch Press, 1 edition, 2007. [5] T. K. Dang and T. T. Dang. A survey on security visualization techniques for web information systems.International Journal of Web Information Systems, 9(1):6–31, 2013.
[6] J. Fulda. Interactive non-expert information visualizations and their evaluation beyond time and error. In Media Informatics Advanced Seminar ‘Special Aspects of Usability’, 2014.
[7] P. Gough, C. d. B. Wall, and T. Bednarz. Affective and effective visualisation: Communicating science to non-expert users. In Visualiza-tion Symposium (PacificVis), 2014 IEEE Pacific, pages 335–339, March 2014.
[8] C. Gray, P. Ritsos, and J. Roberts. Contextual network navigation to provide situational awareness for network administrators. In Visualiza-tion for Cyber Security (VizSec), 2015 IEEE Symposium on, pages 1–8, Oct 2015.
[9] D. Huang, M. Tory, B. Aseniero, L. Bartram, S. Bateman, S. Carpendale, A. Tang, and R. Woodbury. Personal visualization and personal visual analytics.Visualization and Computer Graphics, IEEE Transactions on, 21(3):420–433, March 2015.
[10] P. Legg. Visualizing the insider threat: challenges and tools for identifying malicious user activity. InVisualization for Cyber Security (VizSec), 2015 IEEE Symposium on, pages 1–7, Oct 2015.
[11] R. Marty.Applied Security Visualization. Addison-Wesley Professional, 1st edition, 2008.
[12] M. Michel, N. Helmick, and L. Mayron. Cognitive cyber situational awareness using virtual worlds. In Cognitive Methods in Situation Awareness and Decision Support (CogSIMA), 2011 IEEE First Inter-national Multi-Disciplinary Conference on, pages 179–182, Feb 2011. [13] T. Miller and J. Stasko. Infocanvas: A highly personalized, elegant
awareness display. In Proceedings of the Working Conference on Advanced Visual Interfaces (AVI 2002), pages 43–50, 2002.
[14] Ofcom. The UK is now a smartphone society. http://media.ofcom.org. uk/news/2015/cmr-uk-2015/, 2015.
[15] Z. Pousman, J. Stasko, and M. Mateas. Casual information visualization: Depictions of data in everyday life. Visualization and Computer Graphics, IEEE Transactions on, 13(6):1145–1152, Nov. 2007. [16] A. Rao, A. Kakhi, A. Razaghpanah, A. Li, D. Choffnes, A. Legout,
A. Mislove, and P. Gill. Meddle: Enabling transparency and control for mobile internet traffic. Technology Science, 2015.
[17] D. Schweitzer and W. Brown. Using visualization to teach security.
Journal of Computing Sciences in Colleges, 24(5):143–150, May 2009. [18] H. Shiravi, A. Shiravi, and A. Ghorbani. A survey of visualization systems for network security. Visualization and Computer Graphics, IEEE Transactions on, 18(8):1313–1329, Aug 2012.
[19] J. Stasko, T. Miller, Z. Pousman, C. Plaue, and O. Ullah. Personalized peripheral information awareness through information art. In N. Davies, E. D. Mynatt, and I. Siio, editors,UbiComp 2004: Ubiquitous Comput-ing, volume 3205 ofLecture Notes in Computer Science, pages 18–35. Springer Berlin Heidelberg, 2004.
[20] Symantec. Internet security threat report 2015. http://www.symantec. com/security response/publications/threatreport.jsp, 2015.