Fluorescence microscopy methods for the determination
of somatic cell count in raw cow’s milk
P. Zajac
1, S. Zubricka
1, J. Capla
2, L. Zelenakova
2 1Veterinary and Food Institute Bratislava, Bratislava, Slovak Republic 2Slovak Agriculture University in Nitra, Nitra, Slovak RepublicABSTRACT: The direct fluorescence microscopy method with ethidium bromide staining can be used for somatic cell counting in raw cow’s milk. However, this method has some limitations that may influence the results of the analysis. We therefore aimed at improving the procedure of somatic cell nuclei staining. We tested the hypothesis that ethidium bromide can better penetrate into the DNA of cells with degraded somatic cell walls or into dead cells. Therefore, we increased the temperature of the sample to 100 °C in order to disrupt the somatic cell wall membrane and to improve ethidium bromide penetration to somatic cell nuclei. In all, 90 samples of raw cow’s milk were analysed in this experiment. Three parallel measurements were performed using each of the microscopic methods and the routine flow cytometry method. In all, 810 microscopic smears were analysed. The somatic cells were counted using fluorescence microscopic methods and flow cytometry. The increased temperature during the sample preparation improved (P < 0.005) the penetration of ethidium bromide into the somatic cell nuclei. It is concluded that the direct fluorescence microscopy method is suitable for precise laboratory analysis of somatic cell in raw cow’s milk.
Keywords: microscopy; cow milk; fluorescence; flow cytometry; temperature; somatic cell; wall; temperature; DMSCC
Mastitis is an inflammatory disease of the mam-mary gland (Pyorala 2003) caused mainly by patho-genic microorganisms (Vasil et al. 2012; Cervinkova et al. 2013; Alekish 2015). A significant relationship can be expected between bulk tank milk somatic cell counts (SCC) and the number of mastitis patho-genic microorganisms in raw cow milk (Rysanek et al. 2007). Determination of somatic cells (SC) in raw cow milk can be used to diagnose mammary gland health and the prevalence of clinical and subclini-cal mastitis in dairy herds (Idriss et al. 2013). Milk SCC is a key component of European Union regu-lations for milk hygiene. Food business operators must initiate procedures to ensure that raw cow milk does not exceed a limit of less than or equal to 400 000 SCC/ml calculated as a rolling geometric average over a three-month period, with at least one sample per month (Commission regulation EC No. 1662/2006). Accurate SCC results can be obtained only using laboratory diagnostic methods. In com-mon laboratory practice, an instrumental
stain solution. The staining of cells was performed by dipping the microscopic slide with a fixed smear into the staining solution containing EtBr. The new version of the ISO 13366-1 (2008) staining proce-dure is based on mixing the staining solution with milk in the reagent tube at a temperature of 50 °C. We set out to determine whether we could improve this staining procedure in order to optimise the pen-etration of EtBr into SCC nuclei. We have tested the following hypothesis: can EtBr better penetrate into the DNA of cells with degraded somatic cell walls or into dead cells? This effect can be achieved with a detergent such as Triton X-100 that causes creation of pores in the cell wall. We have used a combination of Triton X-100 and a temperature of 100 °C during the sample preparation and tested the effectiveness of EtBr penetration and DNA staining of SC nuclei.
Practical experiences with the fluorescence mi-croscopy method, based on SC nuclei staining with EtBr in milk are not adequately described in the sci-entific literature and most of the European Union national reference laboratories for milk and milk products are still using the method based on meth-ylene blue staining with the Newman-Lampert stain solution. In this work, we describe our prac-tical experience of SC nuclei staining with EtBr and the fluorescence microscopy technique.
MATeRiAl And MeThodS
Samples. The tested materials included raw cow milk samples obtained from individual cows. Sampling was performed according to the ISO 707 (2008). Selection of suitable cows ensured milk samples with different concentrations of SC (from 54 000 to 895 000 SC/ml). Samples were analysed at the State Veterinary and Food Institute in Bratislava in the National Reference Laboratory for Milk and Milk Products. The laboratory is accredited accord-ing to standard ISO 17025 (2005). In all, 90 samples of raw cow milk were analysed in this experiment. Three parallel measurements were performed using each of the microscopic methods and the routine flow cytometry method. In all, 810 microscopic smears were analysed.
laboratory methods. We used three micro-scopic methods and a flow cytometry method in this experiment.
Method A: ISO 13366-1 (1997) Microscopic method (old reference method), staining by dipping
the microscopic plate with smear into modified Newman-Lampert stain solution (Levowitz-Weber modification) containing chemicals like ethanol, tetrachlorethane, acetic acid glacial; instead of methylene blue, EtBr was used.
Method B: ISO 13366-1 (2008) Microscopic method (reference method) staining with EtBr. This standard was corrected with ISO 13366-1:2008/ Cor 1 (2009). The principle of staining with EtBr is based on Vermunt et al. (1995). We made some modifications of this method. We changed the tem-perature of the milk during heating in the reagent tube from 50 °C to 100 °C, followed by the addition of EtBr stain solution and staining for one minute with simultaneous gently mixing. Subsequently, the sample was cooled to 20 °C and spread over the microscopic slide. The EtBr stain working solu-tion was diluted with demineralised water (1 : 9). A calibrated automatic pipette Finpipette 10 μl was used instead of a microsyringe.
Method C: Flow cytometry. ISO 13366-2 (2006), we used the Fossomatic 5000 flow cytometer (rou-tine method).
Method D: ISO 13366-1 (2008) Microscopic method (reference method) staining with EtBr in the reagent tube at a temperature of 50 °C.
instruments and equipment. The following in-struments were used for this experiment: Olympus BX51 fluorescence microscope, WH10x/22 eye-piece, Olympus UPlanFI 60x/125 Oil Iris objec-tive, USH-1030L lamp, fluorescence illuminator with U-25ND25, U-25ND6, NB (blue light) and NG (green light) filters, (Olympus SK, s.r.o., Bratislava, Slovakia), flow cytometer – Fossomatic 5000 (Milcom Servis a.s., Prague, Czech Republic), au-tomatic pipette Finpipette – 10 μl, microsyringe – 10 μl, laboratory glass, extractor hood, Stuart vortex mixer (Stuart, Staffordshire, UK), micro-scopic slides with pre-marked area of 20 mm × 5 mm (Tekdon, Myakka City, Florida, USA), heat plate (40 °C), and a calibrated micrometre.
Chemicals and solutions. All reagents were used according to ISO 13366-1 (1997; ISO 13366-1, 2008) and were of recognised analytical grade or better.
Preparation of solutions for Method A: We fol-lowed the procedure described in ISO 13366-1 (1997).
Method B: Sample preparation: Fresh cow’s milk was thoroughly and gently mixed by inverting the samples up and down several times (samples with a fat layer on top were heated to a temperature of 40 °C ± 2 °C and mixed for homogenous distribu-tion of fat in the sample).
Working procedure: For the experiment, 1 ml of sample was added to a reagent tube (reagent tube was made of Pyrex and was heat stable). We gently held the reagent tube with a thumb and forefinger and then heated the tube over the burner in a direct flame to a temperature of 100 °C. When the mixture began to boil, the reagent tube was immediately re-moved from the flame (it is important to prevent the sample from boiling over out of the reagent tube). Immediately, 1 ml of EtBr working stain solution was added and the sample was vortexed for 1 min. Next, the sample was cooled in a refrigerator to a temperature of 20 °C (the micropipette and microsy-ringe were also calibrated to this temperature). Using the micropipette 0.01 ml of the prepared test sample was taken. It is advisable to pay attention to the foam which may occur; the tip of the micropipette has to be submerged in the milk to prevent suction of the air from the foam. The outside of the tip that had been in contact with the sample, should be carefully and gently cleaned with paper towel. Then, the test portion was placed on a clean microscopic slide with a pre-marked area of 20 mm × 5 mm (1 cm2). Using
the tip or needle, the test portion was spread over the entire defined area of the slide to form a compact smear (by holding the pipette like a pen and putting the elbow and wrist on the table for better work). Then, the smear was dried at room temperature until it was completely dry.
Reading optimisation: Using the fluorescence microscope, the cell nuclei in the obtained smears were counted. We used fluorescence light with a wavelength of 450 nm (blue light), eyepiece magni-fication of × 10, and an objective of × 60. Immersion oil was used for counting the SC nuclei in the smear. Generally, cells in milk are distributed according to a Poisson distribution and the minimum number of cells to be counted in relation to the cell count level is less than 150 × 103 SC/ml, n = 100; 150 to 250 ×
103 SC/ml, n = 200; 250–400 × 103 SC/ml, n = 300,
greater than or equal to 400 × 103 SC/ml, n = 400.
Counting in successive fields: The nuclei were counted in successive fields in vertical strips in regularly spaced fields, following the instructions in ISO 13366-1 (2008). SC nuclei should be
count-ed only if they are evidently distinguishable and if more than 50% of the nuclear material is visible.
Calculation and expression of results: The length and width of the smear were checked against the 20 mm and 5 mm target values by using the gradu-ations and vernier of the microscope. The total con-centration (c) of cells was calculated by using one of the equations in ISO 13366-1 (2008). We used this equation:
where:
c = total concentration, expressed in the number of cells/ml Ws = width (mm) of the smear
Ls = length (mm) of the smear Nt = total number of cells counted
Df = diameter (mm) of the microscope field Nf = number of fields counted completely Vm = volume (ml) of the sample smeared
If the EtBr working stain solution is used for staining, Vm = 0.005 ml. Expression of results: the test results were expressed in whole figures of thou-sands per ml.
Method C: We followed the procedure described in the operational manual of the Fossomatic 5000 instrument and the instructions from ISO 13366-2 (2006). The instrument was calibrated with cali-bration samples from Actalia – Cecalait (Poligny, France) and was regularly tested in interlaboratory ring tests organised by this laboratory.
Method D: We followed the procedure described in the ISO 13366-1 (2008) microscopic method (reference method) with EtBr staining. Calculation of results was performed according to the same equation presented described for Method B.
Statistical analysis. For the evaluation of the re-sults a two-factor analysis of variance (ANOVA) without interactions was used. Calculations were performed using the professional statistical soft-ware Statistica 7 CZ (StatSoft CR s.r.o., Prague, Czech Republic). We used a standard main effect ANOVA. For multiple comparisons of methods, Tukey’s test and Sheffe’s test were used.
ReSulTS
The average results of the SCC determination in raw cow’s milk using Methods A, B, C and D
c = 2
×1
are presented in Table 1. The descriptive statistics and confidence intervals for the mean SCC values are presented in Table 2. In Figure 1, the 95% con-fidence intervals are presented for different types of methods. There are significant differences (P < 0.005) between the results of all methods: A, B, C and D. In Figures 2–9, images of the microscopic preparations are presented.
The results obtained using Method A were higher by 11 000 SC/ml in comparison with results us-ing Method B, and in comparison to Method C, these results were higher by 22 000 SC/ml. The
re-sults using Method B were higher by 10 000 SC/ml in comparison with the results of Method C and higher by 46 000 SC/ml in comparison with re-sults of Method D. The statistically determined differences between Methods A–B, B–C and A–C did not exceed 42 000 SC/ml, representing a re-peatability value associated with the Fossomatic 5000 instruments (Method C) at a concentration of 300 000 SC/ml. Also, the inter-laboratory repro-ducibility value SR 41 000 SC/ml at a concentra-tion of 245 000 SC/ml, according to ISO 13366-1 (2008), was fulfilled. Thus, in light of the above, both microscopic Methods A and B can be used in laboratory practice. The results of Method D were significantly (P < 0.005) lower than results for Methods A, B and C.
diSCuSSion
The working procedure for smear preparation using Method A was considerably more difficult in comparison with Method B and needs very precise work. It is necessary to use only calibrated micropi-pettes or microsyringes. We had better experience using micropipettes despite the fact that in gen-eral, microsyringes are preferred, as described by Ubben (2004). For better accuracy of the work, it is important to use microscopic slides with fixed pre-marked areas or templates of a defined size, which have to be checked by micrometre (ISO 13366-1, 2008). In comparison to microscopic slides with-out pre-marked areas, more precise results are
[image:4.595.64.290.96.273.2]Figure 1. Comparison of Methods A, B, C and D. In this figure, the mean values of SCC/ml for Methods A, B, C and D with 95% confidence bands are presented
[image:4.595.306.532.542.712.2]Average of set of results, current effect: F3,267 = 555.66, P < 0.001
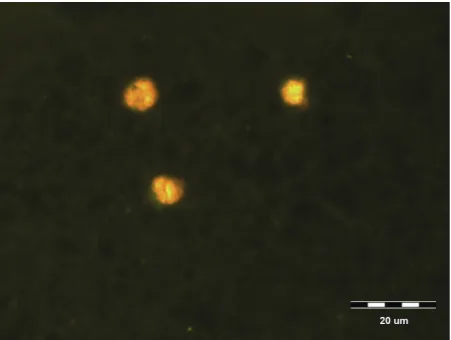
Figure 3. Method A, golden yellow fluorescing nuclei of SC, dark olive green coloured background,
magnifica-tion Í 600
Figure 2. Method A, golden yellow fluorescing nuclei of SC, dark olive green coloured background, smear was prepared
from cow milk with 600 000 SC/ml, magnification Í 600
350 000
345 000 340 000 335 000 330 000 325 000 320 000 315 000 310 000 305 000 300 000 295 000 290 000 285 000 280 000
SC
C/ml
[image:4.595.65.290.542.711.2]Table 1. Mean results of SCC, as determined using microscopy methods A, B, D and flow cytometer C in raw cow milk samples. Results of Methods A, B and D are the mean results of three parallel-determined smears. Results of Method C are the mean results of six parallels results
Sample
obtained because the milk is better spread over the entire defined area of the microscopic slide. Microscopic slides have to be clean and free from fat. If the microscopic slide is not well cleaned or
[image:6.595.67.533.115.186.2]the fat is not thoroughly removed, then separa-tion of the fixed smear from the microscopic slide can occur during the process of washing the stain-ing solution from the smear in tap water. After
Table 2. Descriptive statistics and confidence intervals for the mean values of SCC/ml
Method Mean of all results Standard error Lower bound (95%) Upper bound (95%) Number of results (n)
A 344 000 1 046 342 407 346 526 90
B 333 000 1 046 330 940 335 059 90
C 322 000 1 046 319 518 323 637 90
[image:6.595.305.533.264.436.2]D 287 000 1 046 285 318 289 437 90
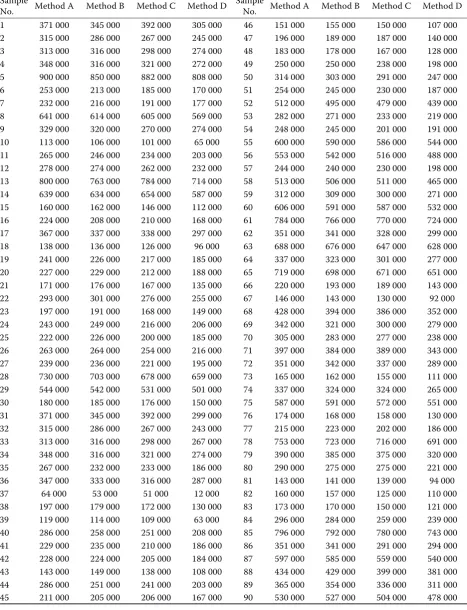
Figure 4. Method B, golden yellow fluorescing nuclei of somatic cells, background is yellow orange coloured, darkened particles are milk fat, smear was prepared from
[image:6.595.63.290.265.438.2]cow milk with 9 000 000 SC/ml, magnification Í 40
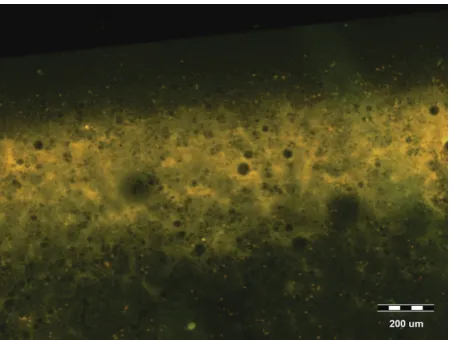
Figure 5. Method B, golden yellow fluorescing nuclei of somatic cells, darkened globular particles are milk fat, background is orange coloured because of the presence of EtBr staining solution added in liquid form directly
to the sample during the staining, magnification Í 600
Figure 6. Method A, golden yellow fluorescing nuclei of somatic cells, dark olive green coloured background, smear was prepared with cow milk with 1 500 000 SC/ml; figure shows a cluster of somatic cells that was not
count-able, magnification Í 600
Figure 7. Method A, golden yellow fluorescing nuclei of SC, dark olive green coloured background, smear was prepared with cow milk with 600 000 SC/ml; figure shows the edge of a smear on the top and an intensively
[image:6.595.65.290.517.688.2] [image:6.595.306.532.518.688.2]spreading the milk over the microscopic slide it is recommended to air-dry the smear. We do not recommend drying the smear on a hot plate, which may lead to the development of cracks in the fixed smear. Subsequently, during staining in Method A dye solution might penetrate these cracks and it is not possible to remove this dye when washing with tap water. Also, longer washing times (ISO 13366-1, 1997) may lead to a separation of the smear from the microscopic slide, and consequently, to smear destruction. On the other hand, if there is not a sufficient washing of dye, then it is not possible to view the microscopic slide under the microscope due to intensive fluorescence. Additionally, longer washing with tap water may lead to excessive re-moval of dye, and in this case, it is not possible to identify the SC nuclei.
Method A, in comparison to Method B, has other disadvantages. More aggressive and toxic chemicals are used for preparation of staining solution. The acute and chronic effects of tetrachlorethane were observed in humans (ATSDR 1996). Working pro-cedures have to be performed in an extractor hood. Fixation of smear takes at least 15 min in Method A and further staining procedures are required. Fixation of the smear for Method B takes the same amount of time, but no further action is required and the smear can be analysed immediately after drying. An advantage of Method A over Method B is a more comfortable viewing of the smear under a microscope. The smear does not contain
exces-sive dye, only the SC nuclei fluoresce with brightly golden yellow or orange colour, and the background of the smear is a dark olive-green colour (Figures 2 and 3). This is observed only when the blue fluo-rescence light of 450 nm wavelength is used. The accuracy of results is strongly affected by the qual-ity of the prepared smear. There are more work-ing operations within Method A in comparison to Method B. Consequently, there is an increased risk of possible mistakes or damage of the smear with Method A. In Method A, staining of the smear is performed by dipping the microscopic slide with the dried smear in the dye solution. Subsequently, the smear is gently dipped in tap water until all of the surplus dye is washed away and then the smear is dried again (ISO 13366-1, 1997). These operations increase the risk of smear damage. It is recommended to use only a gentle flow of tap water.
[image:7.595.65.290.94.265.2]The advantage of Method B is that the dye so-lution is directly added to the milk that has been boiled to 100 °C. Also, the milk is diluted with a dye solution at a 1 : 1 ratio. The smear contains excessive dye, there are fluorescing SC nuclei with brightly golden yellow or orange colour and the background of the smear is gently fluorescing with orange colour due to the presence of EtBr in the whole volume of the sample (Figures 4 and 5). Also, we can observe dark fat globules of different sizes. This is the scenario if the blue fluorescence light at a 450 nm wavelength is used. There are fewer work-ing operations within Method B than Method A,
Figure 8. Method A, golden yellow fluorescing nuclei of somatic cells on the right side of the figure, dark olive green coloured background, smear was prepared with cow milk with 1 500 000 SC/ml; in the upper left corner fluorescent
rod-shaped bacteria are visible, magnification Í 600
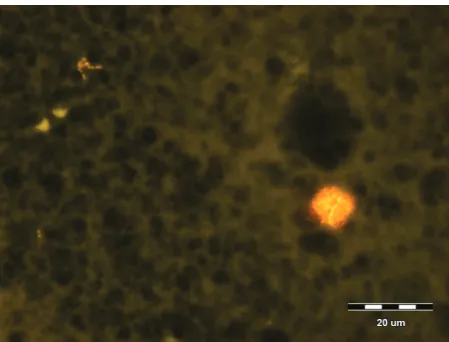
Figure 9. Method B, intensively red fluorescing nuclei of somatic cells, background is red, darkened particles are milk fat, a U-MNG2 lens unit with a filter generat-ing green light, was used, which caused EtBr to emit red
[image:7.595.304.532.95.267.2]and consequently, there is a lower risk of possible damage to the smear. A disadvantage of Method B is that there is one more pipetting step in comparison to Method A. Each mistake caused by pipetting may influence the results of the analysis. In Method B, this is the most important mistake because damage to the smear by creating cracks during drying does not influence the results of the analysis because staining is performed before drying.
A common problem associated with Method A is the clustering of SC (Figure 6); in this case the counting of cells is problematic. A very frequent problem with Method A is the creation of a very intensive fluorescing stripe lengthwise to the edge of the smear (Figure 7). At the edge of the smear, it is not possible to count the SC nuclei due to the very intensive fluorescence. This effect is caused by drying a larger volume of milk at the edge of the smear, and due to the increased number of cracks created during the process of drying (drying pro-ceeds from the edges to the centre of the smear). Other parts of the smear are well-visible.
We found that it is important to use only non-pre-served cow’s milk or milk prenon-pre-served by bronopol. We do not recommend the use of milk preserved by potassium dichromate because there is a de-creased adherence of the milk smear to the micro-scopic slide, as well as insufficient penetration of EtBr into SC nuclei. In comparison to our working procedure, Gonzalo et al. (2003) used poly-l-lysine to improve adherence of the smear to the slide. Ubben (2004) recommended analysing the smear immediately after preparation. We agree with this suggestion; however, we have found that smears can also be analysed several months after preparation without the results being affected. These smears should be protected from light and dust. We rec-ommend analysing the smear using a microscope at a × 600 magnification and with immersion oil. Lower magnification can lead to problems with identification of the SC nuclei present in clusters. The use of higher magnification is not necessary; furthermore, it is time-consuming. In general, it takes approximately 20 min for one smear to be analysed by a skilled worker.
The advantage of both Methods A and B is that EtBr stains only the SC nuclei. EtBr forms chemical complexes with the DNA of the cell nuclei (Raugel 1999). An exact determination of SCC in the sample is possible and mistakes due to counting forma-tions that are not SC are eliminated. This mistake
may occur when SC are stained by a methylene blue-modified Newman-Lampert stain solution (Levowitz-Weber modification). Also, some au-thors recommend the replacement of the meth-ylene blue-based stains with the DNA-specific pyronin Y-methyl green stain PMG for determi-nation of DMSCC in sheep milk (Petersson et al. 2011). According to our findings, the identification of fluorescing SC nuclei is simple and a laboratory technician can concentrate only on the fluorescing SC nuclei.
According to Raugel (1999) bacteria are stained with EtBr. We also found that EtBr stained the DNA of microorganisms present in the sample. In Method A, it is possible to distinguish micro-organisms from SC nuclei. Micromicro-organisms like bacteria are smaller in comparison to SC nuclei and also have characteristic shapes. In Figure 8, it is possible to see yellow colour fluorescing rod-shaped bacteria on dark olive green backgrounds. In Method B, microorganisms are practically not viewable because their identification is not possible due to the presence of fat globules and excessive concentration of EtBr in the whole volume of milk (Figure 9). According to Gallier (2010), the diam-eter of milk fat globules ranges from 0.1 to 20 µm. We found that these fat globules make viewing of the smear harder in Method B to a certain extent, because they can overlap with the SC. The diameter of somatic cells ranges from 6 to 15 µm (Varzakas and Tzia 2015). In Method A, this problem does not occur because most of the fat globules are de-stroyed by tetrachlorethane.
We also tried to stain the yeast Candida albi-cans with EtBr.This organism may be an aetio-logical agent in cow mastitis (Dworecka-Kaszak et al. 2012; Sartori et al. 2014). The size and shape of these yeasts are similar to somatic cells and in order to distinguish them from SC we inoculated
Candida albicans into distilled water and stained them with EtBr according to Method B. We found that the intensity of fluorescence decreased rapidly after illumination with fluorescent light. Thus, the presence of C. albicans is not problematic for mi-croscopic determination of SC.
microvascular integrity during mastitis (Burvenich et al. 2003). We added bovine erythrocytes to pas-teurised milk without somatic cells and stained the sample with EtBr. No fluorescence was observed.
Also, we determined that the EtBr standard stock solution can be kept in a dark place in an airtight flask between 0 °C and 5 °C for more than one year. Sample No. 90 was stained with working stain-ing solution prepared from either a 3-year-old or new solution. The results using Method B were 527 000 SC/ml (new solution) and 529 000 SC/ml (old solution).
The main differences in Method B in comparison with the reference method ISO 13366-1 (2008) in-cluded a dilution of the EtBr working staining solu-tion at a ratio of 1 : 9 with demineralised water. We did this because the sample contained a large con-centration of dye, which complicated the process of microscopic counting. There was an increased intensity of reflected light from the whole smear.
The most important modification in this experi-ment was the change in the temperature of the milk before staining. The temperature during staining was changed from 50 °C, as utilised in Vermunt et al. (1995) and reference method ISO 13366-1 (2008), to 100 °C. This modification improved the penetration of EtBr into SC nuclei through the dena-tured cell wall membrane. According to Pelvan and Unluturk (2015), EtBr can only penetrate and stain the DNA of dead cells. Also, in previous experi-ments, we found a statistically significant difference in the P-value < 0.005 (–79 000 SC/ml) between the test results when temperatures of 50 °C and 100 °C were used (Zajac 2007). This is an explana-tion for the temperature modificaexplana-tion in Method B. In our previous experiment we determined a differ-ence between Methods A and B of –21 000 SC/ml, which is in contrast with the 11 000 SC/ml de-termined in this experiment (Zajac 2007). This difference was probably caused by changes in the method of calculation in ISO 13366-1 (2008). In the previous experiment, we used a calculation with a constant working factor based on the number of strips counted completely. Because of the higher difference we do not recommend using the formula based on the constant working factor and the num-ber of bands counted completely.
Gonzalo et al. (2003) analysed SCC in sheep milk and compared three microscopic methods – stain-ing with methylene blue (MB), stainstain-ing accordstain-ing to May-Grunwald-Giemsa (MGG) and staining with
pyronin Y-methylene green (PMG) – and calcu-lated the correlation coefficients between these methods. They found that correlations between MB staining and MGG and PMG stainings were 0.981 and 0.982, respectively. The correlation co-efficient for MGG and PMG stainings was 0.990. The correlation coefficients between variants of the direct microscopy somatic cell count reference methods (DMSCC) and Fossomatic instruments in different analytical conditions were consistently very high (0.957–0.996). The authors demonstrated that the correlation coefficients between the three DMSCC stainings were very high (almost 1.00), so they could all be considered FSCC reference methods (Gonzalo et al. 2003). These results are in agreement with the results of our experiments. We calculated the following correlation coefficients: 0.998 between Methods A and B, 0.996 between Methods A and C, and 0.996 between Methods B and C. These results closely match the results of several other authors (Grappin and Jeunet 1974; Heeschen 1975; Schmidt-Madsen 1975; Heald et al. 1977; Schmidt-Madsen 1979), who calculated high correlation coefficients close to 1.00.
We calculated the expanded uncertainty of meas-urement U according to Ellison and Williams (2012). The expanded uncertainty U for both Methods A and B was 8% SC/ml.
ReFeRenCeS
Alekish MO (2015): The association between the somatic cell count and isolated microorganisms during subclinical mas-titis in heifers in Jordan. Veterinarni Medicina 60, 71–76. ANSES – French Agency for Food, Environmental and
Oc-cupational Health and Safety (2013): European Union Ref-erence Laboratory for Milk and Milk Products. Interlaboratory proficiency testing trial – Final report, EILA/Anses/LRUE MMP/EDB/2013/01. Somatic cell counting in raw cow’s milk by EN ISO 13366-1 standard method.
ATSDR – Agency for Toxic Substances and Disease Registry (1996): Toxicological Profile for 1,1,2,2-Tetrachloroethane (Update). Agency for Toxic Substances and Disease Registry. U.S. Public Health Service, U.S. Department of Health and Human Services, Atlanta.
Burvenich C, Van MV, Mehrzad J, Diez-Fraile A, Duchateau L (2003): Severity of E. coli mastitis is mainly determined by cow factors. Veterinary Research 34, 521–564.
Cervinkova D, Vlkova H, Borodacova I, Makovcova J, Babak V, Lorencova A, Vrtkova I, Marosevic D, Jaglic Z (2013): Prevalence of mastitis pathogens in milk from clinically healthy cows. Veterinarni Medicina 58, 567–575.
Commission Regulation (EC) No. 1662/2006 of 6 November 2006 amending Regulation (EC) No. 853/2004 of the Euro-pean Parliament and of the Council laying down specific hygiene rules for food of animal origin.
Dworecka-Kaszak B, Krutkiewicz A, Szopa D, Kleczkowski M, Bieganska M (2012): High prevalence of Candida yeast in milk samples from cows suffering from mastitis in Po-land. Scientific World Journal. Available: http://dx.doi. org/10.1100/2012/196347.
Ellison SLR, Williams A (2012) Eurachem/CITAC guide: Quantifying Uncertainty in Analytical Measurement. 3rd edn. Available: www.eurachem.org.
Gallier SYFCH (2010): Understanding the structure of the bovine milk fat globule and its membrane by means of mi-croscopic techniques and model systems. [PhD Thesis.] University of Otago, Dunedin, New Zealand.
Gonzalo C, Martinez JR, Carriedo JA, San Primitivo F (2003): Fossomatic cell-counting on ewe milk: Comparison with direct microscopy and study of variation factors. Journal of Dairy Science 86, 138–145.
Grappin R, Jeunet R (1974): First tests of the Fossomatic apparatus for automatically determining the number of cells in milk (in French). Le Lait 54, 627–644.
Harmon RJ (1994): Physiology of mastitis and factors af-fecting somatic cell counts. Journal of Dairy Science 77, 2103–2112.
Heald CW, Jones GM, Nickerson SC, Patterson WN, Vinson WE (1977): Preliminary evaluation of the Fossomatic
so-matic cell counter for analysis of individual cow samples in a central testing laboratory. Journal of Food Protection 40, 523–526.
Heeschen W (1975): Determination of somatic cells in milk (technical aspect of counting). Bulletin of the Interna-tional Dairy Federation 85, 79–92.
Idriss SE, Tancin V, Foltys V, Kirchnerova K, Tancinova D, Vrskova M (2013): Relationship between mastitis causa-tive pathogens and somatic cell counts in milk of dairy cows. Potravinarstvo 7, 207–212.
ISO 707 (2008): Milk and Milk Products – Guidance on Sampling. International Organization for Standardisa-tion, Geneva, Switzerland.
ISO 13366-1 (1997): Part 1: Microscopic method (Reference method). In: Milk – Enumeration of Somatic Cells. In-ternational Organization for Standardisation, Geneva, Switzerland.
ISO 13366-1 (2008): Part 1: Microscopic method (Reference method), superseding ISO 13366-1 (1997). In: Milk – Enumeration of Somatic Cells. International Organiza-tion for StandardisaOrganiza-tion, Geneva, Switzerland.
ISO 13366-1:2008/Cor 1 (2009): Part 1: Microscopic method (Reference method). In: Milk – Enumeration of Somatic Cells. International Organization for Standardisation, Geneva, Switzerland.
ISO 13366-2 (2006): Part 2: Guidance on the operation of fluoro-opto-electronic counters. In: Milk – Enumeration of Somatic Cells. International Organization for Stand-ardisation, Geneva, Switzerland.
ISO/IEC 17025 (2005): General Requirements for the Com-petence of Testing and Calibration Laboratories. Inter-national Organization for Standardisation, Geneva, Switzerland.
Pelvan M, Unluturk S (2015): Application of flow cytometry and fluorescence techniques in somatic cell analysis of raw milk. International Journal of Food Processing Tech-nology 2, 11–16.
Petersson KH, Connor LA, Petersson-Wolfe CS, Rego KA (2011): Evaluation of confirmatory stains used for direct microscopic somatic cell counting of sheep milk. Journal of Dairy Science 94, 1908–1912.
Pyorala S (2003): Indicators of inflammation in the diag-nosis of mastitis. Veterinary Research 34, 565–578. Raugel PJ (ed.) (1999): Rapid Food Analysis and Hygiene
Monitoring: Kits, Instruments and Systems. Springer-Verlag, Berlin. 383 p.
Rysanek D, Babak V, Zouharova M (2007): Bulk tank milk somatic cell count and sources of raw milk contamination with mastitis pathogens. Veterinarni Medicina 52, 223–230. Sartori LCA, Santos RC, Marin JM (2014): Identification
in four Brazilian states. Arquivo Brasileiro de Medicina Veterinaria e Zootecnia 66, 1615–1617.
Schmidt-Madsen P (1975): Fluoro-opto-electronic cell-counting on milk. Journal of Dairy Research 42, 227–239. Schmidt-Madsen P (1979): Influence of storage and pres-ervation of milk samples on microscopic and Fossomatic somatic cell counts. Nordisk Veterinaer Medicin 31, 449–454.
Ubben EH (2004): Quality management for DMSCC from milk sample to ring trial. Lecture In: Workshop of the European National Reference Laboratories, 9–10 Sep-tember 2004, BFEL, Kiel, Germany.
Varzakas T (2015): Chapter 3. Centrifugation-filtration. In: Varzakas T, Tzia C (eds): Food Engineering Handbook. Food Process Engineering. CRC Press, Boca Raton. 90 p. Vasil M, Elecko J, Zigo F, Farkasova Z (2012): Occurrence
of some pathogenity factors in coagulase negative
staph-Corresponding Author:
Ing Peter Zajac, PhD., Veterinary and Food Institute Bratislava, National Reference Laboratory for Milk and Milk Products, Hlohovecka 5, 951 41 Nitra-Luzianky, Slovakia
E-mail: [email protected]
ylococci isolated from mastitis milk in dairy cows. Potravinarstvo 6, 60–63.
Vermunt AEM, Loeffen GJM, Van Der Voet H, Naber MAAM (1995): Development of reference samples for the calibration and quality control of somatic cell count using a Fossomatic instrument. Netherlands Milk and Dairy Journal 49, 111–123.
Zajac P (2007): Optimalization of the reference method for determination of somatic cells count in raw cow milk. [PhD Thesis.] Slovak University of Agriculture in Nitra, Slovakia.
Zajac P, Tomaska M, Murarova A, Capla J, Curlej J (2012): Quality and safety of raw cow’s milk in Slovakia in 2011. Potravinarstvo 6, 64–73.