In modern human nutrition milk still gains in-creasing importance as it is the basic raw material for a great diversity of dairy products. The health of the udder can have a profound effect on the quality and processing characteristics of milk. Many milk processing companies worldwide have incorporated somatic cell count as a key parameter in schemes which reward producers for producing milk of the highest quality. The occurrence of inflammatory process or mastitis generally leads to an increase in SCC in milk, which has been associated with changes in milk components and properties (Barbano et al. 1991; Auldist & Hubble 1998; Tripaldi et al. 2003; Cunha et al. 2008; Barlowska et al. 2009).
In Europe, according to the currently valid legisla-tion, Commission Regulation (EC) No. 1662/2006 of 6 November 2006, milk intended for human
con-sumption should not contain more than 400 × 103/ml somatic cells. This level will minimise the effects of mastitis on product quality, although negative ef-fects on product quality have been reported for milk with a SCC as low as 100 × 103/ml. Further, a bulk milk somatic cell count of 400 × 103/ml indicates that around 40% of cows in a herd might be infected (Auldist & Hubble 1998; Barlowska et al. 2009). Mastitic milk has a higher proteolytic activity than normal milk, in part due to the increased proteinase plasmin, which hydrolyzes caseins (Le Roux et al. 2003). Proteolysis could occur in milk with SCC as low as 250 × 103/ml (Le Roux et al. 1995). The variations in milk SCC explain about half of the variations in milk plasmin and casein damage (Le Bars & Gripon 1993; Le Roux et al. 1995, 2003; McSweeney & Fox 1995; Barbano 2000). The
Relationship between Somatic Cell Count and Milk Casein
Level Obtained by Two Different Methods
Kristina Musayeva1, antanas sederevičius 1, rasa Želvytė 1, ingrida MonKevičienė 1,
danuta BeliavsKa-aleKsiejūnė 1 and rolandas stanKevičius 2
1department of anatomy and Physiology, Faculty of veterinary Medicine
and 2department of animal Breeding and nutrition, Faculty of animal Husbandry
technology, lithuanian university of Health sciences, Kaunas, lithuania
Abstract
Musayeva K., Sederevičius A., Želvytė R., Monkevičienė I., Beliavska-Aleksiejūnė D., Stankevičius R.
(2016): Relationship between somatic cell count and milk casein level obtained by two different methods.
Czech J. Food Sci., 34: 47–51.
The purpose of the present work was to investigate the impact of somatic cell count (SCC) on the content of milk casein and to compare the sensitivity of different methods for the determination of the casein level in milk. Two dif-ferent methods were employed in order to determine the casein level: routine method – infrared spectrophotometry and reference method – Kjeldahl. Data array of 26, 169 milk samples of the livestock control was used to analyse milk casein variation by SCC limits. Mean casein values (investigated by the routine method) varied from 2.47% to 2.8% (2.65 ± 0.09) and casein number (in % on crude protein basis) – CN% varied from 79.5% to 81.1%. The present analysis showed that the relation between SCC and casein content obtained by the routine method correlated significantly (Pear-son correlation rp = 0.644, P < 0.05, r2 = 0.414, Spearman correlation r
s = 0.786, P < 0.05). Evaluated results obtained by the least squares method, and linear approximation of variation indicators presented a noticeable decline in casein percentage – 0.27%, when SCC increased by 80 × 103/ml, but only when the studies were done by the reference method.
Keywords: raw milk; proteins; cow
deterioration of milk continues during storage and may lead to casein proteolysis due to the presence of proteolytic enzymes (Button et al. 2011).
In countries where large quantities of milk are processed to make cheese, it is crucial to assess the range of the casein proportion in milk true protein and the factors causing it to vary (Coulon et al. 1998). Lack of simple routine analyses to measure casein content in milk is a major factor limiting pro-gress in this direction (Hallén 2008). To calculate milk casein as a percentage of true protein (C% TP) according to Barbano et al. (1991), casein and true protein need to be measured. Milk protein can be measured rapidly and cost-effectively by infrared analysis, but the dairy industry does not currently have a practical method for measurement of milk casein content. Development of a rapid, accurate, and economical test for casein would be of great value to the dairy industry for use in milk payment programs(Barbano et al. 1991).
The purpose of the present work was to investigate the impact of somatic cell count on the content of milk casein as a percentage of true protein and to compare the sensitivity of two different methods for the determination of the casein level in milk.
MATERIAL AND METHODS
Analysis of database concerning casein and SCC in milk samples from livestock in Lithuania. Milk casein and SCC data array of the livestock control (June 2013) was used for a situation analysis. To-tal data sample record of the livestock control in Lithuania consisted of 22.6% records (26 169 milk samples). Structured Query Language (SQL) data were processed in the database management system of Linux operating environment. The groupings of milk samples were performed on the basis of SCC with the help of SQL request in the database of the livestock control. The individual animal milk samples were divided into thirteen groups where SCC varied from 10 × 103/ml to 4999 × 103/ml and the average of casein as the mean percentage of true protein in each group was computed.
Investigation of casein and SCC in milk samples from selected herd
Collection of milk samples. A selected herd was participating in the animal productivity control program. Overall 110 cows were randomly selected.
All animals enrolled in the study were lactating cows of the holsteinized Black-and-White breed. The milk samples were collected during control evening milk-ing time as total quarter milk from each cow in pairs. After cleaning and disinfection of the teats, 50 ml of milk were aseptically collected in sterile plastic tubes according to LST EN ISO 707:1999 + P:2003 standard. Samples were kept under refrigeration until arrival to laboratory facilities and were tested within 6 h from collection.
analysis of milk samples. Theanalysis of rawmilk samples was performed in an accredited milk labora-tory. As the first step for determination of somatic cell count, 110 collected milk samples were preserved and analysed by the flow cytometric analysis method using a Somascope cell counter according to LST EN ISO 13366-1:2008 + AC:2009 standard for a microscopic method.
As a further step, eighteen milk samples sorted ac-cording to SCC results of the first step were investi-gated for casein content and CN ratio (in %) in milk by reference Kjeldahl method and routine infrared spectrophotometric method. Casein nitrogen con-tent was determined by an indirect reference meth-od. Determination of casein and non-casein nitrogen (NCN) content was done according to ISO 8968-1: 2014 Milk and milk products – Determination of ni-trogen content – excerpted Part 1: Kjeldahl principle and crude protein calculation. NCN was obtained using precipitation with acetic acid and sodium ac-etate solutions. The precipitated casein was removed by filtration, so NCN remained in the filtrate. Nitro-gen content in the filtrate was determined according to ISO 8968-1:2014 Milk and milk products – De-termination of nitrogen content – excerpted Part 1: Kjeldahl principle and crude protein calculation. Casein nitrogen was calculated from the total nitrogen minus the obtained NCN content of milk. Casein number (in % on crude protein basis) and casein mean values were analysed by the routine infrared spectrophotometric method using a LactoScope FTIR analyser according to LST ISO 9622:2000 standard.
SCC levels and milk casein. Results were statistically significant when r2 was not lower than 0.25.
RESULTS
Mean casein values by somatic cell count limits of database analysis from the livestock of Lithuania ranged from 2.47 to 2.8 (2.648 ± 0.09; SE 0.02); these data are reported in Table 1 and Figure 1. The pre-sent analysis shows only a slightly notable change in casein of controlled cow’s milk by somatic cells count limits. When milk samples were estimated by the infrared spectrophotometric method, a high level of SCC had a statistically positive relation to the casein content (P < 0.05).
CN (in %) estimated by the reference method was 2–5% higher than the casein percentage tested by the infrared spectrophotometric method when SCC was low and ranged from 33 × 103/ml to 293 × 103/ml. Though, when SCC was high and ranged from 2203 × 103/ml to 5395 × 103/ml, the casein percentage de-creased to 5%, in comparison with the casein level estimated by the infrared spectrophotometric method. The data obtained by reference (Kjeldahl) and routine (infrared spectrophotometry) methods correlate sig-nificantly (Pearson correlation rp = –0.634, P < 0.05, r2 = 0.4023). These data are reported in Figure 2.
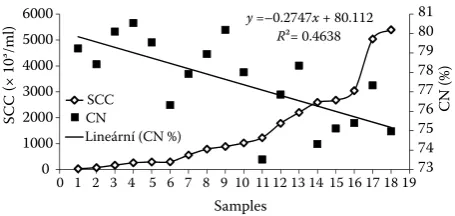
[image:3.595.66.530.123.325.2]Evaluated results obtained by the least squares method, and linear approximation of variation in-dicators are presented in Figure 3. When the studies were done by the reference Kjeldahl method with
Table 1. Variation indicators of casein distribution by SCC limits
No of groups SCC groups (× 103/ml) Number of cows (n) –x CN (%) SD Cv
1 10–99 8737 2.47 79.5 0.31 12.52
2 100–199 6970 2.53 79.8 0.35 13.79
3 200–299 3790 2.59 80.0 0.38 14.48
4 300–399 2230 2.65 80.2 0.40 15.14
5 400–499 1421 2.64 80.1 0.40 15.13
6 500–599 1099 2.66 80.3 0.42 15.69
7 600–699 793 2.68 80.6 0.44 16.35
8 700–799 471 2.71 80.7 0.43 15.79
9 800–999 338 2.70 80.5 0.44 16.25
10 1000–1499 187 2.60 80.1 0.35 13.48
11 1500–1999 90 2.74 80.7 0.52 19.08
12 2000–2999 32 2.66 80.3 0.30 11.22
13 3000–4999 11 2.80 81.1 0.30 10.61
–x – mean casein values; CN – casein number values (in % on crude protein basis); SD – standard deviations; CV – coefficients
of variation
Figure 1. Changes in casein percentage (CN%) by somatic cells count (SCC) limits tested by infrared spectropho-tometric method
79.5 79.8 80.0 80.2 80.1 80.380.6 80.7 80.5 80.1 80.7 80.3 81.1
60 65 70 75 80 85
2.0 2.2 2.4 2.6 2.8 3.0
10–9
9
100–199 200–299 300–399 400–499 500–599 600–699 700–799 800–999
1000–1499 1500–1999 2000–2999 3000–4999
CN (%)
Casein mean (%)
SCC groups (×10³/ml)
Casein mean Casien number
70 75 80 85 90
33 78 171 262 293 301 564 791 890
10
30
12
32
17
85
22
03
25
96
26
80
30
46
50
37
53
95
CN
(%
)
SCC (× 10³ ml)
[image:3.595.64.292.592.725.2]Infrared spectrophotometry Kjeldahl
[image:3.595.306.531.593.714.2]eighteen milk samples, SCC increased from about 30 × 103/ml to 5000 × 103/ml, and casein number decreased from 81% to 74%. Results were statistically significant (r2 = 0.4638).
DISCUSSION AND CONCLUSIONS
Our objective in this investigation was to assess the influence of somatic cell count on the casein level in cow’s milk. It has been suggested that a somatic cell count in milk higher than 400 × 103/ml probably indicates that the cow suffers from udder inflammation (Akers 2002). High SCC influences milk quality, as it is associated with the increased proteolytic degradation of caseins (Barbano et al. 1991; Bastian & Brown 1996).
It was hypothesized that the relationship between increasing milk SCC and decreasing casein would be linear. The data collected in this study demonstrate a statistically positive relation (P < 0.05) between SCC and the content of casein when milk samples were tested by the routine infrared spectrophoto-metric method.
At the beginning of this study, data array of the livestock control was taken for a situation analysis to estimate the casein variation by SCC limits in milk. The average percentage of casein by somatic cells count limits ranged from 79.5% to 81.1%. The pre-sent analysis showed that an increase of somatic cell counts in milk was associated with increased casein content. The casein content was related with somatic cells by a positive correlation (Pearson correlation rp = 0.644, P < 0.05, r2 = 0.414, Spearman correlation r
s = 0.786, P < 0.05). According to other authors, to obtain better values of these parameters SCC 200 × 103/ml should not be exceeded (Barbano et al. 1991; Tri-paldi et al. 2003). This may be linked to increased
endogenous proteolysis due the elevation of plasmin or other proteases derived from somatic cells, leading to the breakdown of casein and the influx of blood proteins (immunoglobulins – IgG, and bovine serum albumin) into milk due to increased permeability of the mammary epithelium, which results in an elevated non-casein nitrogen content (Le Roux et al. 1995; Coulon et al. 2002). The results obtained in this study are in contradiction with the results reported by some authors. According to Tripaldi et al. (2003) the content of casein decreased when somatic cells increased (from 3.90% to 2.69%). Similar results were reported by Ballou et al. (1995) and Litwinczuk et al. (2011).
The investigation of casein by different methods was analysed in a scientific study performed by Barbano and Dellavalle (1987). These authors determined that protein, casein, or non-casein protein in 36 differ-ent individual herd milk samples subjected to analy-sis of variance indicated no statistically significant differences between the results from Kjeldahl and infrared analyses. Casein as a percent on the total nitrogen basis varied from 76.3% to 78.8% (Barbano & Dellavalle 1987). Hanuš et al. (2010) reported that the casein number varied from 79.4% to 80.56% (two breeds, Holstein and Czech Fleckvieh, six herds) in bulk milk samples in three years. The variability was from 1.4% to 1.5% relatively, which means low. It was shown on relatively reliable casein analyses by indirect methods of infrared spectroscopy (MIR – Michelson interferometer and MIR-FT – Fourier transform) (Hanuš et al. 2010). We found out that high SCC showed a negative correlation with casein when milk samples were tested by the routine infrared spectrophotometric method. When the studies were done by the reference Kjeldahl method and SCC was increased, linear approximation of variation indica-tors showed a noticeable decline in casein number from 81% to 74 %.
Based on the results, it can be concluded that from the data array of the livestock control the relation-ship between increasing milk SCC and increasing casein content demonstrates a statistically positive relation (P < 0.05). There was a slight change in CN (in %) with milk SCC increasing from 10 × 103/ml to 2999 × 103/ml when milk samples were tested by the infrared spectrophotometric method. Determination of casein by different methods indicated that CN decreased from 78% to 75% with milk SCC increas-ing from 2203 × 103/ml to 5395 × 103/ml when milk samples were tested by the reference Kjeldahl method. 73
74 75 76 77 78 79 80 81
0 1000 2000 3000 4000 5000 6000
0 1 2 3 4 5 6 7 8 9 10 11 12 13 14 15 16 17 18 19
CN
(%
)
SC
C
(×
10
³/ml
)
Samples SCC
CN
Lineární (CN %)
[image:4.595.62.290.105.213.2]y =–0.2747x + 80.112 R²= 0.4638
Further studies are needed to clarify the relation-ships between casein content and SCC in cow’s milk. To develop a method for the determination of milk casein content more practical studies and analyses are required.
References
Akers R.M. (2002): Lactation and the Mammary Gland. Iowa, Iowa State Press: 100–200.
Auldist M.J., Hubble I.B. (1998): Effects of mastitis on raw milk and dairy products. Australian Journal of Dairy Technology, 53: 28–36.
Ballou L.U., Pasquini M., Bremel R.D., Everson T., Dean Somme R.D. (1995): Factors affecting herd milk composi-tion and milk plasmin at four levels of somatic cell counts. Journal of Dairy Science, 78: 2186–2195.
Barbano D.M. (2000): Practical Guide for Control of Cheese Yield. International Dairy Federation, Brussels: 19–27. Barbano D.M., Dellavalle M.E. (1987): Rapid method for
determination of milk casein content by infrared analysis. Journal of Dairy Science, 70: 1524–1528.
Barbano D.M., Rasmussen R.R., Lynch J.M. (1991): Influ-ence of milk somatic cell count and milk age on cheese yield. Journal of Dairy Science, 74: 369–388.
Barlowska J., Litwinczuk Z., Wolanciuk A., Brodziak A. (2009): Relationship of somatic cell count to daily yield and technological usefulness of milk from different breeds of cows. Polish Journal of Veterinary Science, 12: 75–79.
Bastian E.D., Brown R.J. (1996): Plasmin in milk and dai-ry products: an update. International Daidai-ry Journal, 6: 435–457.
Button P.D., Roginski H., Deeth H.C., Craven H.M. (2011): Improved shelf life estimation of UHT milk by predic-tion of proteolysis. Journal of Food Quality, 34: 229–235. Coulon J.B., Hurtaud C., Remond B., Verite R. (1998): Fac-tors contributing to variation in the proportion of casein to cows’ milk true protein: a review of recent INRA ex-periments. Journal of Dairy Research, 65: 375–387. Coulon J.B., Gasqui P., Barnouin J., Ollier A., Pradel P.,
Pomiès D. (2002): Effect of mastitis and related-germ on
Corresponding author:
Kristina Musayeva, PhD., Lithuanian University of Health Sciences; Faculty of Veterinary Medicine,
Department of Anatomy and Physiology, Tilžės st. 18, LT-47181 Kaunas, Lithuania; E-mail: [email protected] milk yield and composition during naturally-occurring udder infections in dairy cows. Animal Research, 51: 383–393.
Cunha R.P.L., Molina L.R., Carvalho A.U., Facury Filho E.J., Ferreira P.M., Gentilini M.B. (2008): Subclinical mastitis and relationship between somatic cell count with number of lactations, production and chemical composition of milk. Brazilian Journal of Veterinary and Animal Science, 60: 19–24.
Hallén E. (2008): Coagulation Properties of Milk Associa-tion with Milk Protein ComposiAssocia-tion and Genetic Poly-morphism. [PhD Thesis.]. Uppsala, Swedish University of Agricultural Sciences.
Hanuš O., Yong T., Kučera J., Genčurová V., Hanušová K., Kopec T., Kopecký J., Jedelská R. (2010): Analýza výsledků kalibrací pro stanovení kaseinu nepřímou metodou in-fračevené spektroskopie. Acta Universitatis Agriculturae et Silviculturae Mendelianae Brunensis, 58: 123–136. Le Bars D., Gripon J.C. (1993): Hydrolysis of α-s1-casein
by bovine plasmin. Lait, 73: 337–344.
Le Roux Y., Colin O., Laurent F. (1995): Proteolysis in sam-ples of quarter milk with varying somatic cell counts. 1. Comparison of some indicators of endogenous prote-olysis in milk. Journal of Dairy Science, 78: 1289–1297. Le Roux Y., Laurent F., Moussaou F. (2003): Polymorphonu-clear proteolytic activity and milk composition change. Veterinary Research, 34: 629–645.
Litwińczuk Z., Król J., Brodziak A., Barłowska J. (2011): Changes of protein content and its fractions in bovine milk from different breeds subject to somatic cell count. Journal of Dairy Science, 94: 684–691.
McSweeney P.L.H., Fox P.F. (1995): Proteolysis of bovine caseins by cathepsin D: preliminary observations and comparison with chymosin. International Dairy Journal, 5: 321–336.
Tripaldi C., Terramoccia S., Bartocci S., Angelucci M., Da-nese V. (2003): The effects of the somatic cell count on yield, composition and coagulating properties of medi-terranean buffalo milk. Asian-Australasian Journal of Animal Sciences, 16: 738–742.