A New Approach for Optimizing GNSS
Positioning Performance in the Harsh
Observation Environments
Shuguo Pan
1, Xiaolin Meng
2, Wang Gao
3,
Shengli Wang
1,4, Alan Dodson
21(School of Instrument Science and Engineering, Southeast University, Nanjing,
China)
2(Nottingham Geospatial Institute, the University of Nottingham, Nottingham, UK)
3(School of Transportation, Southeast University, Nanjing, China)
4(School of Surveying and Mapping Engineering, Anhui University of Science &
Technology, Huainan, China)
(Email: [email protected])
Maintaining good positioning performance has always been a challenge task for Global Navigation Satellite Systems (GNSS) applications in partially obstructed environments. A method that can optimize positioning performance in the harsh environments is proposed. Using carrier double-difference (DD) model, the influence of the satellite-pair geometry on the correlation among different equations is researched. This addresses the critical relationship between DD equations and its ill-posedness. From analyzing the collected multi-constellation observations, a strong correlation between the condition number and the positioning standard deviation is detected as the correlation coefficient is larger than 0.92. Based on this finding, a new method for determining the reference satellites by using the minimum condition number rather than the maximum elevation is proposed. This reduces the ill-posedness of the co-factor matrix, which improves the single-epoch positioning solution with a fixed DD ambiguity. Finally, evaluation trials are carried out by masking some satellites to simulate common satellite obstruction scenarios including azimuth shielding, elevation shielding and strip shielding. Results indicate the proposed approach improves the positioning stability with multi-constellation satellites notably in the harsh environments.
KEY WORDS
1. Harsh Environment. 2. Multi-constellation GNSS. 3. Observation Structure. 4. Condition Number.
5. Reference satellite
Real-time Kinematic (RTK) GNSS positioning demonstrates its advantages furthermore by providing automatic all-weather monitoring of structural health conditions (Takasu and Yasuda, 2008), particularly in the situations where continuous, real-time and highly accurate positioning or monitoring is required, e.g. the vibration monitoring of tall or long span engineering structures under the loading conditions of strong wind, changeable temperature, eventual traffic and earthquakes, and ground surface settlement monitoring during construction. Moreover, without the need of line of sight (LOS) among stations, the placement of positioning or monitoring stations is granted with more freedom in the complicated environments. However, in the harsh environments, such as urban canyons or deep valleys, such monitoring applications based on Global Positioning System (GPS) only system have apparent drawbacks, such as the low system robustness, inadequate accuracy, and so on (Meng, 2013). This is due to pervasive GNSS signal blockage, signal reflection and refraction caused by the buildings in the surrounding environment. The number of observable satellites and the signal quality in such cases are significantly degraded, resulting in poor positioning performance (accuracy, robustness, continuity, etc.). Following the emergence and rapid development of other GNSS, i.e. GLObal NAvigation Satellite
System (GLONASS), Galileo and BeiDou Navigation Satellite System (BDS), GNSS
step into a new era (Yang et al., 2011). With at least 70 to 80 visible GNSS satellites in the sky today, signals from at least 10 to 30 satellites could be received anywhere (excluding North and South Poles) in the world. This enables precise GNSS positioning even in the partially obstructed areas possible.
A common positioning problem in the urban environments is that the visible satellites are unevenly distributed, i.e. the signals from a certain azimuth or elevation range cannot be used to resolve for GNSS positioning due to signal obstruction and corruption, which causes a strong correlation between the observation equations. In other words, the solution system is strongly ill-conditioned (Li et al., 2010). Under such circumstances, even with a sufficient number of satellites and high quality observations, the solution system would still result in poor accuracy and low stability due to observation noise. Current studies on positioning accuracy and stability mainly focus on the treatment of observation noise with least squares adjustment or robust filtering (Huang et al., 2012; Li and Kuhlmann, 2012;Yuan et al., 2010; Yang et al.,
2001; Yetkin and Berber, 2012). These methods could avoid or reduce the influence of gross error in observations on positioning results effectively. However, the estimated unknown parameters are not only influenced by observation values but by the observation structure as well, i.e. the coefficient matrix of the error equation (Meng et al., 2004). The observation structure directly affects the solution of parameters and also determines the level of the impact. Even with observations of the same accuracy level, different observation structures will output different positioning results. Therefore, the optimization of the observation structure plays a vital role in precise GNSS positioning, especially for the applications under the harsh observation environments such as deformation monitoring.
Dilution of Position (PDOP), which reflects the relative orientation of the satellites relating to the observation stations, i.e. the more evenly spaced out the satellites, the smaller the PDOP value, and the better the observation conditions (Meng et al., 2004; Wing et al., 2005). However when applying the carrier phase double difference (DD) method, the observation structure actually reflects the structure of each pair of reference and non-reference satellites. Therefore the relative distribution among satellite pairs should be considered as well as the overall satellite distribution. PDOP fails to reflect the full picture between satellite distribution and observation structure in this sense. Thus a better criterion for evaluating the observation structure and positioning stability of carrier phase DD in the harsh environments should be sought. The selection of reference satellites is a critical factor when resolving for carrier phase DD solutions, especially when only a few satellites are observed. Selection of different reference satellites may see a huge difference in the distribution of the satellite pairs, which is reflected on the correlation between the observation equations, and affect the positioning accuracy and stability.
Based on the characteristics of GNSS applications in urban canyons or deep valleys, this article proposes a new method of improving GNSS positioning stability and accuracy through optimizing the observation structure that differs from the conventional approach in GNSS data processing. This paper analyses the relationship between the distribution of (reference and non-reference) satellite pairs and the performance of combined GPS/BDS/GLONASS DD observation structure based on the ill-condition theory. The minimum condition number is then used as an evaluation criterion for observation structure stability and positioning accuracy instead of a PDOP value. Real GPS/BDS/GLONASS data are used to verify the correlation between the condition number and the positioning accuracy variation. Furthermore, the optimal condition number is used for the determination of reference satellites rather than the maximum elevation angle. The satellite distribution geometry is improved by selecting reference satellites more rationally under same observation conditions, which achieves the optimization of GNSS positioning observation structure. Finally, relevant evaluation trials are carried out by masking observable satellites to simulate common elevation shielding, azimuth shielding and strip shielding at different geo-locations (medium and high latitudes). The studies in this paper enhance the multi-constellation observation structure stability and positioning accuracy in the harsh environments which sees a major improvement in GNSS positioning results. In this paper, Section 2 introduces the basic positioning model with multi-constellation .Section 3 includes the evaluation method of the observation structure. The method using minimum condition number to determine the optimal observation structure is presented in Section 4.In Section 5 some simulative-shielding trials are carried out to verify the applications effect of the proposed method in partially obstructed environments.
Code Division Multiple Access (CDMA) coding techniques, such as GPS, Galileo and BDS, the same frequencies are used by all satellites from the same system. When only considering tropospheric and ionosphere delays, the DD carrier phase observation equations are as below:
1 1 I1 T 1 N1
(1)
2 2 I2 T 2 N2
(2)
For Frequency Division Multiple Access (FDMA) coding systems such as GLONASS, the observations coming from different satellites employ different frequencies (Glonass, I. C. D, 2002; Wanninger, 2012; Pratt et al., 1998), thus the carrier phase DD observation equations can be presented as below:
1 1 1 1 1 ( 1 1) 1
p p p r r
I T N N
(3)
2 2 2 2 2 ( 2 2) 2
p p p r r
I T N N
(4)
In Equation (1) to Equation (4) ( )is the double difference operator between satellites and receivers. 1 and 2are the wavelength for signal carrier L1and L2,
1
and 2are the carrier measurements on L1 and L2. is the geometrical distance between the satellite and the receiver.I1 and I2is the ionosphere delay on L1 and
2
L . Tis the tropospheric delay, N1and N2are the unknown integer ambiguities of both carriers. In Equation (3) and Equation (4), pand
r
are the index number of the reference and non-reference satellites in the GLONASS system respectively. ri
N is the receiver single difference integer ambiguity for frequency i of the reference satellite. Methods proposed by Wang and Walsh (Wang, 2000; Walsh and Daly, 1996) may be used to resolve for the single difference ambiguity of the GLONASS system. Having fixed the single difference ambiguities, we may assume that GPS, Galileo, BDS and GLONASS systems employ the same DD integer ambiguity resolution model. Equations (1)-(2) or Equations (3)-(4) may be combined to form the ionosphere-free observation equation to eliminate the ionosphere effect when neglecting the second order terms of the ionosphere bias (Ge et al., 2008; Loyer et al., 2012; Hoque and Jakowski, 2007), as shown below:
2 2
1 1
1 1 2 2
2 2 2 2
1 2 1 2
2 2
1 1
1 1 2 2
2 2 2 2
1 2 1 2
f f
f f f f
f f
T N N
f f f f
(5)
1
f and f2 are frequencies of L1 and L2 respectively. The DD ambiguities
1 N
and N2 are both included in Equation (5). In practice, the wide-lane DD ambiguity Nw (Nw= N1 N2 ) of the longer wavelength is usually worked out first. Thus Equation (5) will be left with the basic DD ambiguity (N1or
2 N
) only. They are then treated as unknown parameters together with baseline coordinates to be solved through multi-epoch observation equations.
leads to poor positioning accuracy or even position fixing failure. In such cases, a combination of multi-constellation GNSS satellites that shares the same baseline vector with unknown parameters helps to solve for a better position fix. Each system determines the reference satellites independently to overcome the problem of different frequencies used by different systems. Therefore at least two satellites from the same system must be observed in order to solve for a position fix. Once an ambiguity resolution is achieved, the position for a single epoch may be attained using Equation 6.
1, 1, 1, 1, 1, 1, 1, 1,
0 ,
, , , , , , , ,
0 ,
, , ,
( ) ( )
δ
( ) ( )
δ δ
G G G G G G G G
R R R R R R R R
C C C
k k k k k k k k
IF G IF IF IF
m k m k m k m k m k m k m m k m k
IF R IF IF IF
n k n k n k
a b c T N
x
a b c T N
V = BX - L y
z
a b c
, , , , ,
0 ,
( n kC n kC n kC) ( n kC n kC)
IF C IF IF IF
T N
(6)
Whereas V is the residual vector, B is the design matrix, X is the unknown
baseline-vector parameters to be estimated, Lis the observation vector. a、 、b c are the coefficients of the unknown parameters δx、 、δy δz of each error equation respectively, kG、 、kR kC is the satellite index number of GPS, GLONASS and BDS respectively.m and nare the beginning index of GLONASS and BDS satellites. Supposed that i indicate the index of non-reference, we have the following correspondence:
1 ,
, ,
i m GPS
m i n GLONASS i n BDS
0
is the approximate range between the satellite and the receiver. G IF, , m, R IF
,
, C IF
are the ionosphere-free wavelength combinations of GPS, GLONASS(the m-index satellite) and BDS.IF、IF、NIF are the ionosphere-free carrier phase observations, residuals and ambiguities, of which IFfor GLONASS includes the equivalent range term of the single difference ambiguity for the reference satellites.
Equation (6) could be used to solve for single epoch positioning after fixing the carrier phase DD ambiguities. With only three unknown coordinates, a minimum of three observation equations is needed, thus at least three satellite pairs are required. Any further equations would be regarded as redundant observations, which may increase positioning accuracy on one hand, but on the other hand might increase the correlation between equations and reduce positioning stability.
3. EVALUATION OF THE OBSERVATION STRUCTURE OF
would fluctuate. Currently, PDOP values are generally used to describe the quality of satellite distributions. For the nth observable satellite at a station, its coordinates are denoted as (X Yn, n,Zn), station coordinates are (X Y Zi, ,i i), the design matrix can be expressed as Equation 7 (Borre and Strang, 1997).
1 1 1
1 1 1
2 2 2
2 2 2
1
1 1 1
i i i
i i i
i i i
i i i
n n n
i i i
n n n
i i i
X X Y Y Z Z
X X Y Y Z Z
A
X X Y Y Z Z
(7)
Then the co-factor matrix would be 1
( T )
Q A A and
(1,1) (2, 2) (3,3)
PDOP Q Q Q . PDOP is a straightforward reflection of the distribution evenness and discreteness of the visible satellites and proves to be a good accuracy evaluation criterion in non-differencing positioning. However in DD positioning, the relative distributions among the reference and non-reference satellites should be considered together with the independent distribution described by PDOP.
Each pair of satellites refers to a carrier phase DD observation equation. Hence the correlations between the observation equations reflect the geometric distribution of the satellite pairs. The more scattered the satellite pairs, the smaller the correlation between the observation equations. If there a strong correlation was detected between the observation equations, it would be assumed that there is a lack of sufficient observations, which can be seemed as an ill-conditioned problem (Chang et al., 2009; Farooq and Salhi, 2011; Wang et al., 2006). A condition number provides an effective evaluation method to a system of its ill-conditioned level when resolving for ill-conditioned system parameters. The condition number is described as below:
For an observation equationV BX L, its least squares solution can be expressed as Equation 8 (Mikhail and Ackermann, 1976; Ge et al., 2005).
ˆ T -1 T
X = (B PB) B PL (8)
Of which V is the residual vector, B is the design matrix, P is the weight
matrix, L is the observation vector, and X is the unknown-parameter vector, whereas in this paper is the unknown baseline-vector parameters, ˆX is the least squares solution of X.
If N = B PBT is denoted as the coefficient matrix of the normal equation, Equation
8 may be rewritten as
ˆ -1
X = N W (9)
WhereW = B PLT .
Nand constant matrixW each contain an error term NandδW . The corresponding relationship is as below:
||δ || cond( ) ||δ || ||δ ||
( )
||δ ||
|| || 1 cond( ) || || || || || ||
X N W N
N
X N W N
N
(10)
Of which cond( )N ||N1|| || ||N is the condition number of matrix N ; || || is the spectrum norm operator. We could see from Equation (10) that the condition number reflects the impact of the relative disturbance of the normal matrix N and constant Won parameter estimations. When the condition number of the normal equationN is large (i.e. serious ill-conditioned normal equation), the parameter solution would still contain a large error even if disturbance were small in N and W. Therefore, the condition number is commonly used as an evaluation factor for the ill-condition of a parameter estimation model (Cline et al., 1979; Hansen et al., 1992), and we can further use it to evaluate the observation structure in the carrier phase DD GNSS positioning.
Figure 1. Sky plot of the whole observation period.
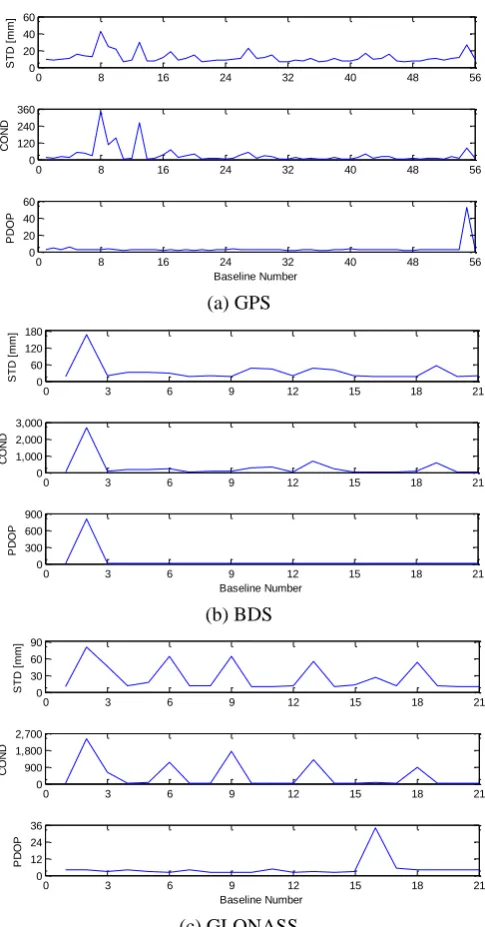
A set of combined GPS/BDS/GLONASS short baseline observation data (data rate of 1s for a continuous 1000 epochs) is collected at Southeast University, China on 17th March 2013 to assess and validate the effectiveness of PDOP and condition number on evaluating the stability of positioning solutions. During this period, a total number of 8 GPS satellites, 7 BDS satellites and 7 GLONASS satellites could be observed. The sky plot of these GNSS satellites can be seen in Figure 1. The reason using short baseline is that we can avoid the impact of other errors, so that we can analyze purely the impact of the observation structure. In the data processing the reference satellites are chosen independently for three GNSS constellations, thus 5 satellites are randomly selected for the trial forming 56, 21 and 21 combinations respectively for each GNSS system. The statistical analysis of the PDOP values, condition numbers and positioning stability for every combination are shown in
Figure 2 and Table 1. The PDOP values and the condition numbers are the means of
the values from all epochs. The standard deviation (STD) indicates the positioning stability of the positioning result during the trial period.
90° 75° 60° 45°30°15° 0° North
South
West East
60° 30°
120°
150° 330°
300°
210° 240°
G06
G14 G16
G23
G29
G30
G31
G32
C01 C02
C03
C04 C07
C08 C10
R06 R07
R09 R15
R16
R17
(a) GPS
(b) BDS
(c) GLONASS
Figure 2. STD of GPS/BDS/GLONASS positioning, PDOP values and condition numbers.
The correlation (i.e. the correlation coefficient, which is used to measuring the degree of correlation between two variables. The closer the correlation coefficient is
to 1 or –1 the greater the correlation.) between PDOP, condition number and standard
[image:8.595.183.426.69.533.2]deviation of each system is estimated and listed in Table 1.
Table 1. Correlation coefficients of PDOP, condition number and standard deviation for GPS/BDS/GLONASS.
GPS (56) BDS (21) GLONASS (21)
Corr. (COND-STD) 0.920 0.986 0.963
Corr. (PDOP-STD) 0.293 0.925 -0.037
From Figure 2 and Table 1, it could be concluded that whether it is the 56 different combinations of GPS or 21 combinations of BDS or GLONASS, the condition
0 8 16 24 32 40 48 56
0 20 40 60
S
TD
[
m
m
]
0 8 16 24 32 40 48 56
0 120 240 360
C
O
N
D
0 8 16 24 32 40 48 56
0 20 40 60
Baseline Number
P
D
O
P
0 3 6 9 12 15 18 21
0 60 120 180
S
TD
[
m
m
]
0 3 6 9 12 15 18 21
0 1,000 2,000 3,000
C
O
N
D
0 3 6 9 12 15 18 21
0 300 600 900
Baseline Number
P
D
O
P
0 3 6 9 12 15 18 21
0 30 60 90
S
TD
[
m
m
]
0 3 6 9 12 15 18 21
0 900 1,800 2,700
C
O
N
D
0 3 6 9 12 15 18 21
0 12 24 36
Baseline Number
P
D
O
number proves to be a better indicator of the positioning stability. The correlation coefficient of the condition number and positioning standard deviation reach 0.920, 0.986 and 0.963 respectively for each system. Therefore the correlation statistics shown in Table 1 indicate that the condition number is a more reliable indicator of the positioning stability than the PDOP when the same numbers of satellites are observed.
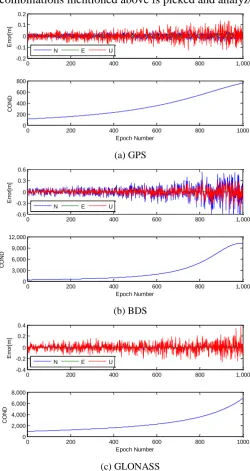
A more detailed analysis to the effectiveness of the condition number with the positioning stability is shown in Figure 3, where the worst set of the mean condition number from the combinations mentioned above is picked and analyzed.
(a) GPS
(b) BDS
[image:9.595.174.425.190.662.2](c) GLONASS
Figure 3. GPS/BDS/GLONASS positioning result with maximum mean condition number.
Figure 3 indicates that large condition number results in poor positioning stability. In this case all the observation structures from the three systems become worse. That is to say the condition number is increasing. The positioning error and fluctuation also increase, reaching decimeter level, which further demonstrates that the condition number is a valid indicator of positioning stability.
0 200 400 600 800 1,000
-0.2 -0.1 0 0.1 0.2
E
rr
o
r[
m
]
0 200 400 600 800 1000
0 200 400 600 800
C
O
N
D
Epoch Number
N E U
0 200 400 600 800 1,000
-0.6 -0.3 0 0.3 0.6
E
rr
o
r[
m
]
0 200 400 600 800 1,000
0 3,000 6,000 9,000 12,000
C
O
N
D
Epoch Number
N E U
0 200 400 600 800 1,000
-0.4 -0.2 0 0.2 0.4
E
rr
o
r[
m
]
0 200 400 600 800 1000
0 2,000 4,000 6,000 8,000
C
O
N
D
Epoch Number
4. USING MINIMUM CONDITION NUMBER TO DETERMINE THE OPTIMAL OBSERVATION STRUCTURE. It is apparent that reducing the ill-conditioned level of the observation equation plays a vital role in improving positioning accuracy and stability. Many publications have discussed this matter from a mathematical point of view, such as ridge estimation and singular value decomposition method (Li et al., 2010; Wen et al., 2012; Shen and Li, 2007). Its principles lie in decreasing the ill-posed characteristics of the covariance matrix by modifying the normal equation. Yet most of these methods focus on transforming the existing covariance matrix rather than its fundamental source, i.e., the structure of the observation equation.
The determination of the reference satellites is an essential part of solving for the carrier phase double difference positioning solution. A common procedure would be selecting reference satellites with the maximum elevation, due to concerns of reduced observation precision caused by atmospheric delay between stations of long baselines. Yet short or even very short baselines are still very common in daily applications. In these cases, the station-difference observations at different elevations show no obvious difference. Hence no noticeable impact on the observation equation could be recognized from the different elevation reference satellites. Nonetheless, a relatively fewer number of satellites could be observed in the harsh observation environments. The different selection of reference satellites would therefore result in significant changes to satellite pair distribution. We could see from Equation (8) that the positioning accuracy is not only relevant to the accuracy of observationsL, but also affected by the design matrixB. Variance matrix Dis commonly used for the evaluation of positioning accuracy, as shown below:
1
0 0 ( )
T
D Q B PB (11)
Of which 0is the posterior mean square error of unit weight, whose value is decided by the observation accuracy. From Equation (11), we could see that the positioning accuracy might change by altering the design matrix from selecting different reference satellites, while Equation (10) indicates that the condition number of the co-factor matrix Q reflects the system resistance to error. Thus the condition number proves to be a valid criterion for selecting reference satellites. Or it can be interpreted that in the harsh environments, observation structure is more important compared with the difference of observations due to the different choice of the reference satellites.
13 12
23 32
43 42
3 2
1 1 0 0
0 1 0 0
0 1 1 0 0
0 0 0
0 1 0 0 1
n n
N N
N N
N N
N N
(12)
The effect of the condition number based method can be simplified as in Figure 4 and Figure 5, where the green circle and the red circle stand for the reference and non-reference satellites respectively. Figure 4 represents the conventional maximum
elevation method (MAEA method for short in this paper), whilst Figure 5 represents
the minimum condition number method (MICN method for short in this paper)
proposed in this paper. As we can see, the MICN method dedicated to make the best distribution of satellite pairs, so that the calculating system has much improved structure in the DD positioning.
Figure4. Outline effect of the MAEA method (left). Figure5. Outline effect of the MICN method (right).
In the practical application of the condition number for the reference satellite selection, the length of the baseline is needed to be taken into account. That is to say we need set a certain cut-off elevation angle for the reference satellites. This is due to the atmospheric delay, satellite ephemeris and other residual errors, for different baseline length, the accuracy of station-difference observations from the same-elevation satellites are also different. The longer the baseline is, the lower the accuracy of the observations. If a satellite with low-accuracy observation is treated as the reference satellite, the large errors will be introduced into the positioning results
(Wang et al., 1998; Gendt et al., 2003; Ge et al., 2008). We can use some experiential
index about this. When the baseline is longer than 50km, an angle between 35and 40 degrees can be used as the cut-off elevation angle for the selection of the reference satellite. When the baseline is between 20km than 50km, an angle between 25and 35 degrees can be used. If a baseline is less than 20km, we can set the cut-off angle between 15 and 25 degrees. Of course, this is just a suggestive indicator. In practice, it can be adjusted according to actual situation.
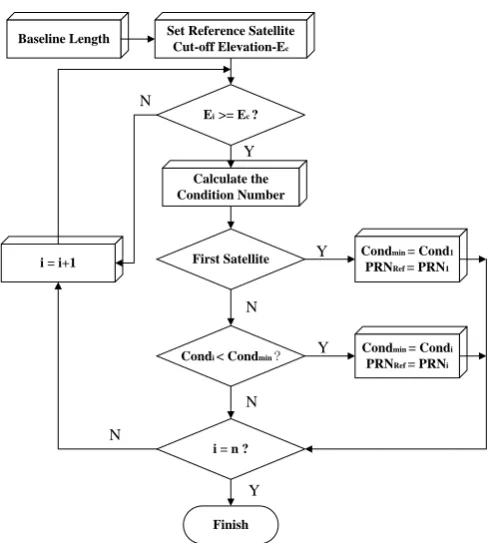
minimum condition number of the calculation system. It needs to note that the three reference satellites are integrally solved so as to find the optimal combination. The calculation loop is specifically defined by the following steps:
(1) According to the baseline length, set a cut-off elevation angle for the selection of reference satellites;
(2) Calculate the condition number of norm matrix when each qualified satellite is treated as a reference satellite in order. Then we can select the satellite with the minimum condition number as the reference satellite;
(3) Judge whether the reference satellite determined in Step (2) is the same as the prior reference satellite. If they are different, we need transfer the DD ambiguities according to Equation (11);
(4) Repeat Step (2) and Step (3) by a time interval (such as 5 to 10 minutes);
(5) If the time duration has not yet approached the time interval set in Step (4) and the reference satellite does not meet the condition of cut-off elevation angle, repeat all the above steps.
[image:12.595.176.421.338.610.2]The above procedure is further illustrated in Figure 6.
Figure 6. Flowchart of the observation structure optimization based on the MICN method.
In Figure 6, i is the satellite index; Ec is the cut-off elevation angle of reference satellites; Ei is the elevation angle of satellite i; n is the number satellite number;
min
Cond is the minimum condition number; Condi is the condition number when
satellite i is treated as the reference,PRNRef and PRNi are the PRN numbers of the reference satellite and the ith satellite respectively.
The new method proposed in this paper of course maybe to take a little more time than the MAEA method due to the circular computations. When the numbers of candidate reference satellites from each GNSS are all six, each search of reference
Baseline Length
Calculate the Condition Number
First Satellite Y Condmin = Cond1 PRNRef = PRN1
N
Condi < Condmin ? Y Cond min = Condi
PRNRef = PRNi
i = i+1
i = n ?
Finish Ei >= Ec ?
Y
Y N
N
Set Reference Satellite Cut-off Elevation-Ec
satellites will take our normal PC (CPU: 3.3GHz, RAM: 3.19G) 0.04 s on average for the new method. As we know, such a little computational burden has little negative effect on practical application.
5. METHODOLOGY VALIDATION IN THE HARSH ENVIRONMENTS. The number of observable satellites increases significantly when a combination of multi-constellations is used for positioning (Figure 7 shows the global distribution of GPS/BDS/GLONASS at a certain epoch), thus signal blockage caused by the surrounding environment would not lead to insufficient observable satellite number. However, it will change the satellite spatial distribution and affect GNSS positioning accuracy and stability. Besides, in different geo-locations, the situations will be different. Especially in high-latitude area, such as in UK, Norway, Finland and so on, the satellite observation environment is more complex because just few satellites pass through the very high-latitude area. This leads to the situation that there is always a big vacancy on the visible satellites sky plot in the high-latitude area (Meng et al., 2004). This paper simulates azimuth shielding, elevation shielding and strip shielding of satellites commonly seen in GNSS application. This mainly includes 270 degree internal building shielding, strip shielding in strip foundation work or in urban canyons, and construction foundation or building patio environment with a large cut-off elevation shielding. Each kind of blockage will be tried in a medium-latitude area and a high-latitude area, and in this paper Nanjing (about northern latitude of 32 degrees) in China and Nottingham (about northern latitude of 53 degrees) in the UK are selected to represent the two different latitudes. The experimental data acquired in Nanjing is the same as the data used in Section 3, and the GPS/BDS/GLONASS data (1s interval) in Nottingham was collected in the University of Nottingham on 26 October 2013. The lengths of the used short baselines are all about 3 km.
[image:13.595.169.430.548.689.2]For each trial, the positioning results obtained by applying the conventional MAEA method and the proposed MICN method for observation structure determination are compared. The positioning results, condition number and PDOP values are statistically calculated for each case.
Figure 7. Distribution of GPS/BDS/GLONASS.
Trial 1: Figure 8 is one of the worst cases for GNSS applications. A typical scenario is 270 degree azimuth shielding, and in such circumstances we can only observe about a quarter of satellites. The sky plots in the two places are shown in Figure 8. The
-180 -150 -120 -90 -60 -30 0 30 60 90 120 150 180 -90
-60 -30 0 30 60 90
Geotedic Longitude /°
G
e
o
te
d
ic
L
a
ti
tu
d
e
/
°
shielding effects of each situation with two methods (MAEA and MICN) are
illustrated in Figure 9. The visible satellite number, mean PDOP value and condition
number are listed in Table 2.
[image:14.595.110.491.127.270.2]
(a)Satellite sky plot in Nanjing, China (b) Satellite sky plot in Nottingham, UK Figure 8. Sky plots indicating 270-degree blockage.
[image:14.595.95.502.579.746.2](a)Error distribution in Nanjing, China (b) Error distribution in Nottingham, UK Figure 9. Positioning error distribution for 270 degree blockage.
Table 2. Satellite number, condition number, positioning result and PDOP value for 270 degree.
Nanjing Nottingham
SV no G C R G C R
4 0 3 4 0 3
PDOP 3.7 11.6
Method MAEA MICN MAEA MICN
Ref-Sat G30-R06 G16-R09 G27-R19 G19-R10
COND 182.7 131.0 74.4 21.4
STD[mm] Dir
N E U N E U N E U N E U
7.3 26.3 24.7 6.8 22.0 18.2 11.7 16.2 18.7 11.6 10.3 13.9
Pos 36.8 29.4 27.4 20.8
*: G is short for GPS, C for COMPASS (BDS), R for GLONASS, Dir for Direction, 90° 75° 60° 45° 30°15° 0°
North South West East 60° 30° 120° 150° 330° 300° 210° 240° G16 G23 G30 G32R06 R07 R09
90° 75° 60° 45°30°15° 0° North South West East 60° 30° 120° 150° 330° 300° 210° 240° G03 G07 G19 G27 R10 R19 R20
Station:NGB6 Visible Satellite
-0.050 0 0.05
100 200 Error /m C o u n t North MAEA Method MICN Method
-0.060 -0.04 -0.02 0 0.02 0.04 0.06 200 400 Error /m C o u n t East MAEA Method MICN Method
-0.060 -0.04 -0.02 0 0.02 0.04 0.06 100 200 Error /m C o u n t Up MAEA Method MICN Method -0.030 -0.02 -0.01 0 0.01 0.02 0.03
100 200 Error /m C o u n t North MAEA Method MICN Method
-0.10 -0.05 0 0.05 0.1 100 200 Error /m C o u n t East MAEA Method MICN Method
-0.080 -0.06 -0.04 -0.02 0 0.02 0.04 0.06 0.08 100 200 Error /m C o u n t Up MAEA Method MICN Method
0 20 40 60 80 100
0 0.1 0.2 0.3 0.4 0.5 0.6 0.7 0.8 0.9 1 MAEA Method MICN Method
0 20 40 60 80 100
0 0.1 0.2 0.3 0.4 0.5 0.6 0.7 0.8 0.9 1 MAEA Method MICN Method
0 20 40 60 80 100
0 0.1 0.2 0.3 0.4 0.5 0.6 0.7 0.8 0.9 1 MAEA Method MICN Method
0 20 40 60 80 100
0 0.1 0.2 0.3 0.4 0.5 0.6 0.7 0.8 0.9 1 MAEA Method MICN Method
0 20 40 60 80 100
0 0.1 0.2 0.3 0.4 0.5 0.6 0.7 0.8 0.9 1 MAEA Method MICN Method
0 20 40 60 80 100
0 0.1 0.2 0.3 0.4 0.5 0.6 0.7 0.8 0.9 1 MAEA Method MICN Method
0 0.2 0.4 0.6 0.8 1 1.2 1.4 1.6 1.8 2
0 0.2 0.4 0.6 0.8 1 1.2 1.4 1.6 1.8 2 Error [m]
0 0.2 0.4 0.6 0.8 1 1.2 1.4 1.6 1.8 2
0 0.2 0.4 0.6 0.8 1 1.2 1.4 1.6 1.8 2 Error [m]
0 0.2 0.4 0.6 0.8 1 1.2 1.4 1.6 1.8 2
0 0.2 0.4 0.6 0.8 1 1.2 1.4 1.6 1.8 2 Error [m]
0 0.2 0.4 0.6 0.8 1 1.2 1.4 1.6 1.8 2
0 0.2 0.4 0.6 0.8 1 1.2 1.4 1.6 1.8 2 Error [m]
0 0.2 0.4 0.6 0.8 1 1.2 1.4 1.6 1.8 2
0 0.2 0.4 0.6 0.8 1 1.2 1.4 1.6 1.8 2 Error [m]
0 0.2 0.4 0.6 0.8 1 1.2 1.4 1.6 1.8 2
Pos for Position same below.
In the Nanjing experiment, satellites G30 and R06 were selected for the MAEA method as shown in Figure 8, and the satellites selected for the new method were G16 and R09. The mean condition number for each method is 182.7 and 131.0 respectively. The observation structure was significantly improved by the new method and positioning accuracy was improved by 20.2%. In the Nottingham experiment, G27 and R19 were selected for the MAEA method; whilst G19 and R10 were selected for the MICN method. The overall positioning accuracy was improved by 24.1%. From Figure 8(b), we can see that the non-reference satellites were separated evenly around the reference satellites in east-west direction, so the positioning accuracy in east-west direction was especially improved by 36.4%.What is more, the larger-elevation and the smaller-elevation satellites were also separated more evenly around the reference satellites, so the up-direction positioning accuracy was also improved significantly around 25%. As shown above, by implementing the condition number based method for determining the reference satellites in the obstructed and unevenly distributed environments, with increased satellite utilization as well as a result of using optimal observation equation, more accurate positioning result and better stability could be achieved.
Trial 2: This is to simulate the application scenarios such as positioning in a deep valley where satellites below certain elevation angles could not be observed. Figure 10 shows the sky plots in two different locations with a cut-off elevation angle of 50 degrees. Their directional accuracy statistics are shown in Figure 11 (a) and (b).Satellite numbers, condition number, positioning accuracy and mean PDOP are list in Table 3.
[image:15.595.115.480.469.624.2]
(a)Satellite sky plot in Nanjing, China (b) Satellite sky plot in Nottingham, UK
Figure 10. Sky plots for a cut-off elevation angle of 50 degrees. 90° 75° 60° 45°30°15° 0°
North
South
West East
60° 30°
120°
150° 330°
300°
210° 240°
G16 G30
G31
C03 C07
C08 C10
Station:P206 Visible Satellite
90° 75° 60° 45°30°15° 0° North
South
West East
60° 30°
120°
150° 330°
300°
210° 240°
G03 G06 G19
G22 G27 R04
(a)Error distribution in Nanjing, China (b) Error distribution in Nottingham, UK
Figure 11. Positioning error distribution for 50 degrees elevation cut-off angle. Table 3. Satellite number, condition number, positioning result and PDOP value for 50
degrees elevation cut-off angle.
Nanjing Nottingham
SV no G C R G C R
3 4 0 5 0 2
PDOP 4.2 11.4
Method MAEA MICN MAEA MICN
Ref-Sat G30-C07 G30-C10 G19-R19 G27-R19
COND 35.5 32.0 217.3 40.8
STD[mm] Dir
N E U N E U N E U N E U
5.8 5.6 19.3 3.7 5.1 19.4 9.7 9.8 40.2 9.4 10.3 31.2
Pos 20.9 20.4 42.5 34.3
From results shown in Figure 11 (a) and Table 3, we could see that the new method shows no significant improvement on observation structure and positioning accuracy in the Nanjing experiment. This is mainly due to that the satellites are better evenly distributed in elevation shielding scenarios. Therefore the MICN method and the MAEA method of optimizing observation structure are fundamentally the same in such cases. In the Nottingham experiment, there were few satellites in the north of the visible satellites sky plot and the distribution of satellites was uneven extremely. The mean PDOP reached 11.4. Form Figure 11 (b) and Table 3 we can see that the MICN method improved the positioning accuracy especially in the up direction by 22%.
Trial 3: Visual strips and strip shielding scenarios are a combination of directional and elevation blockage. Visual bands usually occur in strip foundation work or in urban canyons. The chosen sky plots for this scenario in the two places are shown in Figure 12(a) and Figure 12(b). The directional accuracies are as Figure 13. Positional
-0.020 -0.015 -0.01 -0.005 0 0.005 0.01 0.015 0.02 100 200 Error /m C o u n t North MAEA Method MICN Method
-0.020 -0.015 -0.01 -0.005 0 0.005 0.01 0.015 0.02 100 200 Error /m C o u n t East MAEA Method MICN Method
-0.080 -0.06 -0.04 -0.02 0 0.02 0.04 0.06 0.08 100 200 Error /m C o u n t Up MAEA Method MICN Method
-0.040 -0.03 -0.02 -0.01 0 0.01 0.02 0.03 0.04 100 200 Error /m C o u n t North MAEA Method MICN Method
-0.050 0 0.05
200 400 Error /m C o u n t East MAEA Method MICN Method
-0.20 -0.15 -0.1 -0.05 0 0.05 0.1 0.15 0.2 200 400 Error /m C o u n t Up MAEA Method MICN Method
0 20 40 60 80 100
0 0.1 0.2 0.3 0.4 0.5 0.6 0.7 0.8 0.9 1 MAEA Method MICN Method
0 20 40 60 80 100
0 0.1 0.2 0.3 0.4 0.5 0.6 0.7 0.8 0.9 1 MAEA Method MICN Method
0 20 40 60 80 100
0 0.1 0.2 0.3 0.4 0.5 0.6 0.7 0.8 0.9 1 MAEA Method MICN Method
0 20 40 60 80 100
0 0.1 0.2 0.3 0.4 0.5 0.6 0.7 0.8 0.9 1 MAEA Method MICN Method
0 20 40 60 80 100
0 0.1 0.2 0.3 0.4 0.5 0.6 0.7 0.8 0.9 1 MAEA Method MICN Method
0 20 40 60 80 100
0 0.1 0.2 0.3 0.4 0.5 0.6 0.7 0.8 0.9 1 MAEA Method MICN Method
0 0.2 0.4 0.6 0.8 1 1.2 1.4 1.6 1.8 2
0 0.2 0.4 0.6 0.8 1 1.2 1.4 1.6 1.8 2 Error [m]
0 0.2 0.4 0.6 0.8 1 1.2 1.4 1.6 1.8 2
0 0.2 0.4 0.6 0.8 1 1.2 1.4 1.6 1.8 2 Error [m]
0 0.2 0.4 0.6 0.8 1 1.2 1.4 1.6 1.8 2
0 0.2 0.4 0.6 0.8 1 1.2 1.4 1.6 1.8 2 Error [m]
0 0.2 0.4 0.6 0.8 1 1.2 1.4 1.6 1.8 2
0 0.2 0.4 0.6 0.8 1 1.2 1.4 1.6 1.8 2 Error [m]
0 0.2 0.4 0.6 0.8 1 1.2 1.4 1.6 1.8 2
0 0.2 0.4 0.6 0.8 1 1.2 1.4 1.6 1.8 2 Error [m]
0 0.2 0.4 0.6 0.8 1 1.2 1.4 1.6 1.8 2
[image:16.595.93.505.368.535.2]accuracy, satellite number, condition number and mean PDOP values are listed Table 4.
[image:17.595.126.487.112.256.2]
(a)Satellite sky plot in Nanjing, China (b) Satellite sky plot in Nottingham, UK Figure 12. Sky plots of East-West blockage.
[image:17.595.100.500.297.518.2](a)Error distribution in Nanjing, China (b) Error distribution in Nottingham, UK Figure 13. Positioning error distribution for East-West blockage.
Table 4. Satellite number, condition number, positioning result and PDOP of East-West blockage.
Nanjing Nottingham
SV no G C R G C R
3 5 1 4 0 4
PDOP 2.7 3.1
Method MAEA MICN MAEA MICN
Ref-Sat G30-C07 G30-C10 G01-R21 G11-R06
COND 48.4 31.2 50.6 17.8
STD[mm] Dir
N E U N E U N E U N E U
4.2 5.1 14.0 2.6 4.5 9.6 5.6 6.9 17.5 4.8 6.0 9.9
Pos 15.5 10.9 19.6 12.6
90° 75° 60° 45°30°15° 0° North South West East 60° 30° 120° 150° 330° 300° 210° 240° G06 G30 G31 C01 C03 C07 C08 C10 R16
90° 75° 60° 45°30°15° 0° North South West East 60° 30° 120° 150° 330° 300° 210° 240° G01 G11 G19 G32 R05 R06 R20 R21
Station:NGB6 Visible Satellite
-0.020 -0.015 -0.01 -0.005 0 0.005 0.01 0.015 0.02 200 400 Error /m C o u n t North MAEA Method MICN Method
-0.020 -0.015 -0.01 -0.005 0 0.005 0.01 0.015 0.02 100 200 Error /m C o u n t East MAEA Method MICN Method
-0.050 0 0.05
100 200 Error /m C o u n t Up MAEA Method MICN Method
-0.020 -0.015 -0.01 -0.005 0 0.005 0.01 0.015 0.02 100 200 Error /m C o u n t North MAEA Method MICN Method
-0.030 -0.02 -0.01 0 0.01 0.02 0.03 100 200 Error /m C o u n t East MAEA Method MICN Method
-0.060 -0.04 -0.02 0 0.02 0.04 0.06 200 400 Error /m C o u n t Up MAEA Method MICN Method
0 20 40 60 80 100
0 0.1 0.2 0.3 0.4 0.5 0.6 0.7 0.8 0.9 1 MAEA Method MICN Method
0 20 40 60 80 100
0 0.1 0.2 0.3 0.4 0.5 0.6 0.7 0.8 0.9 1 MAEA Method MICN Method
0 20 40 60 80 100
0 0.1 0.2 0.3 0.4 0.5 0.6 0.7 0.8 0.9 1 MAEA Method MICN Method
0 20 40 60 80 100
0 0.1 0.2 0.3 0.4 0.5 0.6 0.7 0.8 0.9 1 MAEA Method MICN Method
0 20 40 60 80 100
0 0.1 0.2 0.3 0.4 0.5 0.6 0.7 0.8 0.9 1 MAEA Method MICN Method
0 20 40 60 80 100
0 0.1 0.2 0.3 0.4 0.5 0.6 0.7 0.8 0.9 1 MAEA Method MICN Method
0 0.2 0.4 0.6 0.8 1 1.2 1.4 1.6 1.8 2
0 0.2 0.4 0.6 0.8 1 1.2 1.4 1.6 1.8 2 Error [m]
0 0.2 0.4 0.6 0.8 1 1.2 1.4 1.6 1.8 2
0 0.2 0.4 0.6 0.8 1 1.2 1.4 1.6 1.8 2 Error [m]
0 0.2 0.4 0.6 0.8 1 1.2 1.4 1.6 1.8 2
0 0.2 0.4 0.6 0.8 1 1.2 1.4 1.6 1.8 2 Error [m]
0 0.2 0.4 0.6 0.8 1 1.2 1.4 1.6 1.8 2
0 0.2 0.4 0.6 0.8 1 1.2 1.4 1.6 1.8 2 Error [m]
0 0.2 0.4 0.6 0.8 1 1.2 1.4 1.6 1.8 2
0 0.2 0.4 0.6 0.8 1 1.2 1.4 1.6 1.8 2 Error [m]
0 0.2 0.4 0.6 0.8 1 1.2 1.4 1.6 1.8 2
[image:17.595.90.508.571.738.2]The visualization band in the blockage scenario shown in Figure 13(a) and Figure 13(b) is very narrow. In the Nanjing experiment, the reference satellites selected with the MAEA method were G30 and C07, while satellite C10 was selected as the BDS reference satellite for the MICN method. The positional accuracy and stability have
been improved significantly in both north and up directions. The positional accuracy
has been improved by 29.7% compared to the conventional method. A similar improvement has been achieved in the Nottingham experiment, in which the positional accuracy improved by 35.7%.
From the above experiments in the two places, we can conclude that the MICN method demonstrates much better improvement for the observation structure when positioning in the harsh observation environments, especially for the up direction. Actually, in the harsh observation environments, the satellites with maximum elevation angles are generally not the most central satellites. With the MICN method, reference satellites are chosen to make the whole satellite pairs in an optimal distribution.
6. CONCLUSIONS. This paper studies the evaluation criterion and improvement method for GPS/BDS/GLONASS positioning accuracy and stability in the harsh environments based on GNSS observation structure. Main conclusions are as follows:
In GNSS carrier phase DD positioning model, the correlation problem between DD equations caused by the satellite spatial distribution is equivalent to an ill-conditioned problem. In such cases, the condition number is a better evaluation index for observation structure and positioning accuracy than the PDOP values. The smaller the condition number, the more stable the observation structure, and vice versa;
The minimum condition number is mathematically a better criterion than the elevation angle for determining reference satellites, as it optimizes the observation structure in a way that fits the DD model better. The selected observation equations hence have better error-resistance capacity, resulting in higher positioning accuracy and more stable outputs.
In scenarios where visible satellites are seriously reduced and unevenly distributed, use of the condition number method to determine the reference satellites can significantly improve GNSS observation stability, positional and directional accuracy.
ACKNOWLEDGEMENTS
This work was supported by the National Natural Science Foundation of China (grant number 41074021). The authors are very grateful to the anonymous reviewers for their constructive comments and suggestions.
REFERENCES
Wellesley-Cambridge Press, USA, pp. 461.
Chang, T. H., Wang, L. S., & Chang, F. R. (2009). A solution to the ill-conditioned GPS positioning problem in an urban environment. Intelligent Transportation
Systems, IEEE Transactions on, 10(1), 135-145.
Cline, A. K., Moler, C. B., Stewart, G. W., & Wilkinson, J. H. (1979). An estimate for the condition number of a matrix. SIAM Journal on Numerical Analysis, 16(2), 368-375.
DeLoach, S. R. (1989). Continuous deformation monitoring with GPS. Journal of Surveying Engineering, 115(1), 93-110.
Farooq, M., & Salhi, A. (2011). Improving the solvability of ill-conditioned systems of linear equations by reducing the condition number of their matrices. J. Korean Math. Soc, 48(5), 939-952.
Ge, M., Gendt, G., Dick, G., & Zhang, F. P. (2005). Improving carrier-phase
ambiguity resolution in global GPS network solutions. Journal of Geodesy, 79(1-3),
103-110.
Ge, M., Gendt, G., Rothacher, M., Shi, C., & Liu, J. (2008). Resolution of GPS carrier-phase ambiguities in precise point positioning (PPP) with daily observations.
Journal of Geodesy, 82(7), 389-399.
Gendt, G., Dick, G., Reigber, C. H., Tomassini, M., Liu, Y., & Ramatschi, M. (2003). Demonstration of NRT GPS water vapor monitoring for numerical weather prediction in Germany. J Meteo Societ Jap, 82(1B), 360-370.
Glonass, I. C. D. (2002). GLONASS ICD. Russian Space Agency, Version,5, 2002.
Hansen, P. C. (1992). Analysis of discrete ill-posed problems by means of the L-curve.
SIAM review, 34(4), 561-580.
Hoque, M. M., & Jakowski, N. (2007). Higher order ionospheric effects in precise GNSS positioning. Journal of Geodesy, 81(4), 259-268.
Huang, D. W., Dai, W. J., & Luo, F. X. (2012). ICA Spatiotemporal Filtering Method and Its Application in GPS Deformation Monitoring. Applied Mechanics and Materials, 204, 2806-2812.
Li, B., Shen, Y., & Feng, Y. (2010). Fast GNSS ambiguity resolution as an ill-posed problem. Journal of Geodesy, 84(11), 683-698.
Li, L., & Kuhlmann, H. (2012). Real-time deformation measurements using time series of GPS coordinates processed by Kalman filter with shaping filter. Survey Review, 44(326), 189-197.
Loyer, S., Perosanz, F., Mercier, F., Capdeville, H., & Marty, J. C. (2012). Zero-difference GPS ambiguity resolution at CNES–CLS IGS Analysis Center.
Journal of Geodesy, 86(11), 991-1003.
Meng, X. (2013). From Structural Health Monitoring to Geo-Hazard Early Warning: An Integrated Approach Using GNSS Positioning Technology. In Earth Observation
of Global Changes (EOGC) (pp. 285-293). Springer Berlin Heidelberg.
333-359). New York: IEP.
Pratt, M., Burke, B., & Misra, P. (1998, September). Single-epoch integer ambiguity resolution with GPS-GLONASS L1-L2 Data. In PROCEEDINGS OF ION GPS
(Vol. 11, pp. 389-398). INSTITUTE OF NAVIGATION.
Shen, Y. Z., & Li, B. F. (2007). Regularized solution to fast GPS ambiguity resolution.
Journal of Surveying Engineering, 133(4), 168-172.
Takasu, T., & Yasuda, A. (2008). Evaluation of RTK-GPS performance with low-cost single-frequency GPS receivers. In Proceedings of international symposium on
GPS/GNSS (pp. 852-861).
Theiss, A., Yen, D. C., & Ku, C. Y. (2005). Global Positioning Systems: an analysis of applications, current development and future implementations. Computer Standards & Interfaces, 27(2), 89-100.
Walsh, D., & Daly, P. (1996, September). GPS and GLONASS carrier phase ambiguity resolution. In Proceedings of the 9th International Technical Meeting of
the Satellite Division of The Institute of Navigation (ION GPS 1996) (pp. 899-907).
Wang, J. (2000). An approach to GLONASS ambiguity resolution. Journal of Geodesy, 74(5), 421-430.
Wang, J., Stewart, M. P., & Tsakiri, M. (1998). Stochastic modeling for static GPS baseline data processing. Journal of Surveying Engineering, 124(4), 171-181.
Wang, Z., Rizos, C., & Lim, S. (2006). Single epoch algorithm based on Tikhonov regularization for deformation monitoring using single frequency GPS receivers.
Survey Review, 38(302), 682-688.
Wanninger, L. (2012). Carrier-phase inter-frequency biases of GLONASS receivers.
Journal of Geodesy, 86(2), 139-148.
Wen, D., Wang, Y., & Norman, R. (2012). A new two-step algorithm for ionospheric tomography solution. GPS solutions, 16(1), 89-94.
Wing, M. G., Eklund, A., & Kellogg, L. D. (2005). Consumer-grade global positioning system (GPS) accuracy and reliability. Journal of Forestry,103(4), 169-173.
Yang, Y., Li, J., Xu, J., Tang, J., Guo, H., & He, H. (2011). Contribution of the compass satellite navigation system to global PNT users. Chinese Science Bulletin,
56(26), 2813-2819.
Yang, Y. X., He, H. B., & Xu, G. C. (2001). Adaptively robust filtering for kinematic geodetic positioning. Journal of Geodesy, 75(2-3), 109-116.
Yetkin, M., & Berber, M. (2012). Application of the Sign-Constrained Robust Least-Squares Method to Surveying Networks. Journal of Surveying Engineering,
139(1), 59-65.
Yuan, D., Cui, X., Fan, D., Feng, W., & Yu, Y. (2010, March). Application of Kalman Filter Method to the Date Processing of GPS Deformation Monitoring. In Education Technology and Computer Science (ETCS), 2010 Second International Workshop on