For Peer Review
The Last Scottish Ice SheetJournal: Earth and Environmental Science Transactions of the Royal Society of Edinburgh
Manuscript ID TRE-2017-0022.R1
Manuscript Type: The Quaternary of Scotland
Date Submitted by the Author: n/a
Complete List of Authors: Ballantyne, Colin; University of St Andrews, Geography and Sustainable Development
Small, David; Durham University, Department of Geography
Keywords:
British-Irish Ice Sheet, Deglaciation, Dimlington Stade, Ice streams, Late Devensian, Radiocarbon dating, Readvances, Terrestrial cosmogenic nuclide dating
For Peer Review
The Last Scottish Ice Sheet
Colin K. Ballantyne
1and David Small
21
School of Geography and Sustainable Development, University of St Andrews, St Andrews KY16 9AL, UK. Corresponding Author ([email protected])
2
Department of Geography, Durham University, Lower Mountjoy, South Road, Durham DH1 3LE, UK.
For Peer Review
ABSTRACT: The last Scottish Ice Sheet (SIS) expanded from a pre-existing ice cap after ~35 ka.
Highland ice dominated, with subsequent build up of a Southern Uplands ice mass. The Outer
Hebrides, Skye, Mull, the Cairngorms and Shetland supported persistent independent ice centres.
Expansion was accompanied by ice-divide migration and switching flow directions. Ice
nourished in Scotland reached the Atlantic Shelf break in some sectors but only mid-shelf in
others, was confluent with the Fennoscandian Ice Sheet (FIS) in the North Sea Basin, extended
into northern England, and fed the Irish Sea Ice Stream and a lobe that reached East Anglia. The
timing of maximum extent was diachronous, from ~30–27 ka on the Atlantic Shelf to ~22–21 ka
in Yorkshire. The SIS buried all mountains, but experienced periods of thickening alternating
with drawdown driven by ice streams such as the Minch, Hebrides and Moray Firth Ice Streams.
Submarine moraine banks indicate oscillating retreat and progressive decoupling of Highland ice
from Orkney-Shetland ice. The pattern and timing of separation of the SIS and FIS in the North
Sea Basin remain uncertain. Available evidence suggests that by ~17 ka, much of the Sea of the
Hebrides, Outer Hebrides, Caithness and the coasts of E Scotland were deglaciated. By ~16 ka
the Solway lowlands, Orkney and Shetland were deglaciated, the SIS and Irish Ice Sheet had
separated, the ice margin lay along the western seaboard, nunataks had emerged in Wester Ross,
the ice margin lay N of the Cairngorms and the sea had invaded the Tay and Forth estuaries. By
~15 ka most of the Southern Uplands, Firth of Clyde, Midland Valley and upper Spey valley
were deglaciated, and in NW Scotland ice was retreating from fjords and valleys. By the onset of
rapid warming at ~14.7 ka, much of the remnant SIS was confined within the limits of Younger
Dryas glaciation. The SIS therefore lost most of its mass during the Dimlington Stade. It is
uncertain whether fragments of the SIS persisted on high ground throughout the Lateglacial
Interstade.
KEY WORDS: British-Irish Ice Sheet; deglaciation; Dimlington Stade; flowsets; ice streams;
Late Devensian; lithostratigraphy; radiocarbon dating; readvances; terrestrial cosmogenic nuclide
For Peer Review
The last Scottish Ice Sheet (SIS) was the dominant component of the last British-Irish Ice Sheet (BIIS), and for much of its existence extended far beyond the present land area of Scotland. Here we use 'SIS' to refer to glacier ice nourished in Scotland during the period ~35–14 ka, which incorporates the later part of Marine Isotope Stage (MIS) 3 and most of MIS 2. During much of this period the SIS was confluent with ice sourced in England, Wales, Ireland and Norway, but remained an independent, though complex, centre of ice dispersal; there is no convincing evidence that external ice encroached on the present land area of Scotland. We use the abbreviation LGM to denote the last global glacial maximum of ~26.5 ka to ~19 ka (P. U. Clark
et al. 2009) and LLGM (local last glacial maximum) to refer to the maximum extent of different sectors of the last SIS, some of which reached their outermost limits millennia before others.
Over the past two decades, our understanding of the extent, dynamics and chronology of the SIS has undergone radical transformation. Not only is it now accepted that the ice sheet was much more extensive than previously believed, but it has also been shown that it was drained by fast-flowing ice streams, exhibited marked changes in configuration and flow patterns, and experienced numerous readvances as the ice margin retreated from its outermost reach. This transformation largely reflects the application of new approaches, notably: (1) increasing use of offshore bathymetric, seismostratigraphic and borehole evidence to reconstruct events relating to the extent and retreat of the ice sheet on the continental shelf; (2) the employment of satellite imagery and digital elevation models to establish sequential regional ice-flow directions and landsystems characteristic of former ice streams; (3) increasingly sophisticated analyses of regional lithostratigraphy; (4) the use of terrestrial cosmogenic nuclide (TCN) dating to establish the timing of deglaciation and readvances on land; and (5) numerical modelling of ice-sheet extent and behaviour. An important development has been the collation of all dating evidence relating to the last BIIS (Hughes et al. 2011) and the integration of this chronological database with terrestrial landform evidence (C. D. Clark et al. 2004; Evans et al. 2005; Hughes et al. 2010) and offshore moraine sequences to reconstruct the evolution of the entire BIIS (Clark et al. 2012; Hughes et al. 2014, 2016).
This review considers the impact of these new approaches on our understanding of the SIS, focusing on developments over the past 20 years, many of which nevertheless build on a vast body of earlier research (Sutherland 1984; Gordon & Sutherland 1993). Following sections considering chronological framework, terminology, dating calibration and the history of ideas concerning the SIS, we outline first current understanding of the pattern of ice-sheet expansion, then the nature of ice-sheet retreat and associated readvance episodes. Details of the stratigraphy associated with these events are given in the reviews by Merritt et al. (2018) and Stewart et al.
For Peer Review
1. Chronological framework, terminology and dating calibration
The last glacial stage in Great Britain is termed the Devensian, and is chronologically equivalent to the Weichselian in Europe. Chronostratigraphic subdivision of the Devensian on the basis of terrestrial evidence is poorly constrained, so here we follow the convention of equating subdivisions with marine oxygen isotope stages (MIS) using the temporal boundaries of Lisiecki & Raymo (2005): Early Devensian (= MIS 5d–4, ~109–57 ka; Middle Devensian (= MIS 3, ~57– 29 ka) and Late Devensian (= MIS 2, ~29–11.7 ka), though some authors place the MIS3/2 boundary at 31 ka or 30 ka. The Late Devensian encompasses Greenland Stadials (GS) 5 to 1 as defined in the Greenland ice core isotope record (~32.0 ka to 11.7 ka; Rasmussen et al. 2014) and in Great Britain is subdivided into the Dimlington Stade (~31–14.7 ka), Lateglacial (or Windermere) Interstade (~14.7–12.9 ka) and Younger Dryas (or Loch Lomond) Stade (~12.9– 11.7 ka). The last SIS began to expand near the end of the Middle Devensian, reached its maximum extent during the Dimlington Stade and had probably fragmented into remnants in the Highlands within a few centuries after the beginning of the Lateglacial Interstade at ~14.7 ka.
Ages cited below are expressed as ka (thousands of years before present), and mean ages derived from two or more individual ages are uncertainty-weighted means. Cited uncertainties are ± 1σ. Uncalibrated radiocarbon ages are cited as 14C a BP or 14C ka and calibrated radiocarbon ages as cal 14C ka. We have recalibrated all radiocarbon ages with the CALIB 7.10 calibration software (Stuiver et al. 2016), using the IntCal 13 dataset for terrestrial samples and the Marine 13 dataset for marine samples (Reimer et al. 2013). We have applied a 400-year reservoir correction for marine shells and foraminifera whilst acknowledging that reservoir age is likely to have varied (Austin et al. 2011). Calibrated radiocarbon ages are expressed as the ± 1σ age range. All TCN exposure ages based on cosmogenic 10Be have been recalibrated using the Lm scaling of the CRONUS-Earth online calculator (Balco et al. 2008) and the Loch Lomond production rate (LLPR; Fabel et al. 2012), which yields a reference production rate of 4.00 ± 0.18 atoms g-1 a-1; other scaling schemes generally produce ages < 1.5% older or < 0.5% younger. Exposure ages based on cosmogenic 36Cl have been calculated using the CRONUScalc online calculator (Marrerro et al. 2016a) and reference production rates of 56.0 ± 4.1, 155 ± 11, 13 ± 3 and 1.9 ± 0.2 atoms 36Cl g−1 a−1, for Ca, K, Ti and Fe, respectively (Schimmelpfennig et al. 2009; Marrero et al. 2016b) using the SA scaling of Lifton et al. (2014), as this yields ages similar to those produced by independent 10Be exposure dating. For all TCN ages we cite full (external) uncertainties at ± 1σ and assume a sample erosion rate of 1 mm ka-1; assumption of zero erosion for samples analysed using 10Be produces ages ~1% younger and assumption of 2 mm ka-1 produces ages ~1% older.
For Peer Review
and evaluate their significance and representativeness within the context of wider chronological considerations.
2. Evolving ideas concerning the extent of the last Scottish Ice Sheet
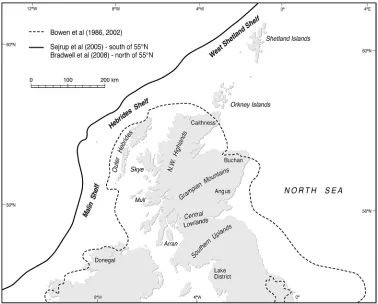
Early research based on erratic transport, till lithology and observations of striae demonstrated that all of Scotland had been glaciated during the Pleistocene. James Geikie (1876) concluded that 'one great sheet of ice enveloped the whole country' and Archibald Geikie (1901), Peach & Horne (1910) and Wright (1914) produced maps of ice-sheet extent showing directions of ice flow, with glacier ice terminating westwards at the Atlantic Shelf break and confluence of the SIS and Fennoscandian Ice Sheet (FIS) in the North Sea Basin (NSB) (Fig. 2). Their interpretations were broadly similar to present understanding of former ice extent, but in the absence of dating controls they were unable to demonstrate that the inferred extent of ice cover represented the last
ice sheet, rather than an earlier glaciation. The earliest models of the dimensions of the last SIS (Boulton et al. 1977, 1985) adopted this interpretation, placing the western limit of Scottish ice near the Atlantic Shelf break and accepting confluence of the SIS and FIS in the NSB.
The final decades of the 20th century witnessed radical reassessment of the dimensions of the SIS. This revision was stimulated by interpretation of the stratigraphy and chronology of offshore sediments in the NSB as indicating that the ice sheet extended only 50–100 km E of the Scottish coast (Holmes 1977; Thomson & Eden 1977). This interpretation implied that the SIS and FIS were not confluent, and thus that Moray Firth ice could not have been diverted NW across Caithness and Orkney, implying that these areas remained outside the limit of the last ice sheet. Evidence for eastward ice movement across the Uists and Benbecula (Coward 1977; Peacock & Ross 1978) and radial ice movement on Harris, Lewis and Shetland (Flinn 1977, 1978a, 1978b; Von Weymarn 1979) also suggested that these areas were not over-run by the last mainland ice sheet, but nourished independent ice caps. Collectively, these findings prompted Sissons (1981) to argue that the SIS had been of limited extent, and that Orkney, Caithness and part of NE Scotland lay outside its limits. This 'restricted ice sheet' model was developed by Sutherland (1984) and adopted by Bowen et al. (1986) in an influential reconstruction that depicted ice-free enclaves in NW Lewis, Orkney, Caithness and NE Scotland (Fig. 3). Their proposed ice-sheet limits were employed to constrain a second generation of ice-sheet models (Boulton et al. 1991; Lambeck 1995) and were accepted by some researchers for two decades (Bowen et al. 2002; C. D. Clark et al. 2004; Fretwell et al. 2008).
The 'restricted ice sheet' model was soon contested. The evidence favouring an ice-free enclave in Lewis and termination of the last ice sheet across Caithness and NE Scotland was challenged (Hall & Whittington 1989; Hall & Bent 1990; Hall 1995, 1996), and seismostratigraphic, borehole and dating evidence from the Hebrides and Shetland shelves was interpreted as indicating much greater westward extension of the last ice sheet (Davies et al.
For Peer Review
mountains in NW Scotland were shown to indicate extension of ice cover far beyond the limits of the 'restricted ice sheet' model (Ballantyne et al. 1998a, 1998b). Finally, bedrock and boulder samples from Orkney, Caithness and NE Scotland yielded post–LGM TCN ages within the (recalibrated) age range ~21–16 ka, demonstrating that these areas were over-run by the SIS (Phillips et al. 2008; Ballantyne 2010). Such findings forced abandonment of the 'restricted ice sheet' model in favour of a much larger ice sheet that in many respects resembles that proposed a century earlier.
3. Ice-sheet expansion and maximum extent
Recent reconstructions of the maximum extent of the last BIIS (Bradwell et al. 2008b; Chiverrell & Thomas 2010; Gibbard & Clark 2011; Clark et al. 2012; Hughes et al. 2014, 2016) depict extension of Scottish ice to the Atlantic Shelf edge, and southward into the Irish Sea Basin (ISB) and across northern England. To the east, they show confluence with the FIS, flow of ice from the Moray Firth northwestward across Caithness and Orkney, and southeastward diversion of ice from eastern Scotland in the western NSB. The only outer terminus of glacier ice nourished solely in Scotland therefore lay along the Atlantic Shelf between ~56°N and ~61°N (Fig. 3), as in all other sectors it was confluent with ice nourished in Norway, northern England, Wales and Ireland, and such confluence zones migrated during ice-sheet expansion and retreat. The evidence favouring this interpretation is outlined below.
Reconstructed flowlines indicate that as the ice sheet expanded, ice from different centres of dispersal met and interacted, ice divides built up and migrated, and the directions of ice movement changed in response. As the ice sheet grew, ice streams (zones of fast flow) developed and assumed dominance in discharging ice towards the ice-sheet margins, probably triggering drawdown of the ice surface. Moreover, ice expansion was asynchronous: different sectors of the SIS reached their maximum extent at different times. Below we consider the evidence relating to timing of the initial growth of the SIS and a reconstruction of the overall pattern of ice-sheet expansion, before focusing on the detailed evidence in three sectors: (1) southern and SW Scotland; (2) eastern Scotland, Orkney, Shetland and the NSB; and (3) western Scotland, the Hebrides and the Atlantic Shelf.
3.1. Initial expansion of the last ice sheet
For Peer Review
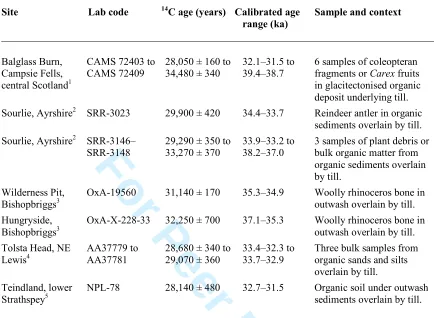
Radiocarbon ages for organic material buried under till deposited by the SIS (Table 1) indicate that most low ground was ice free before ~35 cal 14C ka and possibly as late as ~32 cal 14C ka. Faunal and floral assemblages from the sites at Balglass Burn and Sourlie indicate cold tundra conditions and permafrost (Bos et al. 2004; Brown et al. 2007), consistent with the coeval presence of glaciers in the Highlands. The Balglass site lies only ~20 km from the Highland edge, yet the mean age of six samples from this site indicates that it was not over-run by Highland ice until after 36.0–34.9 cal 14C ka, and the youngest age suggests that it may not have been over-run until after ~32 cal 14C ka. Of the uppermost four radiocarbon ages obtained by Whittington & Hall (2002) for bulk samples from organic-rich sands and silts buried under till at Tolsta Head in eastern Lewis, the youngest (30.8–30.1 cal 14C ka) probably reflects contamination, as the underlying three samples yielded consistent ages averaging 33.4–32.8 cal 14C ka; there is also some uncertainty as to whether the overlying till was deposited by Outer Hebrides ice or mainland ice. Collectively, the limiting ages for ice expansion across low ground suggest that during the final millennia of MIS 3 glacier ice expanded from mountain source areas, over-running most low ground after ~35 ka and possibly two or three millennia later.
The timing of ice expansion across the NSB is broadly consistent with the ages obtained from terrestrial sites. Three radiocarbon ages for shells in marine sediments overlain by till within a core from the North Sea Plateau, ~330 km NE of Shetland, yielded (in stratigraphic order) ages of 34.6–34.0, 34.5–33.8 and 34.1–33.3 cal 14C ka, implying that this area remained ice-free until at least ~34 ka (Rise & Rokoengen 1984; Sejrup et al. 1994). Similarly, samples of foraminifera and shell fragments in glacially deformed glacimarine sediments in core BGS BH 04/01, from the Witch Ground Basin, ~175 km NE of Rattray Head, produced ages of 35.0–33.9, 39.1–30.9, 35.0–29.1 and 35.8–31.3 cal 14C ka (Graham et al. 2010). Although three of these ages have large uncertainties, the median ages associated with these samples (34.8–32.2 cal 14C ka) suggest that the Witch Ground Basin remained largely ice-free until ~34–33 ka.
3.2. The overall pattern of ice-sheet expansion
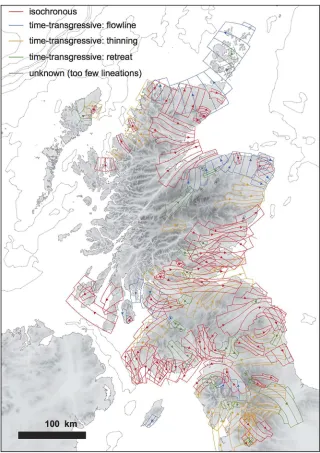
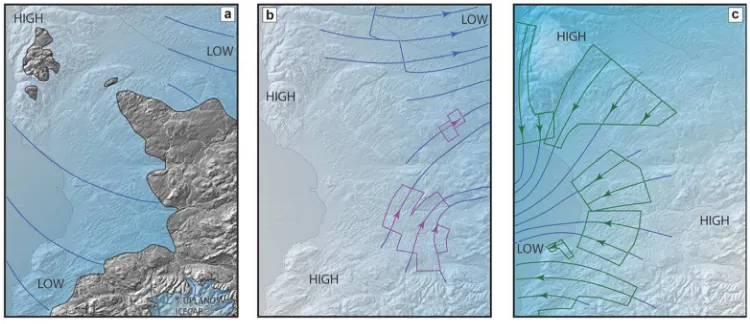
Understanding of the evolution of the SIS has been transformed by remote mapping of landforms indicative of the direction of former ice movement (drumlins, streamlined drift ridges, mega-scale glacial lineations (MSGLs), ribbed moraine and meltwater channels) and the grouping of such landforms into discrete flowsets that represent different phases of ice movement. Overprinting of one flowset by another indicates the relative chronology of ice flow trajectories (Fig. 4), though it does not exclude the possibility that the oldest flowsets identified in this way represent pre-Late Devensian ice flow directions, and some supposed flowsets in areas of thin drift cover may be influenced by underlying rock structure (Hall & Riding 2016; Merritt et al.
For Peer Review
Ice Sheet and Southern Uplands ice dome has resulted in development of an ice divide between SW Scotland and Ireland; at this time the ice margin is inferred to have approached or reached the Atlantic Shelf edge. Stage 5 depicts the SIS terminating westward at the Atlantic Shelf edge and eastward confluence with the FIS, forcing ice flowing eastward from Scotland to divert northwestward across Caithness and Orkney and southeastward across NE England and into the southern NSB. This stage approximates the maximum extent of glacier ice sourced in Scotland, which Hughes et al. (2014) suggested occurred between 28 ka and 26 ka. Southward ice expansion, however, is depicted as continuing during stage 6, by which time they depict retreat of the northern ice margin, development of an ice cap over Shetland and partial decoupling of the SIS and FIS.
Notable features of the pattern of ice-sheet build up proposed by Hughes et al. (2014) include persistence of a migratory N–S ice divide extending southward from the NW Highlands, and development of an ice divide between SW Scotland and NE Ireland, which limited the flow of Scottish ice into the ISB. They acknowledged that the timing of ice-sheet build-up is poorly constrained, and that their reconstruction (Fig. 5) may conflict with more detailed evidence in particular sectors. It nevertheless shows reasonable congruence with numerical models of the pattern of ice-sheet build-up (Boulton & Hagdorn 2006; Hubbard et al. 2009; Patton et al. 2016) and represents a first approximation that forms a basis for future refinement.
3.3. The southern sector of the ice sheet
The evolution of the southern sector of the SIS has been reconstructed through identification of cross-cutting and overprinted flowsets that indicate migrating ice sheds and major changes in ice movement during ice-sheet expansion. This approach was pioneered in this sector by Salt & Evans (2004) and subsequently developed by Finlayson et al. (2010, 2014) for west-central Scotland, and Evans et al. (2009) and Livingstone et al. (2008, 2010b, 2012, 2015) for northern England and southern Scotland. Palaeoflow directions reconstructed from landforms are complemented by evidence provided by striae, erratic transport and lithostratigraphy. The methodology employed is essentially similar to that employed by Hughes et al. (2014; Fig. 4), and it is noteworthy that the flowsets derived independently by three groups of researchers are broadly similar.
For Peer Review
Firth of Clyde from the SW Highlands to the western Southern Uplands, feeding ice movement both westward across the Malin Shelf and eastward across the Midland Valley (Fig. 6b). The flowset evidence mapped by Finlayson et al. (2010) suggests that this divide subsequently migrated ~60 km eastward (Fig. 6c), possibly in response to drawdown of ice streaming westward across the Malin Shelf.
Using a similar approach, Livingstone et al. (2008, 2010b, 2012, 2015) and Evans et al.
(2009) reconstructed the evolution of the last ice sheet in the Southern Uplands and northern England. Ice from the Galloway Hills and Southern Uplands initially predominated, carrying erratics into the Eden Valley and possibly crossing the Stainmore Gap through the Pennines. Subsequent development of a NW–SE ice divide across the Solway Firth from SW Scotland to the Lake District (Fig. 7) represents the continuation of that identified by Finlayson et al. (2010; Fig. 6b) farther north. This divide separated southward ice flow from Galloway into the ISB and eastward flow of ice from the Southern Uplands and Lake District into the Tyne valley. During the LLGM, high ground in the Southern Uplands and Cheviots appears to have been occupied by cold-based ice domes (Mitchell 2007, 2008) that fed ice flowing eastward across the Midland Valley and southwards into the Tweed valley (Everest et al. 2005). Ice flowing eastward through the Midland Valley to the Firth of Forth was diverted SE near the coast, joining that from the Tweed and Tyne and extending southwards to NE Yorkshire (Fig. 7). Livingstone et al. (2012) suggested that this general pattern of ice movement persisted for several millennia. Southward-flowing ice from Galloway continued to flow into the ISB, joining ice from the Lake District, Wales and Ireland to form the Irish Sea Ice Stream (ISIS). Scourse and Furze (2001) placed the southernmost extent of the ISIS at a transition from subglacial till to glacimarine facies at ~49.5°S, but Praeg et al. (2015) have presented lithostratigraphic and geophysical evidence suggesting that the ISIS extended > 150 km father south, potentially reaching the Celtic Sea shelf edge as a result of short-lived surging. Bayesian modelling based on published age data suggests that the ISIS achieved its maximum southern reach between ~24.3 and 23.0 ka (McCarroll et al.
2010; Chiverrell et al. 2013), but TCN and luminescence dating evidence implies that it impinged on the Scilly Isles at ~26–25 ka (Smedley et al. 2017a).
3.4. The northeastern and eastern sector of the ice sheet
Although it is generally accepted that the SIS was confluent with the FIS in the NSB, there remains uncertainty regarding the pattern and sequence of ice movement during both ice-sheet expansion and retreat. Here we consider first the terrestrial evidence for key areas (Shetland, Orkney, Caithness and NE Scotland) then changing interpretations of the pattern of ice movement in the NSB during the LLGM.
For Peer Review
Graham et al. 2011; Clark et al. 2012), and was supported by interpretation of onshore streamlined bedforms in parts of the archipelago (Golledge et al. 2008) and research on glacitectonic fabrics (Carr & Hiemstra 2013). These interpretations contrast with the work of Flinn (1977, 1978a, 2009) who demonstrated that striae, plucked bedrock and roches moutonnées exhibited a consistent radial pattern away from an ice divide aligned N–S along the spine of the Shetlands.
Review of the field evidence by Hall (2013) supports the independent ice cap hypothesis. He argued that the pattern of streamed bedforms is consistent with divergent ice flow beneath a Shetland ice cap, and that glacitectonic structures interpreted as indicating ice flow from the NSB (Carr & Hiemstra 2013) are unreliable. He noted also the absence of E–W streamlined bedforms or ice-moulded bedrock across central Shetland and, tellingly, the absence of erratics or marine shells derived from the NSB in the tills of eastern Shetland. Development of an independent Shetland ice cap that persisted during the LLGM is also evident in numerical simulations of the last BIIS (Hubbard et al. 2009) and supported by extension of till of Shetland provenance up to ~110 km E of the archipelago (Peacock 1995). It is also consistent with the pattern of retreat indicated by submarine moraine banks, which show that ice margins converged on Shetland after the LLGM (Bradwell et al. 2008b; Clark et al. 2012). The pattern of offshore moraine banks and data on offshore till lithology led Hall (2013) to conclude that during the LLGM the Shetland Ice Cap extended NW–SE over at least 160 km to the Atlantic shelf edge, diverting the FIS northwestward and ice from the Moray Firth and NSB across northern Orkney.
3.4.2. Caithness and Orkney. The last glaciation of Caithness has traditionally been interpreted as a two-stage event in which initial ice movement northeastward from Sutherland was succeeded by N to NW movement of Moray Firth ice, which deposited an extensive grey till containing marine shells (Peach & Horne 1881; Hall & Whittington 1989). Lithostratigraphic research by Hall et al. (2011) and Hall & Riding (2016) indicates a more complex event stratigraphy in which radial outflow of ice from ice centred over the hills of the Sutherland-Caithness border was succeeded in turn by (1) retreat of the ice margin from the north coast, (2) an initial advance of Moray Firth ice northwestward across the Caithness plain and (3) retreat of the ice margin, represented by deposition of fan gravels at the north coast. This was followed by the main northwestward advance of Moray Firth ice across Caithness, which deflected flow of Highland ice northwards and deposited the widespread shelly till (the Forse Till). Excluding outliers, six TCN ages obtained by Phillips et al. (2008) for deglaciation of sites in northern and SE Caithness range from 20.5 ± 3.2 ka to 16.0 ± 1.1 ka, indicating that the main advance of Moray Firth ice across Caithness occurred during the LLGM.
For Peer Review
Unlike Shetland, there appears to be no evidence for a former independent ice cap on Orkney (Hall et al. 2016b).
Hall et al. (2016b) identified three tills on Orkney, and related these to three phases of ice movement. The earliest till appears to record ice movement from a more southerly direction than the overlying widespread Scara Taing Till, the stratigraphic equivalent of the Forse Till of Caithness. This till was emplaced by ice moving SE–NW, and in northern Orkney contains rare far-travelled erratics that can be linked to sources in the Northern Highlands, Inner Moray Firth, Grampian Highlands, Fennoscandia and possibly eastern Scotland, implying a complex history of transport and reworking. The uppermost till was apparently deposited by a late readvance of ice across low ground. Noting that the palynomorph assemblages in the Orkney tills are dominated by material sourced from the inner Moray Firth and the shelf SE of Orkney, Hall et al. (2016b) argued that the rare Scandinavian erratics detected in Orkney till are reworked, and that the last FIS did not impinge on these islands.
Although Hall & Riding (2016) and Hall et al. (2016b) acknowledged that expansion of the FIS and Shetland Ice Cap could have been responsible for deflection of Moray Firth ice NW across Caithness and Orkney, they advocated other scenarios for such deflection, such as eastwards shift of the former ice shed or, somewhat confusingly, '…ice congestion in the northern North Sea'. An alternative solution is that a SW–NE aligned ice divide (Sejrup et al. 2016) or migrating ice divide (Merritt et al. 2017) developed between NE Scotland and SW Norway during the LLGM (Fig. 8) forcing ice from the Moray Firth to flow NW toward the Atlantic Shelf edge.
For Peer Review
3.4.4 The North Sea Basin (NSB). Confirmation that the central and northern NSB were completely covered by conjoined ice sheets during the LLGM comes from several sources. Radiocarbon ages of molluscs and foraminifera within undisturbed marine or glacimarine sediments overlying glacially-deformed marine sediments or till range from ~26.5 to ~17.2 cal 14C ka (Sejrup et al. 1994, 2009, 2015; Graham et al. 2010). Though the oldest ages may be stratigraphically unrepresentative (Sejrup et al. 2016), these dates confirm that the underlying sediments were deformed or emplaced by Late Devensian (Late Weichselian) ice, and the younger ages indicate marine sedimentation following ice-sheet retreat prior to ~18–17 ka. Microfabric analyses of key formations in the NSB indicate complete ice cover during the LLGM (Carr et al. 2006) and mapping of moraines and subglacial tunnel valleys from bathymetric and seismostratigraphic data (Lonergan et al. 2006; Bradwell et al. 2008b; Clark et al. 2012) also indicates complete ice cover across the northern NSB during the LLGM. Finally, research by Graham et al. (2007, 2010) based on 3D reflection seismic data covering the Witch Ground Basin (Fig. 8) has revealed NW-trending buried mega-scale glacial lineations, 5–20 km long, interpreted as demonstrating confluence of the SIS and FIS, and development of a former ice stream that flowed NW towards the Orkney-Shetland channel or SE towards the central NSB. The timing of ice build-up in the NSB remains uncertain. Analysis of the available chronological data by Hughes et al. (2016) suggested that parts of the NSB may have been ice free as late as 29–28 ka, but that the central and northern NSB were completely ice-covered by 27 ka.
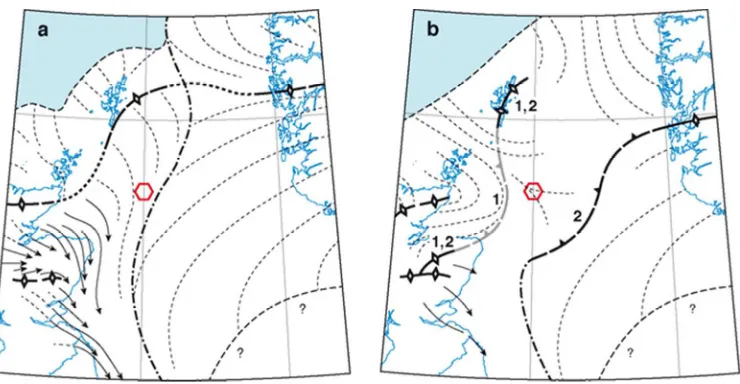
There are conflicting views regarding the pattern of ice movement in the NSB during the LLGM. The traditional view was that the expanding FIS acted as a barrier that forced eastward moving ice from NE Scotland to turn northwestward across Caithness and Orkney, and ice from SE Scotland to turn southeastward then southward toward the English coast. A refinement of this interpretation is that the NW-trending MSGLs in the Witch Ground Basin identified by Graham
et al. (2007, 2010) represent a confluence zone between the FIS and SIS that extended NW across northern Orkney, implying that Shetland was over-run by ice from Norway (Bradwell et al. 2008b; Chiverrell & Thomas 2010; Hughes et al. 2014; Fig. 9). Clark et al. (2012), however, depicted a broad ice divide extending from NE Scotland to SW Norway, an interpretation consistent with modelling experiments (Boulton & Hagdorn 2006; Patton et al. 2016). This view was developed by Sejrup et al. (2016), who argued that the MSGLs in the Witch Ground Basin were produced by ice streaming to the SE rather than NW. The migratory ice shed proposed by Merritt et al. (2017, Fig. 8b) represents a variant of this model consistent with switching ice-flow directions on land. The concept of a SE-migrating divide spanning the northern NSB appears to accommodate the available terrestrial and offshore evidence better than the 'confluence' model (Fig. 9), but remains to be confirmed.
3.5. Western Scotland, the Hebrides and the Atlantic Shelf
For Peer Review
westward from the Scottish Mainland (Bailey et al. 1924; Tyrrell, 1928; Gemmell 1973; Dahl et al. 1996; Ballantyne & McCarroll 1997; Ballantyne 1999; Finlayson et al. 2014; Ballantyne et al.
2016). A larger independent ice cap formed over the Outer Hebrides. Mapping of striae and ice-moulded bedrock by Flinn (1978b), Von Weymarn (1979) and Peacock (1984, 1991) demonstrated former radial ice movement on Lewis and Harris, though occurrences of shelly tills and mainland erratics indicate that mainland ice impinged on eastern Lewis at some stage, and probably crossed northernmost Lewis (Peacock 1984). Striae, ice moulding and erratic transport imply that a N–S aligned ice divide developed along the western margin of the Uists and Benbecula (Coward 1977; Flinn 1978b; Peacock & Ross 1978; Selby 1989). Preservation of blockfields and tors on mountain summits on Harris and South Uist suggests that these were occupied by cold-based ice throughout much or all of the Late Devensian (Ballantyne & McCarroll 1995; Ballantyne & Hallam 2001). The Outer Hebrides Ice Cap appears to have acted as a centre of ice dispersal throughout the evolution of the SIS, feeding ice W across the Hebrides Shelf (Selby 1989; Stoker et al. 1993; Ballantyne et al. 2017), NE into the Minch Ice Stream (Bradwell et al. 2007), and southward to feed the Hebrides Ice Stream (Howe et al. 2012; Dove
et al. 2015; Fig. 9).
The evidence for extension of the SIS to the Atlantic Shelf edge has been inferred from the stratigraphy of large submarine shelf-edge fans (trough-mouth fans), and the distribution and alignment of moraine banks at or near the shelf edge. Four fans abut the shelf edge: the Barra-Donegal Fan (BDF; ~6300 km2), the Sula Sgeir Fan (SSF; ~3750 km2), and the smaller Rona and Foula Wedges (Fig. 9). Deposition of glacigenic sediment on the SSF has been linked to a former ice stream, the Minch Ice Stream (Stoker & Bradwell 2005; Bradwell et al. 2007; Bradwell & Stoker 2015b) and the BDF acted as depocentre for sediment deposited by converging ice from western Scotland (the Hebrides Ice Stream) and Ireland (Dunlop et al. 2010; Howe et al. 2012; Ó Cofaigh et al. 2012; Finlayson et al. 2014; Dove et al. 2015). The link between the Rona and Foula Wedges, submarine troughs and former ice streams is less clear, though the latter may have acted as a depocentre for ice flowing westward through the Orkney-Shetland channel (Fig. 9).
For Peer Review
surging behaviour (Hibbert et al. 2010). The SSF also comprises marine or glacimarine muds alternating with packages of glacigenic mass-flow deposits and sandy turbidites, the latter indicating proximity of the former ice-sheet margin (Stoker & Holmes 1991; Stoker 1995; Baltzer et al. 1998), and sediment sequences on the Rona and Foula Wedges also demonstrate ice-proximal deposition, probably during MIS 2 (Stoker et al. 1993, 1994). Arrival of the ice margin at or near the West Shetland Shelf break may be indicated by increased IRD flux at ~29 ka in deep-ocean core MD04-2829 from the Rosemary Bank (58.95°N, 09.57°W; Scourse et al. 2009). Collectively, the available dating evidence appears to place the arrival of the Hebrides and Minch ice streams on the outer shelf within the period 30–27 ka. The latter date has been assumed by several authors, but it seems possible that these ice streams may have reached the outer shelf edge 2–3 ka earlier, depending on the interpretation of the lithostratigraphy and IRD flux in deep-ocean cores.
In this context, 10Be exposure ages obtained for samples from eight glacially-transported boulders on the island of North Rona on the Shetland shelf (59.1°N, 05.8°W) are interesting. These indicate the timing of retreat of the ice margin from the outer shelf, and yielded a reported mean age of 24.8 ± 2.7 ka (Everest et al. 2013). Recalibration produces individual ages of 34.0 ± 2.0 ka to 23.4 ± 1.4 ka; excluding three outliers, the weighted mean age of the remaining five samples is 28.7 ± 1.4 ka. This appears to imply both extension of the ice margin in this sector
and its subsequent retreat before ~29–28 ka. This conclusion should be treated with caution, however, because of the large dating uncertainty, and in the light of research suggesting that 10Be exposure ages for sites at the periphery of former ice sheets may be compromised by subsurface production of 10Be by deeply-penetrating muons, yielding exposure ages that may be 'too old', even when they exhibit good internal agreement (Briner et al. 2016; Smedley et al. 2017b).
Submarine moraine banks recording former ice margin positions on the Atlantic Shelf were first mapped by Selby (1989), Stoker & Holmes (1991) and Stoker et al. (1993). Identification of the pattern of moraine banks on the Hebrides and West Shetland Shelves and northern NSB has been transformed by mapping based on the Olex bathymetric database (www.olex.no), which has been used to generate images of seabed relief (Fig. 10). Ridges evident from Olex-based imagery have been mapped by Bradwell et al. (2008b) and Clark et al. (2012), both of whom interpreted these features as ice-marginal moraines (or moraine banks) deposited by grounded ice. These ridges often exceed 1 km in width, suggesting that they represent prolonged deposition and glacitectonic deformation of sediment at oscillating grounding-line margins. The maps produced by Bradwell et al. (2008b; Fig. 11) and Clark et al. (2012) differ only in detail.
For Peer Review
exhibits furrows attributed to iceberg scour, suggesting that the grounded ice margin became marine-based as a result of advance into deep water or as a consequence of sea-level rise.
Although similar shelf-edge moraines W of Ireland have been shown to represent the limit of the last BIIS (Peters et al. 2015; Ballantyne & Ó Cofaigh 2017), there is persuasive evidence that those on the edge of the northern Hebrides Shelf were deposited by an earlier, pre-MIS3/2 ice sheet (Stoker et al. 1993, 1994; Stoker 1995, 2013). Seismostratigraphic research by Stoker & Holmes (1991) demonstrated that the shelf-edge moraines in this sector pre-date similar moraines on the West Shetland Shelf, being separated by an angular stratigraphic discordance. Though the time interval represented by this discordance is unknown, they postulated that that the two sets of moraines were deposited during two different glaciations. This conclusion was supported by amino-acid diagenesis, which indicated that the moraines on the outer Hebrides Shelf pre-date MIS 3 (Stoker & Holmes 1991; Stoker 2013; Stoker & Bradwell 2005). Recent reappraisal of the pattern of moraine systems on the northern and central Hebrides Shelf by Bradwell & Stoker (2015a) conforms to the stratigraphic evidence, and suggests that ice moving westward from the Outer Hebrides during the LLGM extended no farther than mid-shelf (Fig. 12). This interpretation is supported by research on the St Kilda archipelago, 65 km W of the Outer Hebrides and 40–60 km E of the shelf break, which has demonstrated that the last ice sheet failed to encroach on these islands (Sutherland et al. 1984; Hiemstra et al. 2015; Ballantyne et al.
2017). Collectively, the evidence outlined above conflicts with the simple 'shelf-edge' configuration of the last ice sheet promoted by Bradwell et al. (2008b) and Clark et al. (2012). The actual extent of the last ice sheet on the northern Hebrides shelf remains uncertain. It has been depicted as a broad arc extending west of the Outer Hebrides but terminating just east of St Kilda (Selby 1989; Stoker et al. 1993). Bradwell & Stoker (2015a, p. 317) suggested that the LLGM ice margin was '…situated close to the present-day coastline in NW Lewis…' though this interpretation is based solely on interpretation of submarine moraine configuration from bathymetric imagery. Conversely, the TCN ages obtained on North Rona (28.7 ± 1.4 ka; Everest
et al. 2013) and a radiocarbon age of 22.5 ± 0.3 14C ka BP (27.2–25.9 cal 14C ka) reported by Peacock et al. (1992) for a bivalve from glacimarine sediments west of moraine banks south of St Kilda suggest extension of Outer Hebrides ice to at least mid-shelf.
The evidence outlined above contravenes the widespread belief that there is '…unequivocal evidence for glaciation to the continental shelf edge all the way from SW Ireland to the Shetland Isles' (Clark et al. 2012, p. 141), a proposition widely accepted in most recent accounts (Hubbard
For Peer Review
3.6. Ice sheet expansion: synthesis
The evidence summarised above indicates that marine-terminating ice existed in Scotland for several millennia prior to growth of the last SIS, and that ice expansion across low ground and the adjacent shelf commenced within the period 35–32 ka. To the south the expanding ice sheet initially invaded Ireland, the ISB and northern England before establishment of an ice divide across the North Channel limited southward ice flow. A N–S ice divide developed between the SW Highlands and N England producing dominantly westerly ice flow toward the Malin Shelf and easterly flow towards the NSB. Ice from eastern Scotland was confluent with the FIS in the NSB, but there is debate as to whether this ultimately resulted in confluent flow of ice towards the NW or establishment of a (migratory) ice shed between NE Scotland and Norway that resulted in northwesterly flow of ice from the Moray Firth and the NSB across Caithness and Orkney. Both Shetland and the Outer Hebrides probably developed independent ice caps that persisted as centres of ice dispersal throughout the expansion of the SIS. Glacigenic sedimentation on shelf-edge fans, the seismostratigraphy of the outer shelf, and the alignment of submarine moraine banks collectively suggest that the last SIS probably extended to the Atlantic shelf edge in most sectors, but no farther than mid-shelf on the Hebrides Shelf.
Assumption of ice-sheet expansion from the Scottish mainland after ~34 ka, as suggested by the terrestrial dating evidence, implies that growth of the SIS to its maximum extent on the Atlantic shelf occurred over 4000–7000 years. Irrespective of the exact timing of the LLGM in this sector, the northern parts of the SIS appear to have reached their maximum extent prior to the global LGM of ~26.5–19 ka (P.U. Clark et al. 2009), probably reflecting the relatively small size of the SIS and position adjacent to the Atlantic Ocean, which was a source of moisture-bearing airmasses that fed rapid ice-sheet growth so that ice centres responded rapidly to climate deterioration (Hughes et al. 2016; Patton et al. 2016).
4. Trimlines, blockfields and the vertical dimension of the last ice sheet
Two conflicting forms of evidence have informed interpretation of the vertical extent of the last ice sheet. Ice-moulded bedrock, striae, erratics and perched boulders occur on some mountain summits, implying over-running by wet-based glacier ice (Figs. 13a and 13b). Conversely, others are mantled by periglacial blockfields, sometimes interrupted by tors and outcrops of shattered rock (Figs. 13c and 13d). The contrast between blockfields on summits and ice-scoured bedrock on lower slopes in NW Scotland was initially interpreted as representing the upper limit of the SIS, implying that some summits remained above the ice sheet as nunataks (J. Geikie 1878, 1894; Godard 1965). The restricted ice sheet model proposed by Bowen et al. (1986) favoured this view, and stimulated mapping across NW Scotland of trimlines marking the altitudinal boundary between ice-scoured terrain and blockfields. In Sutherland, for example, mapped trimlines descend northwestward from ~850 m to ~600 m near the coast (McCarroll et al. 1995) and across Wester Ross they descend northwestward from > 900 m near the watershed to ~700 m near the coast (Ballantyne et al. 1997).
For Peer Review
remaining frozen to the underlying substrate, or the upper limit of the SIS, and they favoured the latter interpretation. TCN ages for bedrock samples from mountains in Wester Ross, Skye, Harris and Caithness confirmed that whereas below-trimline samples returned ages consistent with the timing of deglaciation, above-trimline samples yielded pre-LLGM ages (Fig. 14). Samples from two erratic boulders resting on a blockfield in Wester Ross gave TCN ages > 55 ka (Stone et al.
1998), suggesting that the erratics were deposited by an earlier, thicker ice sheet.
Mapping of trimline altitudes in Caithness, however, showed that that these were inconsistent with TCN ages indicating that Orkney was completely overrun by the last ice sheet (Ballantyne & Hall 2008), causing reinterpretation of Scottish trimlines as thermal boundaries marking the upper limit of erosion by wet-based ice within a much thicker SIS (Kleman & Glasser 2007; Ballantyne 2010; Kuchar et al. 2012). This reinterpretation is supported by numerical models of the BIIS, which indicate persistent cold-based ice over mountain summits (Boulton & Hagdorn 2006; Hubbard et al. 2009) and evidence of glacial modification of tors on the Cairngorm Mountains (Hall & Phillips 2006). Over-riding of blockfield-mantled summits in NW Scotland by the SIS was tested by Fabel et al. (2012), who obtained TCN ages for 14 erratic boulders resting on summit blockfields. Nine of these yielded post-LLGM (recalibrated) ages of 17.5 ± 1.0 ka to 14.9 ± 0.1.5 ka (Fig. 14), demonstrating that the last ice sheet must have overtopped all summits in this area. TCN dating of glacially-deposited boulders on a summit blockfield in southern Ireland confirmed this interpretation (Ballantyne & Stone 2015), suggesting that all summit blockfields in the British Isles represent periglacial regolith that was preserved under cold-based ice during the LGM (Hopkinson & Ballantyne 2014).
For Peer Review
5. Ice streams and ice-sheet models
5.1. Palaeo-ice streams of the last Scottish Ice Sheet
Ice streams are corridors of fast-flowing ice within ice sheets (Bentley 1987; Truffer & Echelmeyer 2003; Bennett 2003; Benn & Evans 2010; Rignot et al. 2011). Velocities reach several hundreds of metres per year, often over deforming sediments, and their margins are defined by shear zones. Palaeo-ice streams that developed within former ice sheets can be identified by a range of criteria, notably a convergent flow pattern, a distinct flow track with sharply defined lateral margins, markedly elongate bedforms and lineations, and terminal sediment accumulations, often in the form of trough-mouth fans (Stokes & Clark 1999, 2001).
On the basis of such evidence, four eastward-flowing ice streams that drained the SIS have been identified. All exhibit topographic control and extended into the NSB. The Tyne Ice Stream drained ice from the Southern Uplands, Cheviots, Lake District and northern Pennines (Fig. 7). During the LLGM, flow was W–E, but a subsequent shift to southeasterly flow reflects increased dominance of Scottish ice (Livingstone et al. 2008, 2010b, 2012, 2015). The ~20 km wide Tweed Ice Stream, reconstructed by Everest et al. (2005) from the distribution and orientation of drumlins, megadrumlins and megaflutes, flowed NE to E between the Lammermuir and Cheviot Hills, draining an area of ~3500 km2 and extending ~65 km to the present coastline. The Strathmore Ice Stream flowed eastward in a ~45 km wide corridor between the Highland edge and NE Fife, is defined by streamlined bedrock and bedforms, and exhibits evidence of a post-LLGM northeastward shift in flow (Golledge & Stoker 2006). Farther north, there is evidence of eastward streaming of ice in the Moray Firth, though changes in the offshore configuration of the Moray Firth Ice Stream remain to be worked out in detail (Merritt et al. 1995, 2003, 2017; Graham et al. 2009). In the NSB, the NW–SE trending MSGLs identified by Graham et al.
(2007, 2010, 2011) crossing the Witch Ground Basin (section 3.4.4) have been interpreted as representing development of a former ice stream, though there is debate as to whether this represents former ice streaming NW towards the Orkney-Shetland channel (Fig. 9) or SE away from an ice divide over the northern NSB (Sejrup et al. 2016). Hall & Glasser (2003) used the term 'ice stream' to describe the effects of wet-based sliding ice in Glen Avon (Cairngorms), but whether true ice streams developed in the Cairngorm troughs is questionable.
For Peer Review
that culminated at ~16.8 ka, though as Bateman et al. (2011, 2017) acknowledged, this timing appears contrary to wider evidence for advanced deglaciation by this time.
To the south, ice from Galloway joined that from England, Wales and Ireland to feed the Irish Sea Ice Stream (ISIS), which drained >17% of the BIIS. The southern limit of this ice stream has been placed near the edge of the Celtic Sea Shelf (Praeg et al. 2015), implying a maximum travel distance exceeding 800 km. To the west, several authors have depicted a Hebrides Ice Stream that was confluent with a North Channel-Malin Shelf Ice Stream fed by ice from northern Ireland (Dunlop et al. 2010) and SW Scotland (Finlayson et al. 2014), and probably terminated at the shelf break, feeding sediment to the BDF (Fig. 9). Bedform evidence from the main flow track of this postulated ice stream is lacking, but Howe et al. (2012) and Dove et al. (2015) have shown that elongate streamlined bedforms cut southwestward across structural trends on the seafloor of the Sea of the Hebrides. They interpreted these as representing the onset zone of the Hebrides Ice Stream, where ice accelerated from an area dominated by bedrock obstacles onto the sediment-dominated shelf. Streamlined bedforms in western Kintyre probably represent associated westward ice streaming from the Firth of Clyde, and Finlayson et al. (2014) have suggested that the resulting drawdown of ice resulted in a ~60 km westward shift of the N–S ice divide across central Scotland. Whether the landform evidence in the Sea of the Hebrides relates to an ice stream at the LLGM or during overall retreat (as suggested by cross-cutting flow indicators) is uncertain (Dove et al. 2015).
For Peer Review
5.2. Ice-sheet models
Although the evidence for major ice streams draining the SIS is compelling, the history of most ice streams is poorly constrained. In their reconstruction of ice-sheet evolution, Hughes et al.
(2014) envisaged initial development of a thick integrated ice sheet, with ice-stream development contributing to subsequent thinning and ice-divide migration during and after the ice sheet achieved its maximum extent, but did not preclude ice-stream formation during ice-sheet expansion. The first numerical simulation experiments driven by proxy climate functions (Boulton & Hagdorn 2006) indicated early development of ice streams draining the predominantly cold-based upland core of the SIS, with resultant drawdown of the ice-sheet surface. Their models also identified major ice discharge arteries at the locations of the Minch, Hebrides, Irish Sea and Moray Firth Ice Streams.
Later thermomechanically-coupled models of the BIIS driven by a scaled NGRIP oxygen isotope curve for the period 38–10 ka (Hubbard et al. 2009) have indicated a more detailed scenario. A key finding of the optimal (most geologically-consistent) model is that it retrodicts major 'binge and purge' cycles during the lifetime of the ice sheet, identifying prolonged phases of build-up of cold-based, high-viscosity ice succeeded by 'purge' phases triggered by abrupt warming. Such 'purge' phases are characterised by widespread development of ice streams around the cold-based core of the modelled ice sheet. At such times the ice sheet surface is drawn down but the ice margins advance. The optimal model generates transient but recurrent ice streaming at all the Scottish ice-stream locations described above, and also intervening areas of fast-flowing ice that may have captured ice flow from the known ice-stream locations. It retrodicts limited ice cover (mainly over the Highlands, with tidewater-terminating margins) prior to ~33 ka, followed by extension of the ice margin to (or near to) the Atlantic Shelf edge at ~29 ka during the first major 'purge' event, immediately followed by development of all the Scottish ice streams identified from the geomorphological evidence. It also suggests, however, that small ice streams may have developed during ice-sheet build-up. More generally, this model suggests that though the largest ice streams (the Hebrides and Irish Sea Ice Streams) were active throughout much of the last glacial cycle, smaller ice streams were only intermittently active over centennial timescales.
For Peer Review
record. There may therefore be a prolonged temporal hiatus between one set of moraines and the next, during which the ice margin may have retreated and readvanced on several occasions. Thus although 'outer' moraines are older than 'inner' moraines, the intervening time period may have involved complex changes in ice extent or flow direction.
Below we outline the results of attempts to reconstruct the deglaciation history of the SIS at ice-sheet scale before considering the detailed evidence for particular sectors. Apart from the numerical modelling by Hubbard et al. (2009), the former are based on the pattern of offshore landforms, terrestrial flowsets and a patchy distribution of radiocarbon and TCN ages, some of questionable validity. Not all reconstructions are adequately integrated with the stratigraphic record. At the time of writing, a major initiative (the BRITICE-CHRONO project) designed to refine the chronology of BIIS retreat is nearing completion, and promises to yield new insights into the retreat behaviour of the SIS (www.britice-chrono.group.shef.ac.uk).
6. Deglaciation at ice-sheet scale
The earliest reconstruction of the pattern of SIS retreat (Bradwell et al. 2008b) was largely based on mapping of moraine banks, moraines and tunnel valleys (excavated by subglacial meltwater) from Olex bathymetric data (Fig. 10). From the location of the outermost moraines ('Group 1' in Fig. 11) they placed the ice margin at the shelf edge at 30–25 ka (Fig. 9). The large lobate, bifurcating and overprinting moraines of their 'Group 2' set they attributed to oscillation of grounded but calving margins and changes in flow direction, possibly related to rising sea level, with localised De Geer moraines indicating grounded tidewater margins. The smaller moraines of Group 3 (Fig. 11) and associated meltwater channels are interpreted as marking a more stable phase of deglaciation (~24–18 ka) following decoupling of the SIS from the FIS. From these patterns and bathymetric data they argued that initial decoupling took the form of development of a elongate marine embayment that extended southward from the shelf edge E of Shetland to the Witch Ground Basin by ~24 ka as sea level rose.
The numerical model of Hubbard et al. (2009) differs in suggesting that widespread retreat then readvance of the ice margin occurred between ~29 ka and ~24 ka, with subsequent extensive ice cover until ~19.4 ka, after which it suggests thinning and retreat of all sectors in response to sustained warmer conditions. During the period ~19.4–17.4 ka it indicates dynamic ice-stream activity with switching and competition across core areas, numerous localised, short-lived readvances of the ice margin but persistence of ice cover across the present land area of Scotland. It suggests that after ~17.2 ka, ice was largely confined to Scotland but with substantial advances reaching northern Ireland, renewed ice-stream activity and possible surging into the NSB. By ~15.7–15.6 ka, it suggests break-up of the residual SIS into a substantial ice cap over the Highlands and small ice caps over the Southern Uplands, Outer Hebrides, Orkney and Shetland.
For Peer Review
timing of ice-margin retreat (Hughes et al. 2011). This information was interpreted as a retreat pattern for the entire BIIS (Fig. 16), though Clark et al. (2012) acknowledged the uncertainties associated with matching up fragmentary landform evidence. Like Bradwell et al. (2008b) the starting point for their reconstruction was an ice sheet terminating at the Atlantic shelf edge at ~27 ka, although as noted in section 3.5 it now seems unlikely that the SIS reached the shelf edge in all sectors. Clark et al. (2012) and updated reconstructions based on similar data (Hughes et al.
2014, 2016) have outlined subsequent changes to ice-sheet configuration as a series of time slices. Their interpretations of the sequence of events affecting the Scottish Ice Sheet are summarised in Table 2.
The reconstructions outlined above differ in detail and timing of events, but agree on the general sequence, with the exception of the retreat phase at ~27 ka modelled by Hubbard et al.
(2009) and interpretation of events in the NSB. There is agreement that retreat of ice on the Atlantic shelf was probably driven by sea-level rise, development of calving margins and a prolonged period of dynamic reorganization of the northern SIS, represented by the multiple, sometimes overlapping moraines W of Orkney and N and E of Shetland. The reconstructions also suggest that substantial thinning and retreat of the SIS occurred mainly after ~22 ka, and particularly after ~19 ka, but was a complex affair involving transient ice streaming, divide migration and development of a polycentric ice sheet that was largely confined to the Scottish mainland and adjacent inner shelves by 17–16 ka, with some residual satellite ice caps or icefields.
7. Regional deglaciation 1: the offshore shelves, Northern Isles and Outer Hebrides
7.1. The northern sector of the last Scottish Ice Sheet
Deglaciation of the northern Hebrides Shelf and West Shetland Shelf has been reconstructed by Bradwell & Stoker (2015a), who employed the pattern of ice-marginal landforms mapped from high-resolution echo-sounder data and stratigraphic and sedimentological data (Stoker et al.
1993; Stoker & Varming 2011; Stoker 2013) to identify stages in ice-margin retreat (Fig. 12). Intervening and nearshore sequences of small, sharp-crested ridges in various locations are interpreted as De Geer moraines, implying that the larger moraine banks represent grounded ice margins terminating in shallow water.
For Peer Review
deglaciation of the North Minch and probably parts of eastern Lewis; and (3) progressive decoupling of ice nourished in NW Scotland from an ice mass that covered NE Caithness, Orkney and Shetland. The configuration of this ice mass is less certain. Bradwell & Stoker (2015a) suggested correlation of their stage 9 limit W of Orkney with moraine banks SE of Orkney (Fig. 12), but this solution appears to imply southwards ice movement across the northern coast of Caithness and shrinkage of the ice margin towards a residual ice cap on Orkney. The terrestrial field evidence, however, suggests that the final ice movement across both Caithness and Orkney was SE–NW, with no reported evidence for a late-stage Orkney ice cap (Hall et al.
2011, 2016b; Hall & Riding 2016).
The published dating evidence for these events is slender. The inferred stage 3 ice limit must post-date the retreat of the ice margin from North Rona at 28.7 ± 1.4 ka, and TCN dating of the Wester Ross Readvance (section 8.1) places the ice margin across the fjords and peninsulas in the south of the area depicted in Figure 12 at 15.3 ± 0.7 ka (section 8.1 below). Samples from bedrock surfaces and boulders on low ground at sites on Orkney have, excluding outliers, produced five recalibrated 10Be exposure ages of 17.2 ± 2.4 ka to 16.0 ± 2.0 ka (Phillips et al.
2008), with a weighted mean age of 16.5 ± 1.2 ka (Fig. 19), indicating that Orkney was largely ice-free by that time. Two samples from Dunnet Head on the N coast of Caithness have a mean age of 17.5 ± 1.1 ka, suggesting deglaciation of the Pentland Firth prior to the final deglaciation of Orkney.
7.2. Shetland
For Peer Review
7.3. The North Sea Basin (NSB)
Interpretation of the timing and nature of the decoupling of the SIS and FIS in the NSB has proved controversial. Forminifera and molluscs within stratified glacimarine or marine sediments overlying till (deformed marine sediments) in a core from the Witch Ground Basin (~162 km NE of Rattray Head) have produced radiocarbon ages of 27.0–26.3, 25.3–24.2 to 23.8–23.0 cal 14C ka (Sejrup et al. 1994). The oldest date suggests that the central NSB may have become deglaciated as early as ~27 ka (Sejrup et al. 1994, 2009, 2015; Graham et al. 2010). Other samples in contexts indicating deglaciation of this area are, however, much younger (< 22 cal 14C ka), suggesting a hiatus in the stratigraphic record (Sejrup et al. 2016).
Bradwell et al. (2008b) suggested that initial decoupling of the SIS and FIS followed a bathymetric depression that extends from the shelf edge N of Shetland southwards to the Witch Ground Basin. They argued that a calving margin propagated rapidly southward from the shelf edge, creating a marine embayment between the two ice sheets, an interpretation accepted by several authors (Graham et al. 2010; Sejrup et al. 2015; Merritt et al. 2017). The reconstruction by Clark et al. (2012) offered two possible scenarios: (1) early (~25 ka) and complete separation of the BIIS and FIS; and (2) partial decoupling of the SIS from the FIS by ~23 ka along a marine embayment similar to that proposed by Bradwell et al. (2008b). They noted, however, that the latter scenario requires persistence of a residual ice dome south of the proposed embayment, for which there is no evidence.
For Peer Review
Evidence for readvances of Scottish ice into the Witch Ground Basin has been identified by Sejrup et al. (2015), who presented bathymetric, stratigraphic and chronological evidence for two such events, the Fladen 1 and Fladen 2 readvances. The location and alignment of the associated ice margins suggests that although they may have been fed by ice from the Moray Firth, they could reflect advance of ice from an Orkney-Shetland centre to the NW. The associated radiocarbon ages are not all in sequence, but Sejrup et al. (2015) argued that the Fladen 1 readvance probably occurred at ~17.5 ka and the Fladen 2 event at ~16.2 ka. For the outer Moray Firth, west of the Witch Ground Basin, Graham et al. (2009) described evidence suggesting that formation of W–E aligned streamlined bedforms indicative of fast eastward flow of grounded ice was succeeded by westward retreat of the ice margin, then formation of broad N–S aligned morainic banks (the Little Halibut Bank and Bosies Bank) and multiple composite ice-marginal ridges. Farther W a series of transverse ridges indicate marine grounding-line positions or ice-push moraines that are succeeded westward by a zone of hummocky moraine. They interpreted this evidence as demonstrating that initial retreat of the ice margin in the outer Moray Firth was characterised by readvances, stillstands and possible 'surge-like' activity; the hummocky moraine farther west they interpreted as stagnant ice topography, indicating rapid retreat.
7.4. The Irish Sea Basin (ISB)
As outlined in section 3.3, the development of an ice divide between Scotland and NE Ireland during the LLGM appears to have limited the Scottish contribution to the Irish Sea Ice Stream (ISIS) to ice nourished in SW Scotland (Livingstone et al. 2012; Hughes et al. 2014; Figs. 5 and 7). Initial retreat of the ISIS from the Celtic Sea Shelf appears to have been rapid, with complete deglaciation of the southern ISB by 21.9–20.7 ka (Chiverrell et al. 2013; Patton et al. 2013; Smedley et al. 2017a). Foraminifera in raised marine muds in NE Ireland have yielded ages of 20.4–19.9 cal 14C ka, implying ice-free conditions in the eastern sector of the northern ISB before ~20 ka (McCabe & Clark 1998; P. U. Clark et al. 2004).
For Peer Review
Decoupling of the Scottish and Irish Ice Sheets over the North Channel probably occurred between ~16.5 and ~16.0 ka (Clark et al. 2012; Finlayson et al. 2014), marking the end of ice occupance in the ISB. Retreat of Irish ice from the North Channel was succeeded by a readvance of ice from west-central Scotland across NE Ireland, the East Antrim Coastal Readvance. McCabe & Williams (2012) reconstructed the limits of this readvance across 1800 km2 of NE Antrim, and argued that it occurred at ~15.6–15.0 ka. This timing was challenged by Finlayson et al. (2014), who argued that it conflicts inter alia with older TCN exposure ages from the Isle of Arran. They envisaged that invasion of SW-flowing Scottish ice across NE Antrim represented 'debuttressing' of the SW margin of the SIS following collapse of the Irish Ice Sheet around 16.5 ka, but both the timing and cause of this event remain uncertain.
7.5. The western sector of the last Scottish Ice Sheet
The western sector of the SIS comprised a northern zone, where ice from the Outer Hebrides Ice Cap (extended an unknown distance westward across the northern Hebrides Shelf, and a southern zone, dominated by SW flow of the Hebrides Ice Stream towards the shelf edge.
7.5.1. The Outer Hebrides and adjacent Hebrides Shelf. The timing and pattern of retreat of the Outer Hebrides Ice Cap on the Hebrides Shelf is poorly constrained. Peacock et al. (1992) reported radiocarbon ages of 22.5 ± 0.3 14C ka (26.7–26.0 cal 14C ka) for a shell from glacimarine deposits distal to moraine banks in the St Kilda basin ~60 km W of North Uist, and 15.3 ± 0.2 14C ka (18.3–17.9 cal 14C ka) for another from proximal glacimarine deposits on the same moraine banks. These dates indicate that the moraine banks were deposited by the last ice sheet, and that the ice margin retreated from this location before ~18 ka. For the southern part of the Outer Hebrides Ice Cap, Small et al. (2017a) reported mean TCN ages of 18.9 ± 1.1 ka for the deglaciation of Mingulay (but acknowledged that a single age of 17.3 ± 0.9 ka may indicate later deglaciation) and 17.1 ± 1.0 ka for deglaciation of Barra, 27 km farther N. A single (recalibrated) TCN age of 16.3 ± 0.9 ka obtained for a bedrock sample from a col in South Uist (Stone & Ballantyne 2006) suggests prior deglaciation of much of the southern Outer Hebrides (Fig. 19).
Three consistent TCN ages suggest that low ground in southern Harris was deglaciated by ~17.9 ka (unpublished data), implying that by that time the retreating ice cap had split into a southern component occupying the Uists and a northern component centred on the mountains of N Harris. Stone & Ballantyne (2006) obtained TCN ages for bedrock samples on low ground and cols in N Harris, but disparities amongst these suggest that most are compromised by nuclide inheritance. The two youngest (recalibrated) exposure ages indicate deglaciation by 17.3 ± 0.9 ka on low ground and by 16.6 ± 0.8 ka on a col at 425 m OD, and a single age of 15.6 ± 0.8 ka for a sample from the summit of Oreval (662 m OD) suggests that ice may have persisted over high ground as late as 16–15 ka (Fig. 19). No data have been published for the timing of ice retreat on Lewis, but as noted in section 6.2.1, early retreat of the Minch Ice stream and limited extension of the Outer Hebrides Ice Cap west of Lewis (Bradwell & Stoker 2015a) suggest early deglaciation of the coastal fringes of Lewis, followed by gradual ice retreat to the mountains of Harris.