Distributional semantics from text and images
Elia Bruni
CIMeC, University of Trento
Giang Binh Tran
EMLCT, Free University of Bolzano & CIMeC, University of Trento
Marco Baroni
CIMeC, University of Trento
Abstract
We present a distributional semantic model combining text- and image-based features. We evaluate this multimodal semantic model on simulating similarity judgments, concept clus-tering and the BLESS benchmark. When inte-grated with the same core text-based model, image-based features are at least as good as further text-based features, and they capture different qualitative aspects of the tasks, sug-gesting that the two sources of information are complementary.
1 Introduction
Distributional semantic modelsuse large text
cor-pora to derive estimates of semantic similarities be-tween words. The basis of these procedures lies in the hypothesis that semantically similar words tend to appear in similar contexts (Miller and Charles, 1991; Wittgenstein, 1953). For example, the mean-ing ofspinach(primarily) becomes the result of sta-tistical computations based on the association be-tween spinach and words like plant, green, iron,
Popeye, muscles. Alongside their applications in NLP areas such as information retrieval or word sense disambiguation (Turney and Pantel, 2010), a strong debate has arisen on whether distributional semantic models are also reflecting human cogni-tive processes (Griffiths et al., 2007; Baroni et al., 2010). Many cognitive scientists have however ob-served that these techniques relegate the process of meaning extraction solely to linguistic regularities, forgetting that humans can also rely on non-verbal
experience, and comprehension also involves the ac-tivation of non-linguistic representations (Barsalou et al., 2008; Glenberg, 1997; Zwaan, 2004). They argue that, without grounding words to bodily ac-tions and percepac-tions in the environment, we can never get past defining a symbol by simply pointing to covariation of amodal symbolic patterns (Harnad, 1990). Going back to our example, the meaning of
spinachshould come (at least partially) from our ex-perience with spinach, its colors, smell and the oc-casions in which we tend to encounter it.
We can thus distinguish two different views of how meaning emerges, one stating that it emerges from association between linguistic units reflected by statistical computations on large bodies of text, the other stating that meaning is still the result of an association process, but one that concerns the asso-ciation between words and perceptual information.
In our work, we try to make these two appar-ently mutually exclusive accounts communicate, to construct a richer and more human-like notion of meaning. In particular, we concentrate on percep-tual information coming from images, and we cre-ate a multimodal distributional semantic model ex-tracted from texts and images, putting side by side techniques from NLP and computer vision. In a nut-shell, our technique is based on using a collection of labeled pictures to build vectors recording the co-occurrences of words with image-based features, ex-actly as we would do with textual co-occurrences. We then concatenate the image-based vector with a standard text-based distributional vector, to ob-tain our multimodal representation. The prelimi-nary results reported in this paper indicate that
riching a text-based model with image-based fea-tures is at least not damaging, with respect to en-larging the purely textual component, and it leads to qualitatively different results, indicating that the two sources of information are not redundant.
The rest of the paper is structured as follows. Sec-tion 2 reviews relevant work including distribuSec-tional semantic models, computer vision techniques suit-able to our purpose and systems combining text and image information, including the only work we are aware of that attempts something similar to what we try here. We introduce our multimodal distributional semantic model in Section 3, and our experimental setup and procedure in Section 4. Our experiments’ results are discussed in Section 5. Section 6 con-cludes summarizing current achievements and dis-cussing next directions.
2 Related Work
2.1 Text-based distributional semantic models
Traditional corpus-based models of semantic repre-sentation base their analysis on textual input alone (Turney and Pantel, 2010). Assuming the distribu-tional hypothesis (Miller and Charles, 1991), they represent semantic similarity between words as a function of the degree of overlap among their lin-guistic contexts. Similarity is computed in a seman-tic space represented as a matrix, with words as rows and contextual elements as columns/dimensions. Thanks to the geometrical nature of the represen-tation, words are compared using a distance met-ric, such as the cosine of the angle between vectors (Landauer and Dumais, 1997).
2.2 Bag of visual words
In NLP, “bag of words” (BoW) is a dictionary-based method in which a document is represented as a “bag” (i.e., order is not considered), which contains words from the dictionary. In computer vision, “bag of visual words” (BoVW) is a similar idea for image representation (Sivic and Zisserman, 2003; Csurka et al., 2004; Nister and Stewenius, 2006; Bosch et al., 2007; Yang et al., 2007).
Here, an image is treated as a document, and fea-tures from a dictionary of visual elements extracted from the image are considered as the “words” repre-senting the image. The following pipeline is
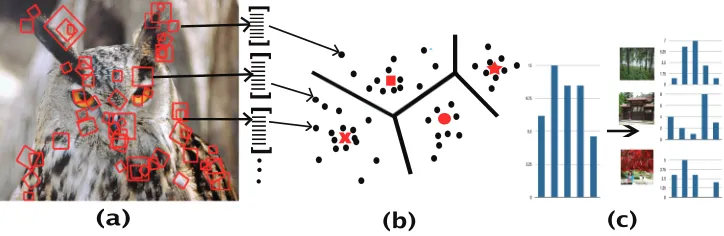
typ-ically adopted in order to group the local interest points into types (visual words) within and across images, so that then an image can be represented by the number of occurrences of each visual word type in it, analogously to BoW. From every image of a data set, keypoints are automatically detected and represented as vectors of various descriptors. Keypoint vectors are then projected into a common space and grouped into a number of clusters. Each cluster is treated as a discrete visual word (this tech-nique is generally known as vector quantization). With its keypoints mapped onto visual words, each image can then be represented as a BoVW feature vector according to the count of each visual word. In this way, we move from representing the image by a varying number of high-dimensional keypoint de-scriptor vectors to a representation in terms of a sin-gle sparse vector of fixed dimensionality across all images. What kind of image content a visual word captures exactly depends on a number of factors, in-cluding the descriptors used to identify and represent local interest points, the quantization algorithm and the number of target visual words selected. In gen-eral, local interest points assigned to the same visual word tend to be patches with similar low-level ap-pearance; but these common types of local patterns need not be correlated with object-level parts present in the images. Figure 1 illustrates the procedure to form bags of visual words. Importantly for our pur-poses, the BoVW representation, despite its unre-lated origin in computer vision, is entirely analogous to the BoW representation, making the integration of text- and image-based features very straightforward.
2.3 Integrating textual and perceptual
information
pro-Figure 1: Illustration ofbag of visual wordsprocedure: (a) detect and represent local interest points as descriptor vectors (b) quantize vectors (c) histogram computation to form BoVW vector for the image
duced descriptions, and they are expensive to collect from subjects via elicitation techniques.
Taking inspiration from methods originally used in text processing, algorithms for image labeling, search and retrieval have been built upon the connec-tion between text and visual features. Such models learn the statistical models which characterize the joint statistical distribution of observed visual fea-tures and verbal image tags (Hofmann, 2001; Hare et al., 2008). This line of research is pursuing the re-verse of what we are interested in: using text to im-prove the semantic description of images, whereas we want to exploit images to improve our approxi-mation to word meaning.
Feng and Lapata are the first trying to integrate authentic visual information in a text-based distribu-tional model (Feng and Lapata, 2010). Using a col-lection of BBC news with pictures as corpus, they train a Topic model where text and visual words are represented in terms of the same shared latent di-mensions (topics). In this framework, word meaning is modeled as a probability distribution over a set of latent multimodal topics and the similarity between two words can be estimated by measuring the topics they have in common. A better correlation with se-mantic intuitions is obtainable when visual modality is taken into account, in comparison to estimating the topic structure from text only.
Although Feng and Lapata’s work is very promis-ing and the main inspiration for our own, their method requires the extraction of a single distribu-tional model from the same mixed-media corpus. This has two important drawbacks: First, the tex-tual model must be extracted from the same corpus
images are taken from, and the text context extrac-tion methods must be compatible with the overall multimodal approach. Thus, image features can-not be added to a state-of-the-art text-based distri-butional model – e.g., a model computed on the whole Wikipedia or larger corpora using syntactic dependency information – to assess whether visual information is helping even when purely textual fea-tures are already very good. Second, by training a joint model with latent dimensions that mix textual and visual information, it becomes hard to assess, quantitatively and qualitatively, the separate effect of image-based features on the overall performance. In order to overcome these issues, we propose a somewhat simpler approach, in which the text- and image-based models are independently constructed from different sources, and then concatenated.
3 Proposed method
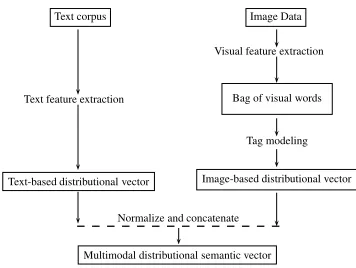
Figure 2 presents a diagram of our overall sys-tem. The main idea is to construct text-based and image-based co-occurrence models separately and then combine them. We first describe our proce-dure to build both text-based and image-based mod-els. However, we stress the latter since it is the more novel part of the procedure. Then, we describe our simple combination technique to integrate both models and create a multimodal distributional se-mantic space. Our implementation of the proposed method is open-source1.
[image:3.612.123.485.55.173.2]Image Data
Visual feature extraction
Bag of visual words
Image-based distributional vector Text-based distributional vector
Text feature extraction
Normalize and concatenate
[image:4.612.96.274.52.186.2]Multimodal distributional semantic vector Tag modeling Text corpus
Figure 2: Overview of our system architecture
3.1 Text-based distributional model
Instead of proposing yet another model, we pick one that is publicly available off-the-shelf and has been shown to be at the state of the art on a number of benchmarks. The picked model (DM)2 is encoded in a matrix in which each target word is represented by a row vector of weights representing its associa-tion with collocates in a corpus. See Secassocia-tion 4.1 for details about the text-based model.
3.2 Image-based distributional model
We assume image data where each image is associ-ated with word labels (somehow relassoci-ated to the im-age) that we calltags.
The primary approach to form the image-based vector space is to use the BoVW method to rep-resent images. Having reprep-resented each image in our data set in terms of the frequency of occurrence of each visual word in it, we construct the
image-based distributional vectorof each tag as follows.
Each tag (textual word) is associated to the list of images which are tagged with it; we then sum visual word occurrences across that list of images to ob-tain the co-occurrence counts associated with each tag. For uniformity with the treatment of textual co-occurrences (see Section 4.1), the raw counts are transformed into Local Mutual Information scores computed between each tag and visual word. Lo-cal Mutual Information is an association measure that closely approximates the commonly used Log-Likelihood Ratio while being simpler to compute (Evert, 2005).
In this way, we obtain an image-based
distribu-2http://clic.cimec.unitn.it/dm
tional semantic model, that is, a matrix where each row corresponds to a tag vector, summarizing the distributional history of the tag in the image collec-tion in terms of its associacollec-tion with the visual words.
3.3 Integrating distributional models
We assemble the two distributional vectors to con-struct the multimodal semantic space. Given a word that is present both in the text-based model and (as a tag) in the image-based model, we separately normalize the two vectors representing the word to length 1 (so that the text and image components will have equal weight), and we concatenate them to ob-tain the multimodal distributional semantic vector representing the word. The matrix of concatenated text- and image-based vectors is our multimodal dis-tributional semantic model. We leave it to future work to consider more sophisticated combination techniques (preliminary experiments on differential weighting of the text and image components did not lead to promising results).
4 Experimental setup
4.1 The DM text-based model
DM has been shown to be near or at the state of the art in a great variety of semantic tasks, ranging from modeling similarity judgments to concept cat-egorization, predicting selectional preferences, rela-tion classificarela-tion and more.
The DM model is described in detail by Baroni and Lenci (2010), where it is referred to as TypeDM. In brief, the model is trained on a large corpus of about 2.8 billion tokens that include Web docu-ments, the Wikipedia and the BNC. DM is a struc-tured model, where the collocates are labeled with the link that connect them to the target words. The links are determined by a mixture of dependency parse information and lexico-syntactic patterns, re-sulting in distributional features (the dimensions of the semantic space) such assubject kill,with gunor
as sharp as. The score of a target word with a fea-ture is not based on the absolute number of times they co-occur in the corpus, but on the variety of different surface realizations of the feature the word co-occurs with. For example, for the wordfat and the featureof animal, the raw score is 9 becausefat
fat of the animal, the fat of the animal, fats of an-imal. . . ). Refer to Baroni and Lenci (2010) for how the surface realizations of a feature are determined. Raw scores are then transformed into Local Mutual Information values.
The DM semantic space is a matrix with 30K rows (target words) represented in a space of more than 700M dimensions. Since our visual dimension extraction algorithms are maximally producing 32K dimensions (see Section 4.2 below), we make the impact of text features on the combined model di-rectly comparable to the one of visual features by selecting only the top n DM dimensions (with n
varying as explained below). The top dimensions are picked based on their cumulative Local Mutual Information mass. We show in the experiments be-low that trimming DM in this way does not have a negative impact on its performance, so that we are justified in claiming that we are adding visual in-formation to a state-of-the-art text-based semantic space.
4.2 Visual Information Extraction
For our experiments, we use the ESP-Game data set.3 It contains 50K images, labeled through the famous “game with a purpose” developed by Louis von Ahn (von Ahn and Dabbish, 2004). The tags of images in the data set form a vocabulary of 11K distinct word types. Image labels contain 6.686 tags on average (2.357 s.d.). The ESP-Game corpus is an interesting data set from our point of view since, on the one hand, it is rather large and we know that the tags it contains are related to the images. On the other hand, it is not the product of experts la-belling representative images, but of a noisy anno-tation process of often poor-quality or uninteresting images (e.g., logos) randomly downloaded from the Web. Thus, analogously to the characteristics of a textual corpus, our algorithms must be able to ex-ploit large-scale statistical information, while being robust to noise.
Following what has become an increasingly stan-dard procedure in computer vision, we use the Dif-ference of Gaussian (DoG) detector to automatically detect keypoints from images and consequently map them to visual words (Lowe, 1999; Lowe, 2004). We
3http://www.espgame.org
use the Scale-Invariant Feature Transform (SIFT) to depict the keypoints in terms of a 128-dimensional real-valued descriptor vector. Color version SIFT descriptors are extracted on a regular grid with five pixels spacing, at four multiple scales (10, 15, 20, 25 pixel radii), zeroing the low contrast ones. We chose SIFT for its invariance to image scale, ori-entation, noise, distortion and partial invariance to illumination changes. To map the descriptors to vi-sual words, we cluster the keypoints in their 128-dimensional space using the K-means clustering al-gorithm, and encode each keypoint by the index of the cluster (visual word) to which it belongs. We varied the number of visual words between 250 and 2000 in steps of 250. We then computed a one-level 4x4 pyramid of spatial histograms (Grauman and Darrell, 2005), consequently increasing the features dimensions 16 times, for a number that varies be-tween 4K and 32K, in steps of 4K. From the point of view of our distributional semantic model construc-tion, the important point to keep in mind is that stan-dard parameter choices such as the ones we adopted lead to distributional vectors with 4K, 8K, . . . , 32K dimensions, where a higher number of features cor-responds, roughly, to a more granular analysis of an image. We used the VLFeat implementation for the entire pipeline (Vedaldi and Fulkerson, 2008). See the references in Section 2.2 above for technical de-tails.
4.3 Model integration
We remarked above that the visual word extraction procedure naturally leads to 8 kinds of image-based vectors of dimensionalities from 4K to 32K in steps of 4K. To balance text and image information, we use DM vectors made oftop nfeatures ranging from 4K to 32K in the same 4K steps. By combining, we obtain 64 combined models (4K text and 4K im-age dimensions, 4K text and 8K imim-age dimensions, etc.). Since in the experiments on WordSim (Section 5.1 below) we observe best performance with 32K text-based features, we report here only experiments with (at least) 32K dimensions. Similar patterns to the ones we report are observed when adding image-based dimensions to text-image-based vectors of different dimensionalities.
an improvement, we must ask whether the same im-provement could also be obtained by adding more text-based features. To control for this possibility, we also consider a set of purely text-based mod-els that have the same number of dimensions of the combined models, that is, the top 32K DM features plus 8K, . . . , 32K further DM features (the next top features in the cumulative Local Mutual Information score ranking). In the experiments below, we refer to the purely textual model astext(always 32K dimen-sions), to the purely image-based model asimage, to the combined models ascombined, and to the con-trol in which further text dimensions are added for comparability withcombinedastext+.
4.4 Evaluation benchmarks
We conduct our most extensive evaluation on the
WordSim353 data set (Finkelstein et al., 2002),
a widely used benchmark constructed by asking 16 subjects to rate a set of word pairs on a 10-point similarity scale and averaging the ratings ( dol-lar/buckreceive a high 9.22 average rating, profes-sor/cucumber a low 0.31). We cover 260 Word-Sim (mostly noun/noun) pairs. We evaluate models in terms of the Spearman correlation of the cosines they produce for the WordSim pairs with the average human ratings for the same pairs (here and below, we do not report comparisons with the state of the art in the literature, because we have reduced cov-erage of the data sets, making the comparison not meaningful).
To verify if the conclusions reached on WordSim extend to different semantic tasks, we use two
con-cept categorizationbenchmarks, where the goal is
to cluster a set of (nominal) concepts into broader categories. The Almuhareb-Poesio (AP) concept set (Almuhareb, 2006), in the version we cover, con-tains 230 concepts to be clustered into 21 classes such as vehicle (airplane, car. . .), time (aeon, fu-ture. . .) orsocial unit(brigade, nation). TheBattig
set (Baroni et al., 2010), in the version we cover, contains 72 concepts to be clustered into 10 classes. Unlike AP, Battig only contains concrete basic-level concepts belonging to categories such as bird ( ea-gle, owl. . .),kitchenware (bowl, spoon. . .) or veg-etable (broccoli, potato. . .). For both sets, follow-ing the original proponents and others, we clus-ter the words based on their pairwise cosines in
the semantic space defined by a model using the CLUTO toolkit (Karypis, 2003). We use CLUTO’s built-in repeated bisections with global optimiza-tionmethod, accepting all of CLUTO’s default val-ues. Cluster quality is evaluated by percentage pu-rity (Zhao and Karypis, 2003). If nir is the num-ber of items from thei-th true (gold standard) class that were assigned to ther-th cluster, nis the total number of items andkthe number of clusters, then:
Purity= n1 Pkr=1max
i (n
i
r). In the best case
(per-fect clusters), purity is 100% and as cluster quality deteriorates, purity approaches 0.
Finally, we use the Baroni-Lenci Evaluation of Semantic Similarity (BLESS) data set made avail-able by the GEMS 2011 organizers.4 In the ver-sion we cover, the data set contains 174 concrete nominal concepts, each paired with a set of words that instantiate the following 6 relations: hyper-nymy (spear/weapon), coordination (tiger/coyote), meronymy (castle/hall), typical attribute (an ad-jective: grapefruit/tart) and typical event (a verb:
cat/hiss). Concepts are moreover matched with 3 sets of randomly picked unrelated words (nouns, ad-jectives and verbs). For each true and random rela-tion, the data set contains at least one word per con-cept, typically more. Following the GEMS guide-lines, we apply a model to BLESS as follows. Given the similarity scores provided by the model for a concept with all associated words within a relation, we pick the term with the highest score. We thenz -standardize the 8 scores we obtain for each concept (one per relation), and we produce a boxplot summa-rizing the distribution ofzscores per relation across the concepts (i.e., each box of the plot summarizes the distribution of the 174 scores picked for each re-lation, standardized as we just described). Boxplots are produced accepting the default boxplotting op-tion of the R statistical package5(boxes extend from first to third quartile, median is horizontal line inside the box).
4
http://sites.google.com/site/geometricalmodels/shared-evaluation
5 Results
5.1 WordSim
The WordSim results for our models across dimen-sionalities as well as for the fullDMare summarized in Figure 3.
+4K +8K +12K +16K +20K +24K +28K +32K 25
30 35 40 45 50 55
Adding more features to top 32K DM
Spearman coefficient(%)
Performance of distributional models on WordSim
[image:7.612.85.298.153.331.2]DM combined text image text+
Figure 3: Performance of distributional models on Word-Sim
The purely image-based model is having the worst performance in all settings, although even the lowest image-based Spearman score (0.29) is signif-icantly above chance (p. < 0.05), suggesting that the model does capture some semantic information. Contrarily, adding image-based dimensions to a tex-tual model (combined) consistently reaches the best performance, also better – for all choices of dimen-sionality – than adding an equal number of text fea-tures (text+) or using the full DM matrix. Inter-estingly, the same overall result pattern is observed if we limit evaluation to the WordSim subsets that Agirre et al. (2009) have identified assemantically similar(e.g., synonyms or coordinate terms) and se-mantically related (e.g., meronyms or topically re-lated concepts).
Based on the results reported in Figure 3, fur-ther analyses will focus on thecombinedmodel with +20K image-based features, since performance of
combineddoes not seem to be greatly affected by the dimensionality parameter, and performance around this value looks quite stable (it is better only at the boundary +4K value, and with +28K, where, how-ever, there is a dip for theimagemodel). Thetext+
performance is not essentially affected by the di-mensionality parameter, and we pick the +20K ver-sion for maximum comparability withcombined.
The difference between combined andtext+, al-though consistent, is not statistically significant according to a two-tailed paired permutation test (Moore and McCabe, 2005) conducted on the re-sults for the +20K versions of the models. Still, very interesting qualitative differences emerge. Table 1 reports those WordSim pairs (among the ones with above-median human-judged similarity) that have the highest and lowestcombined-to-text+cosine ra-tios, i.e., pairs that are correctly treated as similar by
combined but not by text+, and vice versa. Strik-ingly, the pairs characterizing the image-feature-enrichedcombinedare all made of concrete, highly imageable concepts, whereas thetext+pairs refer to very abstract notions. We thus see here the first ev-idence of the complementary nature of visual and textual information.
combined text+
tennis/racket physics/proton
planet/sun championship/tournament closet/clothes profit/loss
[image:7.612.328.525.335.418.2]king/rook registration/arrangement cell/phone mile/kilometer
Table 1: WordSim pairs with highest (first column) and lowest (second column)combined-to-text+cosine ratios
[image:7.612.370.484.539.620.2]5.2 Concept categorization
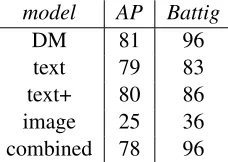
Table 2 reports percentage purities in the AP and Battig clustering tasks for fullDMand the represen-tative models discussed above.
model AP Battig
DM 81 96
text 79 83 text+ 80 86 image 25 36 combined 78 96
Table 2: Percentage AP and Battig purities of distribu-tional models
chance (p < 0.05 based on simulated distributions for random cluster assignment). Thus, even alone, image-based vectors do capture aspects of meaning. For AP, adding image features does not improve per-formance, although it does not significantly worsen it either (a two-tailed paired permutation test con-firms that the difference between text+ and com-bined is far from significance). For Battig, adding visual features improves on the purely text-based models based on a comparable number of features (although the difference between text+ and com-bined is not significant), reaching the same perfor-mance obtained with the full DM model (that in these categorization tests is slightly above that of the trimmed models). Intriguingly, the Battig test is en-tirely composed of concrete concepts, so the differ-ence in performance forcombinedmight be related to its preference for concrete things we already ob-served for WordSim.
5.3 BLESS
The BLESS distributions of text-based models (in-cludingcombined) are very similar, so we use here the fullDMmodel as representative of the text-based set – its histogram is compared to the one of the purelyimage-based model in Figure 4.
We see that purely text-basedDMcosines capture a reasonable scale of taxonomic similarity among nominal neighbours (coordinates then hypernyms then meronyms then random nouns), whereas verbs and adjectives are uniformly very distant, whether they are related or not. This is not surprising be-cause theDMlinks mostly reflect syntactic patterns, that will be disjoint across parts of speech (e.g., a feature like subject kill will only apply to nouns, save for parsing errors). Looking at the image -only model, we first observe that it can capture dif-ferences between related attributes/events and ran-dom adjectives/verbs (according to a Tukey HSD test for all pairwise comparisons, these differences are highly significant, whereas DM only signifi-cantly distinguishes attributes from random verbs). In this respect, imageis arguably the “best” model on BLESS. However, perhaps more interestingly, theimagemodel also shows a bias for nouns, cap-turing the same taxonomic hierarchy found forDM. This suggests that image analysis is providing a de-composition of concepts into attributes shared by
similar entities, that capture ontological similarity beyond mere syntagmatic co-occurrence in an im-age description.
To support this latter claim, we counted the av-erage number of times that the related terms picked by theimagemodel directly co-occur with the target concepts in an ESP-Game label. It turns out that this count is higher for both attributes (10.6) and hyper-nyms (7.5) than for coordinates (6.5). So, the higher similarity of coordinates in the image model demon-strates that its features do generalize across images, allowing us to capture “attributional” or “paradig-matic” similarity in visual space. More in general, we find that, among all the related terms picked by theimagemodel that have an above-average cosine with the target concept, almost half (41%)never co-occur with the concept in the image set, again sup-porting the claim that, by our featural analysis, we are capturing visual properties of similar concepts beyond their co-occurrence as descriptions of the same image.
A final interesting point pertains to the specific in-stances of each (non-random) relation picked by the textual and visual models: of 870 related term pairs in total, almost half (418) differ between DM and
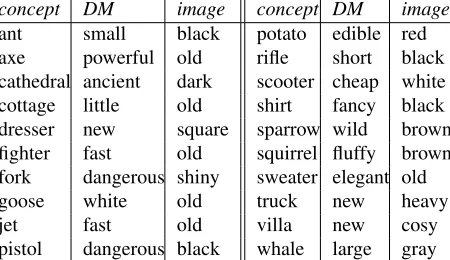
image, suggesting that the boxplots in Figure 4 hide larger differences in what the models are doing. The randomly picked examples of mismatches in top at-tributes from Table 3 clearly illustrate the qualitative difference between the models, and, once more, the tendency of image-based representations to favour (not surprisingly!) highly visual properties such as colours and shapes, vs. the well-known tendency of text-based models to extract systemic or functional characteristics such as powerfulor elegant(Baroni et al., 2010). By combining the two sources of infor-mation, we should be able to develop distributional models that come with more well-rounded charac-terizations of the concepts they describe.
6 Conclusion
● ● ● ● ● ● ● ● ● ● ● ● ● ● ● ● ● ● ● ● ● ● ● ●
COORD HYPER MERO ATTRI EVENT RAN.N RAN.J RAN.V
−1.0 −0.5 0.0 0.5 1.0 1.5 2.0 DM ● ● ● ● ● ● ● ● ● ● ● ● ● ● ● ● ● ● ● ● ● ● ● ● ● ● ● ● ● ● ● ● ● ● ● ● ● ● ● ● ● ● ● ● ● ● ● ● ● ● ● ● ● ● ● ● ● ● ● ● ● ● ● ● ● ● ● ● ● ● ● ● ● ● ●
COORD HYPER MERO ATTRI EVENT RAN.N RAN.J RAN.V
−1
0
1
2
[image:9.612.75.534.58.252.2]Image
Figure 4: Distribution of z-normalized cosines of words instantiating various relations across BLESS concepts.
concept DM image concept DM image
ant small black potato edible red
axe powerful old rifle short black
cathedral ancient dark scooter cheap white
cottage little old shirt fancy black
dresser new square sparrow wild brown
fighter fast old squirrel fluffy brown
fork dangerous shiny sweater elegant old
goose white old truck new heavy
jet fast old villa new cosy
pistol dangerous black whale large gray
Table 3: Randomly selected cases where nearest at-tributes picked by DM andimagediffer.
encoded in a vector of co-occurrences with “visual words”, that we concatenate with a text-based co-occurrence vector. A cautious interpretation of our results is that adding image-based features is at least not damaging, when compared to adding further text-based features, and possibly beneficial. Impor-tantly, in all experiments we find that image-based features lead to interesting qualitative differences in performance: Models including image-based infor-mation are more oriented towards capturing similar-ities between concrete concepts, and focus on their more imageable properties, whereas the text-based features are more geared towards abstract concepts and properties. Coming back to the discussion of symbol grounding at the beginning of the paper, we
consider this (very!) preliminary evidence for an in-tegrated view of semantics where the more concrete aspects of meaning derive from perceptual experi-ence, whereas verbal associations mostly account for abstraction.
In future work, we plan first of all to improve per-formance, by focusing on visual word extraction and on how the text- and image-based vectors are com-bined (possibly using supervision to optimize both feature extraction and integration with respect to se-mantic tasks). However, the most exciting direction we intend to follow next will concern evaluation, and in particular devising new benchmarks that ad-dress the special properties of image-enhanced mod-els directly. For example, Baroni and Lenci (2008) observe that text-based distributional models are se-riously lacking when it comes to characterize phys-ical properties of concepts such as their colors or parts. These are exactly the aspects of conceptual knowledge where image-based information should help most, and we will devise new test sets that will focus specifically on verifying this hypothesis.
References
Eneko Agirre, Enrique Alfonseca, Keith Hall, Jana Kravalova, Marius Pasc¸a, and Aitor Soroa. 2009. A study on similarity and relatedness using distributional and WordNet-based approaches. In Proceedings of
[image:9.612.73.298.303.433.2]Abdulrahman Almuhareb. 2006. Attributes in Lexical Acquisition. Phd thesis, University of Essex.
Mark Andrews, Gabriella Vigliocco, and David Vinson. 2009. Integrating experiential and distributional data to learn semantic representations. Psychological Re-view, 116(3):463–498.
Marco Baroni and Alessandro Lenci. 2008. Concepts and properties in word spaces. Italian Journal of Lin-guistics, 20(1):55–88.
Marco Baroni and Alessandro Lenci. 2010. Dis-tributional Memory: A general framework for corpus-based semantics. Computational Linguistics, 36(4):673–721.
Marco Baroni, Eduard Barbu, Brian Murphy, and Mas-simo Poesio. 2010. Strudel: A distributional semantic model based on properties and types. Cognitive Sci-ence, 34(2):222–254.
Lawrence Barsalou, Ava Santos, Kyle Simmons, and Christine Wilson, 2008. Language and Simulation in
Conceptual Processing, chapter 13, pages 245–283.
Oxford University Press, USA, 1 edition.
Anna Bosch, Andrew Zisserman, and Xavier Munoz. 2007. Image Classification using Random Forests and Ferns. InComputer Vision, 2007. ICCV 2007. IEEE 11th International Conference on, pages 1–8.
Gabriella Csurka, Christopher Dance, Lixin Fan, Jutta Willamowski, and C´edric Bray. 2004. Visual cate-gorization with bags of keypoints. InIn Workshop on Statistical Learning in Computer Vision, ECCV, pages 1–22.
Stefan Evert. 2005. The Statistics of Word Cooccur-rences. Dissertation, Stuttgart University.
Yansong Feng and Mirella Lapata. 2010. Visual infor-mation in semantic representation. In Human Lan-guage Technologies: The 2010 Annual Conference of the North American Chapter of the Association for Computational Linguistics, pages 91–99, Los Angeles, California. Association for Computational Linguistics. Lev Finkelstein, Evgeniy Gabrilovich, Yossi Matias, Ehud Rivlin, Zach Solan, Gadi Wolfman, and Eytan Ruppin. 2002. Placing search in context: The concept revisited. ACM Transactions on Information Systems, 20(1):116–131.
Arthur Glenberg. 1997. What memory is for. Behav Brain Sci, 20(1), March.
Kristen Grauman and Trevor Darrell. 2005. The pyramid match kernel: Discriminative classification with sets of image features. InIn ICCV, pages 1458–1465. Tom Griffiths, Mark Steyvers, and Josh Tenenbaum.
2007. Topics in semantic representation. Psychologi-cal Review, 114:211–244.
Jonathon Hare, Sina Samangooei, Paul Lewis, and Mark Nixon. 2008. Semantic spaces revisited: investigat-ing the performance of auto-annotation and semantic
retrieval using semantic spaces. InProceedings of the 2008 international conference on Content-based
im-age and video retrieval, CIVR ’08, pages 359–368,
New York, NY, USA. ACM.
Stevan Harnad. 1990. The symbol grounding problem.
Physica D: Nonlinear Phenomena, 42(1-3):335–346,
June.
Thomas Hofmann. 2001. Unsupervised Learning by Probabilistic Latent Semantic Analysis. Machine Learning, 42(1-2):177–196, January.
George Karypis. 2003. CLUTO: A clustering toolkit. Technical Report 02-017, University of Minnesota De-partment of Computer Science.
Thomas Landauer and Susan Dumais. 1997. A solu-tion to Plato’s problem: The latent semantic analysis theory of acquisition, induction, and representation of knowledge.Psychological Review, 104(2):211–240. Max Louwerse. 2011. Symbol interdependency in
sym-bolic and embodied cognition. Topics in Cognitive Science, 3:273–302.
David Lowe. 1999. Object Recognition from Local Scale-Invariant Features. Computer Vision, IEEE
In-ternational Conference on, 2:1150–1157 vol.2,
Au-gust.
David Lowe. 2004. Distinctive image features from scale-invariant keypoints. International Journal of
Computer Vision, 60(2), November.
George Miller and Walter Charles. 1991. Contextual cor-relates of semantic similarity. Language and Cogni-tive Processes, 6(1):1–28.
David Moore and George McCabe. 2005. Introduction
to the Practice of Statistics. Freeman, New York, 5
edition.
David Nister and Henrik Stewenius. 2006. Scalable recognition with a vocabulary tree. In Proceedings of the 2006 IEEE Computer Society Conference on
Computer Vision and Pattern Recognition - Volume 2,
CVPR ’06, pages 2161–2168.
Josef Sivic and Andrew Zisserman. 2003. Video Google: A text retrieval approach to object matching in videos.
In Proceedings of the International Conference on
Computer Vision, volume 2, pages 1470–1477,
Octo-ber.
Richard Szeliski. 2010. Computer Vision : Algorithms
and Applications. Springer-Verlag New York Inc.
Peter Turney and Patrick Pantel. 2010. From frequency to meaning: Vector space models of semantics. Jour-nal of Artificial Intelligence Research, 37:141–188. Andrea Vedaldi and Brian Fulkerson. 2008. VLFeat:
An open and portable library of computer vision algo-rithms.http://www.vlfeat.org/.
SIGCHI conference on Human factors in computing
systems, CHI ’04, pages 319–326, New York, NY,
USA. ACM.
Ludwig Wittgenstein. 1953. Philosophical
Investiga-tions. Blackwell, Oxford. Translated by G.E.M.
Anscombe.
Jun Yang, Yu-Gang Jiang, Alexander G. Hauptmann, and Chong-Wah Ngo. 2007. Evaluating bag-of-visual-words representations in scene classification. In James Ze Wang, Nozha Boujemaa, Alberto Del Bimbo, and Jia Li, editors, Multimedia Information
Retrieval, pages 197–206. ACM.
Ying Zhao and George Karypis. 2003. Criterion func-tions for document clustering: Experiments and analy-sis. Technical Report 01-40, University of Minnesota Department of Computer Science.