Simultaneous Similarity Learning and Feature-Weight Learning for
Document Clustering
Pradeep Muthukrishnan Dept of CSE, University of Michigan
Dragomir Radev School of Information,
Dept of CSE, University of Michigan
Qiaozhu Mei School of Information,
Dept of CSE, University of Michigan
Abstract
A key problem in document classification and clustering is learning the similarity between
documents. Traditional approaches include
estimating similarity between feature vectors of documents where the vectors are computed using TF-IDF in the bag-of-words model. However, these approaches do not work well when either similar documents do not use the same vocabulary or the feature vectors are not estimated correctly.
In this paper, we represent documents and keywords using multiple layers of connected
graphs. We pose the problem of
simultane-ouslylearning similarity between documents and keyword weights as an edge-weight regu-larization problem over the different layers of graphs. Unlike most feature weight learning algorithms, we propose an unsupervised algo-rithm in the proposed framework to simulta-neously optimize similarity and the keyword weights. We extrinsically evaluate the perfor-mance of the proposed similarity measure on two different tasks, clustering and classifica-tion. The proposed similarity measure out-performs the similarity measure proposed by (Muthukrishnan et al., 2010), a state-of-the-art classification algorithm (Zhou and Burges, 2007) and three different baselines on a vari-ety of standard, large data sets.
1 Introduction
The recent upsurge in the amount of text available due to the widespread growth of the Internet has led to the need for large scale, efficient Machine Learn-ing (ML), Information Retrieval (IR) tools for text
mining. At the heart of many of the ML, IR algo-rithms is the need for a good similarity measure be-tween documents. For example, a better similarity measure almost always leads to better performance in tasks like document classification, clustering, etc. Traditional approaches represent documents with many keywords using a simple feature vector de-scription. Then, similarity between two documents is estimated using the dot product between their corresponding vectors. However, such similarity measures do not use all the keywords together and hence, suffer from problems due to sparsity. There are two major issues in computing similarity be-tween documents
• Similar documents may not use the same vo-cabulary.
• Estimating feature weights or weight of a key-word to the document it is contained in.
For example, consider two publications, X and Y, in the field of Machine Learning. Let X be a paper on clustering whileY is on classification. Al-though the two publications use very different vo-cabulary, they are semantically similar. Keyword weights are mostly estimated using the frequency of the keyword in the document. For example, TF-IDF based scoring is the most commonly used approach to compute keyword weights to compute similarity between documents. However, suppose publications X and Y mention the keyword ”‘Machine Learn-ing”’ only once. Although, they are mentioned only once in the text of the document, for the purposes of computing semantic similarity between the
ments, it would be beneficial to give it a high key-word weight.
A commonly used approach to estimate seman-tic similarity between documents is to use an ex-ternal knowledge source like WordNet (Pedersen et al., 2004). However, these approaches are do-main dependent and language dependent. If docu-ment similarity can not be estimated accurately us-ing just the text, there have been approaches incor-porating multiple sources of similarity like link sim-ilarity, authorship similarity between publications (Bach et al., 2004; Cortes et al., 2009). (Muthukr-ishnan et al., 2010) also uses multiple sources of similarity. In addition to improving similarity es-timates between documents, it also improves sim-ilarity estimates between keywords. Co-clustering (Dhillon et al., 2003) based approaches are used to alleviate problems due to the sparsity and high-dimensionality of the data. In co-clustering, the key-words and the documents are simultaneously clus-tered by exploiting the duality between them. How-ever, the approach relies solely on the keyword dis-tributions to cluster the documents and vice-versa. It does not take into account the inherent similar-ity between the keywords (documents) when cluster-ing the documents (keywords). Also, co-clustercluster-ing takes as input the weight of all keywords to corre-sponding documents.
2 Motivation
First, we explain how similarity learning and fea-ture weight learning can mutually benefit from each other using an example. For example, consider the following three publications in the field of Machine Translation, (Brown et al., 1990; Gale and Church, 1991; Marcu and Wong, 2002)
Clearly, all the papers belong to the field of Ma-chine Translationbut (Gale and Church, 1991) con-tains the phrase ”‘Machine Translation”’ only once in the entire text. However, we can learn to attribute some similarity between (Brown et al., 1990) and the second publication using the text in (Marcu and Wong, 2002). The keywords ”‘Bilingual Corpora”’ and ”‘Machine Translation”’ co-occur in the text in (Marcu and Wong, 2002) which makes the keywords themselves similar. Now we can attribute some sim-ilarity between the (Brown et al., 1990) and (Marcu
and Wong, 2002) publication since they contain sim-ilar keywords. This shows how simsim-ilarity learning can benefit from important keywords.
Now, assume that ”‘Machine Translation”’ is an important keyword (high keyword weight) for the first and third publication while ”‘Bilingual Cor-pora”’ is an important keyword for the second pub-lication. We explained how to infer similarity be-tween the first and second publication using the third publication as a bridge. Using the newly learned similarity measure, we can infer that ”‘Bilingual Corpora”’ is an important keyword for the sec-ond publication since a similar keyword (”‘Machine Translation”’) is an important keyword for similar publications.
Let documentsDi andDj contain keywordsKik and Kjl. Then intuitively, the similarity between two documents should be jointly proportional to
• The similarity between keywordsKikandKjl • The weights ofKiktoDiandKjltoDj. Similarly the weight of a keywordKik to docu-mentDishould be jointly proportional to
• The similarity between documentsDiandDj. • The similarity between keyphrases Kik and
Kjland weight ofKjltoDj.
The major contributions of the paper are given be-low,
• A rich representation model for representing documents with associated keywords for effi-ciently estimating document similarity..
• A regularization framework for joint feature weight (keyword weight) learning and similar-ity learning.
• An unsupervised algorithm in the proposed framework to efficiently learn similarity be-tween documents and the weights of keywords for each document in a set of documents.
3 Problem Formulation
We assume that a set of keywords have been ex-tracted for the set of documents to be analyzed. The setup is very general: Documents are represented by the set of candidate keywords. In addition to that, we have crude initial similarities estimated between documents and also between keywords and the weights of keywords to documents. The similarities and keyword weights are represented using two layers of graphs. We formally define the necessary concepts,
Definition 1: Documents and corresponding keywords
We have a set of N documents D =
{d1, d2, . . . , dN}. Each document, di has a set ofmikeywordsKi={ki1, ki2, . . . , kimi}
Definition 2: Document Similarity Graph
The document similarity graph, G1 = (V1, E1),
consists of the set of documents as nodes and the edge weights represent the initial similarity between the documents.
Definition 3: Keyword Similarity Graph
The keyword similarity graph,G2 = (V2, E2),
con-sists of the set of keywords as nodes and the edge weights represent the initial similarity between the keywords.
The document similarity graph and the keyword similarity graph can be considered as two layers of graphs which are connected by the function defined below
Definition 4: keyword Weights (KW)
There exists an edge betweendiandkij for1≤j≤ mi. Let Z represent the keyword weighting func-tion, i.e, Zdi,kij represents the weight of keyword
kij t documentdi.
4 Regularization Framework
Ω(w, Z) =α0∗ISC(w, w∗) +α1∗IKC(Z, Z∗)
+α2∗KS(w, Z) +α3∗SK(Z, w) (1)
whereα0+α1+α2+α3= 1.
ISCrefers toInitialSimilarityCriterion andIKC refers toInitialKeyword weightCriterion. They are
defined as follows
ISC(w, w∗) = X
u,v∈G1
(wu,v−wu,v∗ )2 (2)
IKC(Z, Z∗) = X
u∈G1,v∈G2
(Zu,v−Zu,v∗ )2 (3)
KSrefers toKeyword basedSimilarity andSKrefers toSimilarity inducedKeyword weight. They are de-fined as follows
KS(w, Z) = X
u1,v1∈G1
X
u2,v2∈G2
Zu1,u2Zv1,v2
(wu1,v1 −wu2,v2)
2 (4)
and
SK(w, Z) = X
u1,v1∈G1
X
u2,v2∈G2
wu1,v1wu2,v2
(Zu1,u2 −Zv1,v2)
2
(5)
Then the task is to minimize the objective function. The objective function consists of four parts. The first and second parts are initial similarity criterion and initial keyword criterion. They ensure that the optimized edge weights are close to the initial edge weights. The weightsα0andα1ensure that the
op-timized weights are close to the initial weights, in other words, they represent the confidence level in initial weights.
The significance of the third and the fourth parts of the objective function are best explained by a sim-ple examsim-ple. Consider two graphs,G1 andG2. Let
G1 be the graph containing publications as nodes
and edge weights representing initial similarity val-ues. LetG2be the graph corresponding to keywords
and edge weights represent similarity between key-words. There is an edge from a nodeu1 inG1 to a
nodev1inG2if the publication corresponding tou1
contains the keyword corresponding tov1.
between documents in proportion to weights of key-words they contain and the similarity between the contained keywords.
Minimizing the similarity induced keyword part corresponds to updating keyword weights in propor-tion to the following
• Similarity betweenv1and other keywordsv2 ∈
G2
• Keyword weight ofv2to documentsu2 ∈G1
• Similarity betweenu1andu2
Therefore, even if frequency of a keyword such as ”‘Machine Translation”’ in a publication is not high, it can achieve a high keyword weight if it con-tains many other similar keywords such as ”‘Bilin-gual Corpora”’ and ”‘Word alignment”’.
5 Efficient Algorithm
We seek to minimize the objective function using Alternating Optimization (AO) (Bezdek and Hath-away, 2002), an approximate optimization method. Alternating optimization is an iterative procedure for minimizing (or maximizing) the function f(x) =
f(X1, X2, . . . , Xt) jointly over all variables by al-ternating restricted minimizations over the individ-ual subsets of variablesX1, . . . , Xt.
In this optimization method, we partition the set of variables into a set of mutually exclusive, exhaus-tive subsets. We iteraexhaus-tively perform minimizations over each subset of variables while maintaining the other subsets of variables fixed. Formally, let the set of real-valued variables beX={X1, X2, . . . , XN} be partitioned into m subsets, {Y1, Y2, . . . , Ym}.
Also, let si = |Yi|. Then we begin with the ini-tial set of values{Y10, Y20, . . . , Ym0}and make re-stricted minimizations of the following form,
min Yi∈Rsi
{f(Y1r+1, . . . , Yi−1r+1, Yi, Yi+1r, . . . , Ymr)} (6) wherei = 1,2, . . . , m. Theunderline notationYj indicates that the subset of variables Yj are fixed with respect to Yi. In the context of our prob-lem, we update each edge weight while maintaining other edge weights to be a constant. Then the prob-lem boils down to the minimization probprob-lem over a single edge weight. For example, let us solve the
minimization problem for edge weight correspond-ing to (ui, vj) whereui, vj ∈ G1 (The case where
ui, vj ∈ G2 is analogous). Clearly the objective
function is a convex function inw(ui, vj). The par-tial derivative of the objective function with respect to the edge weight is given below,
∂Ω(w, Z)
∂wui,vj
= 2α0(wui,vj−w∗ui,vj)
+2α2∗
X
u2,v2∈G2
(wui,vj −wu2,v2)Zu1,u2Zvj,v2
+α3∗
X
u2,v2∈G2
(Zui,u2−Zvj,v2)
2
wui,vjwu2,v2
. (7)
To minimize the above function, we set the partial derivative to zero which gives us the following ex-pression,
wuj,vk =
1
C1
(α0w∗ui,vj+
α2
X
u2,v2∈G2
Zui,u2 wu2,v2 Zvj,v2)(8)
where
C1 = α0+α2
X
u2,v2∈G2
Zui,u2 Zvj,v2
+α3 2
X
u2,v2∈G2
(Zui,u2 −Zvj,v2)
2w
u2,v2
Similarly, we can derive the update equation for keyword weights,Zui,uj as below,
Zui,uj =
1
C2
(α1Zu∗i,uj+
α3
X
v1∈G1
X
v2∈G2
wui,v1 wuj,v2 Zv1,v2)
(9)
where,
C2 = α1+α3
X
v1∈G1
X
v2∈G2
wui,v1 wuj,v2
+α2 2
X
v1∈G1
X
v2∈G2
(wui,v1 −wuj,v2)
2Z
The similarity score between two nodes is propor-tional to the similarity between nodes in the other layer. For example, the similarity between two doc-uments (keywords) is proportional to the similarity between the keywords the documents they contain (the documents they are contained in). C plays the role of a normalization constant. Therefore, for sim-ilarity between two nodes to be high, it is required that they not only contain a lot of similar nodes in the other graph but the similar nodes need to be im-portant to the two target nodes.
Similarly, a particular keyword will have a high weight to a document if similar keywords have high weights to similar documents. Also, it is neces-sary that the similarity between the keywords and the documents are high.
It can be shown that equations 8 and 9 converge q−linearlysince the minimization problem is con-vex in each of the variables individually and hence has a global and unique minimizer (Bezdek and Hathaway, 2002).
5.1 Layered Random Walk Interpretation
The above algorithm has a very nice intuitive inter-preation in terms of random walks over the two dif-ferent graphs. Assume the initial weights are transi-tion probability values after the graphs are normal-ized so that each row of the adjacency matrices sums to 1. Then the similarity between two nodesuandv in the same graph is computed as sum of two parts. The first part isα0 times the initial similarity. This
is necessary so that the optimized similarity values are not too far away from the initial similarity val-ues. The second part corresponds to the probability of a random walk of length 3 starting atuand reach-ingvthrough two intermediate nodes from the other graph.
The semantics of the random walk depends on whetheru,vare documents or keywords. For exam-ple, if the two nodes are documents, then the simi-larity between two documentsd1andd2is the
prob-ability of random walk starting at documentd1 and
then moving to a keyword k1 and then moving to
keywordk2and then to documentd2. Note that
key-words k1 and k2 can be the same keyword which
accounts for similarity between documents because they contain the same keyword.
Also, note that second and higher order
depen-dencies are also taken into account by this algo-rithm. That is, two papers may become similar be-cause they contain two keywords which are con-nected by a path in the keyword graph, whose length is greater than 1. This is due to the iterative nature of the algorithm. For example, keywords ”‘Machine Translation”’ and ”‘Bilingual corpora”’ occur often together and hence any co-occurrence based simi-larity measure will assign a high initial simisimi-larity value. Hence two publications which contain these words will be assigned a non-zero similarity value after a single iteration. Also, ”‘Bilingual corpora”’ and ”‘SMT”’ (abbreviation for Statistical Machine Translation) can have a high initial similarity value which enables assiging a high similarity value be-tween ”‘Machine Translation”’ and ”‘SMT”’. This leads to a chain effect as the number of iterations in-creases which helps assign non-zero similarity val-ues between semantically similar documents even if they do not contain common keywords.
6 Experiments
It is very hard to evaluate similarity measures in iso-lation. Thus, most of the algorithms to compute ilarity scores are evaluated extrinsically, i.e, the sim-ilarity scores are used for an external task like clus-tering or classification and the performance in the external task is used as the performance measure for the similarity scores. This also helps demonstrate the different applications of the computed similar-ity measure. Thus, we perform a variety of differ-ent experimdiffer-ents on standard data sets to illustrate the improved performance of the proposed similar-ity measure. There are three natural variants of the algorithm,
• Unified: We compare against the edge-weight regularization algorithm proposed in (Muthukr-ishnan et al., 2010). The algorithm has the same representation as our algorithm but the optimization is strictly defined over the edge weights in the two layers of the graph, wij0s and not on the keyword weights. Therefore, Zij are maintained constant throughout the al-gorithm.
ACL-ID Paper Title Research Topic W05-0812 Improved HMM Alignment Models for Languages With Scarce
Resources
Machine Translation
P07-1111 A Re-Examination of Machine Learning Approaches for Sentence-Level MT Evaluation
Machine Translation
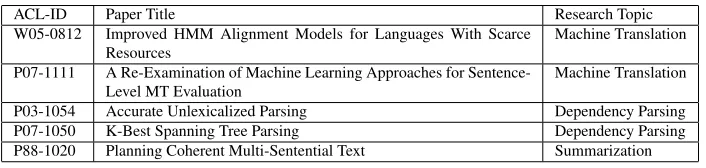
[image:6.612.128.481.53.137.2]P03-1054 Accurate Unlexicalized Parsing Dependency Parsing P07-1050 K-Best Spanning Tree Parsing Dependency Parsing P88-1020 Planning Coherent Multi-Sentential Text Summarization
Table 1: Details of a few sample papers classified according to research topic
• Unified-TFIDF: We initialize the keyword weights to the TFIDF scores, Zij is set to the TFIDF score of keywordjfor documenti.
Experiment Set I: We compare our similarity mea-sure against other similarity meamea-sures in the context of classification. We also compare against a state of the art classification algorithm which uses differ-ent similarity measures due to differdiffer-ent feature types without integrating them into one single similarity measure. Specifically, we compare our algorithm against three other similarity baselines in the context of classification which are listed below.
• Content Similarity: Similarity is computed us-ing just the feature vector representation usus-ing just the text. We use cosine similarity after pre-processing each document into a tf.idf vector for the AAN data set. For all other data sets, we use the cosine similarity on the binary fea-ture vector representation that is available.
• Link Similarity: Similarity is computed using only the links (citations, in the case of publica-tions). To compute link similarity, we use the node similarity algorithm proposed by (Harel and Koren, 2001) using a random walk of length 3 on the link graph.
• Linear combination: The content similarity (CS) and link similarity (LS) between docu-mentsxandyare combined in a linear fashion asαCS(x, y) + (1−α)LS(x, y). We tried dif-ferent values ofαand report only the best accu-racy that can be achieved using linear combina-tion of similarity measures. Note that this is an upper bound on the accuracy of Multiple Ker-nel Learning with the restriction of the combi-nation being affine.
We also compare our algorithm against the follow-ing algorithms SC-MV: We compare our algorithm against the spectral classification algorithm for data with multiple views (Zhou and Burges, 2007). The algorithm tries to classify data when multiple views of the data are available. The multiple views are rep-resented using multiple homogeneous graphs with a common vertex set. In each graph, the edge weights represent similarity between the nodes computed us-ing a sus-ingle feature type. For our experiments, we used the link similarity graph and the content simi-larity graph as described above as the two views of the same data
We use a semi-supervised graph classification al-gorithm (Zhu et al., 2003) to perform the classifica-tion.
Experiment Set II: We illustrate the improved performance of our similarity measure in the con-text of clustering. We compare our similarity mea-sure against the three similarity baselines mentioned above. We use a spectral graph clustering algorithm proposed in (Dhillon et al., 2007) to perform the clustering.
We performed our experiments on three different data sets. The three data sets are explained below.
• AAN Data: The ACL Anthology is a collec-tion of papers from the Computacollec-tional Lin-guistics journal as well as proceedings from ACL conferences and workshops and includes
15,160papers. To build the ACL Anthology
Network (AAN), (Radev et al., 2009) manu-ally performed some preprocessing tasks in-cluding parsing references and building the net-work metadata, the citation, and the author col-laboration networks. The full AAN includes the raw text of all the papers in addition to full citation and collaboration networks.
0.45 0.5 0.55 0.6 0.65 0.7 0.75 0.8 0.85 0.9
0 10 20 30 40 50 60 70
Content Link Linear SC-MV Unified Unified-binary Unified-TFIDF
(a) AAN
0.45 0.5 0.55 0.6 0.65 0.7 0.75 0.8
10 15 20 25 30 35 40
Content Link Linear SC-MV Unified Unified-binary Unified-TFIDF
(b) Cornell
0.5 0.55 0.6 0.65 0.7 0.75 0.8 0.85
10 15 20 25 30 35 40
Content Link Linear SC-MV Unified Unified-binary Unified-TFIDF
(c) Texas
0.5 0.55 0.6 0.65 0.7 0.75 0.8 0.85
10 15 20 25 30 35 40 45 50
Content Link Linear SC-MV Unified Unified-binary Unified-TFIDF
(d) Washington
0.5 0.55 0.6 0.65 0.7 0.75 0.8 0.85
10 15 20 25 30 35 40 45
Content Link Linear SC-MV Unified Unified-binary Unified-TFIDF
(e) Wisconsin
0.5 0.55 0.6 0.65 0.7 0.75 0.8 0.85 0.9 0.95 1
50 100 150 200 250 300 350 400 450 500
Content Link Linear SC-MV Unified Unified-binary Unified-TFIDF
[image:7.612.106.515.64.564.2](f) Cora
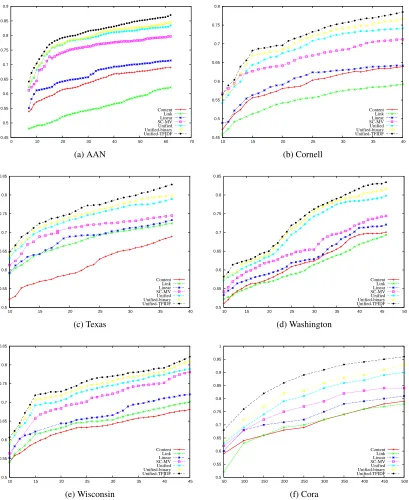
Figure 1: Classification Accuracy on the different data sets. The number of points labeled is plotted along the x-axis and the y-axis shows the classification accuracy on the unlabeled data.
chine Translation, Dependency Parsing, Sum-marization) from the ACL anthology. These topics are three main research areas in Natural Language Processing (NLP). Specifically, we collected all papers which were cited by
this would make the clustering task easy. The pruned list contains 1190 papers. We manually classified each paper into four classes (Depen-dency Parsing, Machine Translation, Summa-rization, Other) by considering the full text of the paper. The manually cleaned data set con-sists of 275 Machine Translation papers, 73 De-pendency Parsing papers and 32 Summariza-tion papers. Table 1 lists a few sample papers from each class.
WebKB(Sen et al., 2008): The data set con-sists of a subset of the original WebKB data set. The corpus consists of 877 web pages collected from four different universities. Each web page is represented by a 0/1-valued word vector with 1703 unique words after stemming and remov-ing stopwords. All words with document fre-quency less than 10 were removed.
Cora(Sen et al., 2008): The Cora dataset con-sists of 2708 scientific publications classified into one of seven classes. The citation network consists of 5429 links. Each publication in the dataset is described by a 0/1-valued word vec-tor indicating the absence/presence of the cor-responding word from the dictionary. The dic-tionary consists of 1433 unique words.
For all the data sets, we constructed two graphs, the kewyord feature graph and the link similarity graph. The keyword feature layer graph, Gf =
(Vf, Ef, wf) is a weighted graph where Vf is the set of all features. The edge weight between key-words fi and fj represents the similarity between the features. The edge weights are initialized to the cosine similarity between their corresponding doc-ument vectors. The link similarity graph, Go =
(Vo, Eo, wo) is another weighted graph where Vo is the set of objects. The edge weight represents the similarity between the documents and is initial-ized to the similarity between the documents due to the link structure. The link similarity between two documents is computed using the similarity mea-sure proposed by (Harel and Koren, 2001) on the citation graph. We also performed experiments by initializing the similarity between documents to the keyword similarity. Although, our algorithm still outperforms other algorithms and the baselines (not
shown due to space restrictions), the accuracy using citation similarity is higher.
7 Results and Discussion
Figure 1 shows the accuracy of the classification ob-tained using different similarity measures. It can be seen that the proposed algorithm (both the variants) performs much better than other similarity measures by a large margin. The algorithm performs much better when more information is provided in the form of TF-IDF scores. We attribute this to the rich representation of the data. In our algorithm, the data is represented as a set of heterogeneous graphs (layers) which are connected together instead of the normal feature vector representation. Thus, we can leverage on the similarity between the keywords and the objects (documents) to iteratively improve sim-ilarity in both layers. Whereas, in the case of the algorithm in (Zhou and Burges, 2007) all the graphs are isolated homogeneous graphs. Hence there is no information transfer across the different graphs.
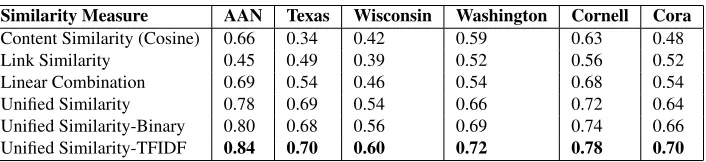
For the clustering task, we use Normalized Mu-tual Information (NMI) (Strehl and Ghosh, 2002) between the ground truth clusters and the outputted clustering as the measure of clustering accuracy.
Table 2 shows the Normalized Mutual Informa-tion scores obtained by the different similarity mea-sures on the different data sets.
8 Conclusion
Similarity Measure AAN Texas Wisconsin Washington Cornell Cora Content Similarity (Cosine) 0.66 0.34 0.42 0.59 0.63 0.48
Link Similarity 0.45 0.49 0.39 0.52 0.56 0.52
Linear Combination 0.69 0.54 0.46 0.54 0.68 0.54
Unified Similarity 0.78 0.69 0.54 0.66 0.72 0.64
[image:9.612.130.483.53.134.2]Unified Similarity-Binary 0.80 0.68 0.56 0.69 0.74 0.66 Unified Similarity-TFIDF 0.84 0.70 0.60 0.72 0.78 0.70
Table 2: Normalized Mutual Information scores of the different similarity measures on the different data sets
References
Francis R. Bach, Gert R. G. Lanckriet, and Michael I. Jordan. 2004. Multiple kernel learning, conic duality,
and the smo algorithm. InProceedings of the
twenty-first international conference on Machine learning, ICML ’04, pages 6–, New York, NY, USA. ACM.
James Bezdek and Richard Hathaway. 2002. Some notes on alternating optimization. In Nikhil Pal and Michio
Sugeno, editors, Advances in Soft Computing AFSS
2002, volume 2275 ofLecture Notes in Computer
Sci-ence, pages 187–195. Springer Berlin.
Peter F. Brown, John Cocke, Stephen A. Della Pietra, Vincent J. Della Pietra, Fredrick Jelinek, John D. Laf-ferty, Robert L. Mercer, and Paul S. Roossin. 1990. A
statistical approach to machine translation.
Computa-tional Linguistics.
Corinna Cortes, Mehryar. Mohri, and Afshin Ros-tamizadeh. 2009. Learning non-linear combinations
of kernels. InIn NIPS.
Inderjit S. Dhillon, Subramanyam Mallela, and Dhar-mendra S. Modha. 2003. Information-theoretic
co-clustering. InProceedings of the ninth ACM SIGKDD
international conference on Knowledge discovery and data mining, KDD ’03, pages 89–98, New York, NY, USA. ACM.
Inderjit S. Dhillon, Yuqiang Guan, and Brian Kulis.
2007. Weighted graph cuts without eigenvectors
a multilevel approach. IEEE Transactions on
Pat-tern Analysis and Machine Intelligence, 29(11):1944– 1957, November.
William A. Gale and Kenneth Ward Church. 1991. A program for aligning sentences in bilingual corpora. InIn Proceedings of ACL.
David Harel and Yehuda Koren. 2001. On clustering
us-ing random walks. InFoundations of Software
Tech-nology and Theoretical Computer Science 2245, pages 18–41. Springer-Verlag.
Daniel Marcu and William Wong. 2002. A phrase-based, joint probability model for statistical machine
transla-tion. InIn Proceedings of EMNLP.
Pradeep Muthukrishnan, Dragomir Radev, and Qiaozhu Mei. 2010. Edge weight regularization over multiple
graphs for similarity learning. InIn ICDM.
Ted Pedersen, Siddharth Patwardhan, and Jason
Miche-lizzi. 2004. Wordnet::similarity: measuring the
relatedness of concepts. In Demonstration Papers
at HLT-NAACL 2004, HLT-NAACL–Demonstrations ’04, pages 38–41, Stroudsburg, PA, USA. Association for Computational Linguistics.
Dragomir R. Radev, Pradeep Muthukrishnan, and Vahed Qazvinian. 2009. The ACL Anthology Network
cor-pus. InIn Proceedings of the ACL Workshop on
Nat-ural Language Processing and Information Retrieval for Digital Libraries.
Prithviraj Sen, Galileo Mark Namata, Mustafa Bilgic, Lise Getoor, Brian Gallagher, and Tina Eliassi-Rad.
2008. Collective classification in network data. AI
Magazine, 29(3):93–106.
Alexander Strehl and Joydeep Ghosh. 2002. Cluster en-sembles: a knowledge reuse framework for combining
partitionings. In Eighteenth national conference on
Artificial intelligence, pages 93–98, Menlo Park, CA, USA. American Association for Artificial Intelligence.
Dengyong Zhou and Christopher J. C. Burges. 2007.
Spectral clustering and transductive learning with
mul-tiple views. In ICML ’07, pages 1159–1166, New
York, NY, USA.
Xiaojin Zhu, Zoubin Ghahramani, and John Lafferty. 2003. Semi-supervised learning using gaussian fields
and harmonic functions. InICML 2003, pages 912–