2009
Exploring utilization of visualization for computer
and network security
Andy Luse Iowa State University
Follow this and additional works at:https://lib.dr.iastate.edu/etd Part of theBusiness Commons
This Dissertation is brought to you for free and open access by the Iowa State University Capstones, Theses and Dissertations at Iowa State University Digital Repository. It has been accepted for inclusion in Graduate Theses and Dissertations by an authorized administrator of Iowa State University Digital Repository. For more information, please [email protected].
Recommended Citation
Luse, Andy, "Exploring utilization of visualization for computer and network security" (2009).Graduate Theses and Dissertations. 12042.
security
by
Andrew William Luse
A dissertation submitted to the graduate faculty
in partial fulfillment of the requirements for the degree of
DOCTOR OF PHILOSOPHY
Co-Majors: Human Computer Interaction; Computer Engineering
Program of Study Committee: Anthony Townsend, Co-major Professor
Doug Jacobson, Co-major Professor Brian Mennecke
Kevin Scheibe Thomas Daniels Dimitris Margaritis
Iowa State University
Ames, Iowa
2009
T
ABLE OF
C
ONTENTS
LIST OF FIGURES ... iii
LIST OF TABLES ...iv
ABSTRACT ...v
CHAPTER 1: INTRODUCTION ...1
CHAPTER 2: ACOMPONENT-BASED FRAMEWORK FOR VISUALIZATION OF INTRUSION DETECTION EVENTS ...7
CHAPTER 3: CDCVIS: ACONFIGURABLE VISUALIZATION MECHANISM FOR CORPORATE NETWORK SECURITY ADMINISTRATION...36
CHAPTER 4: UTILIZING VISUALIZATION MECHANISMS TO IMPROVE USER PERFORMANCE DURING CYBER DEFENSE COMPETITIONS...72
CHAPTER 5: EMPLOYING INTERACTIVE MAPS TO INCREASE USER UTILIZATION OF VISUALIZATION MECHANISMS FOR NETWORK SECURITY ...92
CHAPTER 6: CONCLUSION ...122
L
IST OF
F
IGURES
Figure 1: Overall information visualization framework showing operational frameworks and
organizing structure... 19
Figure 2: Tudumi (Takada et al., 2002b) showing relation (available at http://www.vogue.is.uec.ac.jp/~koike/tudumi/tudumi1024.jpg). ... 23
Figure 3: TNV (Goodall, Lutters, Rheingans, & Komlodi, 2005a) showing historical timeline (available at http://userpages.umbc.edu/~jgood/research/tnv/scree nshots/tnv_web.png). ... 24
Figure 4: NVisionIP (Lakkaraju, Bearavolu, & Yurcik, 2003; Lakkaraju, Yurcik, Bearavolu, & Lee, 2004a; Lakkaraju, Yurcik, & Lee, 2004b) showing statistical extraction (available at http://security.ncsa.uiuc.edu/distribution/NVisionDownLoad/pix/AllViewBig.JPG). ... 25
Figure 5: Sidebar 1 ... 34
Figure 6: Sidebar 2 ... 35
Figure 1. Team layout for Cyber Defense Competition evaluation mechanism (CDC). ... 46
Figure 2. Global View of CDCVis configured for a CDC. ... 54
Figure 3. NetSquall visualization module... 55
Figure 4. Island visualization module (Oline et al. 2005)... 56
Figure 5. Map-based CDCVis visualization module. ... 57
Figure 6. Team View of CDCVis configured for a CDC. ... 58
Figure 1. CDCVis Team-based View ... 80
Figure 2. CDCVis Overall Network View... 82
Figure 1: UTAUT model highlighting measures utilized in the current study. ... 101
Figure 2: Teams involved in the CDC utilized for the study. ... 105
Figure 3: Example output from CDCVis viewed by both groups. ... 107
Figure 4: Map-based visualization mechanism of CDCVis. ... 108
Figure 5: Hierarchical models used for the study utilizing the independent variables PE (Performance Expectancy), EE (Effort Expectancy), SI (Social Influence), MU (Map Used), and NumSec (Number of Security courses) and the dependent variable BI (Behavioral Intent). ... 113
L
IST OF
T
ABLES
Table 1: Combinations of intrusion detection categorization types... 14
Table 2: Components for intrusion detection information visualization ... 22
Table 3: Component-based structure research analysis ... 26
Table 1. Design Science guidelines and how each is addressed in this manuscript. ... 39
Table 2. CDCVis modules and the respective ID information visualization components they address... 52
Table 3. Explanation of CDCVis information types by aggregation method. ... 53
Table 4. Sample size, mean, and standard deviations for study variables. ... 65
Table 5. Summary of regression results... 65
Table 1: Types of CDCs based on the roles of the students and other participants. ... 103
Table 2: Sample size, mean, and standard deviations for study variables. ... 111
A
BSTRACT
The role of the network security administrator is continually morphing to keep pace with
the ever-changing area of computer and network security. These changes are due in part to both
the continual development of new security exploits by attackers as well as improvements in
network security products available for use. One area which has garnered much research in the
past decade is the use of visualization to ease the strain on network security administrators.
Visualization mechanisms utilize the parallel processing power of the human visual system to
allow for the identification of possible nefarious network activity. This research details the
development and use of a visualization system for network security. The manuscript is
composed of four papers which provide a progression of research pertaining to the system. The
first paper utilizes research in the area of information visualization to develop a new framework
for designing visualization systems for network security. Next, a visualization system is
developed in the second paper which has been utilized during multiple cyber defense
competitions to aid in competition performance. The last two papers deal with evaluating the
developed system. First, an exploratory analysis provides an initial assessment using participant
interviews during one cyber defense competition. Second, a quasi field experiment explores the
C
HAPTER
1:
I
NTRODUCTION
1.1
O
RGANIZATIONThis document is composed of four separate manuscripts which comprise the research in,
development, and evaluation of a visualization product for Cyber Defense Competitions (CDCs).
Each manuscript is copied almost exactly from the original submission (except for some minor
formatting changes). The figures, tables, and references for each manuscript are included in the
same chapter as the respective manuscript as it did for the original submission. A general
introduction is provided here as well as a general conclusion at the end of this document. Also,
references utilized in the introduction and/or conclusion are included in a reference section at the
end of the entire document.
The manuscripts included in this document follow a logical progression from initial topic
research, through product development, and finally product evaluation. The first manuscript
proposes a new component-based framework for development of visualization systems for
network security. This manuscript utilizes information visualization theory primarily by
Shneiderman (Shneiderman & Plaisant, 2005) and Few (Few, 2006) as background for the
proposed methodology. A review of 23 network visualization products are then utilized as a
first-pass mechanism for verifying that the pieces of the proposed framework are currently being
utilized.
The second manuscript details the development of a system, Cyber Defense Competition
Visualization (CDCVis), for use by participants in a CDC. The manuscript utilizes a design
products as solutions to novel problems. The manuscript thoroughly describes the process
behind the development of the module-based CDCVis system. Parallels are then made between
the use of CDCVis during competitions and visualization for network security.
The third manuscript provides an exploratory analysis of the CDCVis system. The study
utilizes interviews with users of the system during actual deployment. The users include CDC
participants during a CDC competition. Textual analysis is utilized as a first pa ss at
understanding the usage of the CDCVis system.
Finally, the fourth and final manuscript describes a quasi field experiment utilized to
further analyze the use of CDCVis. Specifically, the research utilizes technology acceptance,
through the use of the Unified Theory of Acceptance and Use of Technology (UTAUT)
(Venkatesh, Morris, Davis, & Davis, 2003), to measure the likelihood that users of CDCVis
would be likely to use the system for network administration in the future.
1.2
L
ITERATURER
EVIEWThis section provides a brief literature review of some of the more pertinent topics
concerning the research in this document. Each of these topics is discussed in greater depth in at
least one of the included manuscripts. This section is only intended to give the reader a brief
introduction into the topics.
1.2.1
S
ECURITYA
DMINISTRATIONNetwork security administration is a daunting task that is ever-increasing in both
workload and complexity. The problem still remains that corporations are not willing to set
aside the necessary funds to adequately support network administration (Whitman, 2003). In
said that they allocated 5% or less of their overall IT budget to security while the average
estimated losses due to cybercrime increased (Richardson, 2008). This implies that while
cybercrime is increasing, the amount of money allocated to network security is still very
minimal. Therefore, network administrators must either do more with less, or neglect an area,
which can have severe repercussions for the organization.
Network security involves intrusion detection (ID) analysis of network activity. Two
types of ID exist. Signature-based detection utilizes pre-existing signatures of attacks which are
compared with current network traffic to detect intrusions (McHugh, Christie, & Allen, 2000;
Mukherjee, Heberlein, & Levitt, 1994). Anomaly-based detection begins by establishing a
baseline of ―normal‖ network activity and then detecting traffic which strays from this
established norm (Denning, 1986; Kemmerer & Vigna, 2002). Traditionally, signature-based
systems have been predominantly implemented utilizing text-based logs which must be serially
processed. Typically, human involvement with the actual analysis process is low as the shear
amount of logs is impossible to analyze (Takada & Koike, 2002).
1.2.2
V
ISUALIZATION FORC
OMPUTER ANDN
ETWORKS
ECURITYDuring the past decade, visualization for network security has become a hot research
topic. The infoVis community provides links to various research projects in the area of network
visualization (Aigner, 2009). Also, the VizSec community has promoted the issue both through
its online community as well as through its sponsored VizSec Conference (Inc., 2009).
Several products have been developed to promote research in the area of visualization for
network security. NVisionIP has been the subject of many different articles. The system utilizes
multiple views to allow the user to view various network segments with varying levels of
Lakkaraju, Yurcik, & Lee, 2004). TNV provides a timeline approach to allow the user to view
network traffic over time (Goodall, Lutters, Rheingans, & Komlodi, 2005), while
VisFlowConnect partitions the visualization screen into two parts to allow the user to view traffic
between the internal and external networks (Yin, Yurcik, Treaster, Li, & Lakkaraju, 2004).
These are just a few examples of many different research projects on network security
visualization (see Chapter 2 for more examples).
Three predominant frameworks have been proposed to help researchers more adequately
develop visualization systems for network security. The systems are based on three main areas
of the systems involved with network security: users, inputs (security alarms), and the
visualization components which make up the system. The user-based perspective looks at the
system from the user‘s perspective and tries to design the system around their needs (Goodall,
2005; Goodall, Lutters, & Komlodi, 2004; Goodall, Ozok, Lutters, Rheingans, & Komlodi, 2005;
Komlodi, Goodall, & Lutters, 2004; Komlodi, Rheingans, Ayachit, Goodall, & Joshi, 2005).
The input-based perspective, or w3 premise, designs the system around the security alerts which
are sent to the visualization system (Foresti, Agutter, Livnat, Moon, & Erbacher, 2006; Livnat,
Agutter, Moon, Erbacher, & Foresti, 2005). Finally, the component-based framework looks at
the system from the standpoint of the visual components with which it is composed (Luse,
Scheibe, & Townsend, 2008).
1.2.3
C
YBERD
EFENSEC
OMPETITIONSCyber defense competitions (CDCs) are utilized as a method for teaching network
security concepts using live exercises. These competitions have been shown to be effective for
teaching network security concepts (Conklin, 2006) and also for raising awareness of security
have been utilized to date. The first involves teams of students that both defend their
pseudo-corporate network while also trying to attack and exploit the networks of other student teams
(Cowan, Arnold, Beattie, Wright, & Viega, 2003; Hoffman, Rosenberg, Dodge, & Ragsdale,
2005). The second type requires students to act only as defenders of their corporate network
against attacks perpetrated by an external attacking team (Jacobson & Evans, 2006).
CDCs provide a rich test-bed for research in the area of network security administration.
While not a true field experiment setup, these competitions provide real-time attack scenarios
between actual defenders and attackers. Furthermore, most of these competitions require that the
student teams maintain certain corporate services (web, email, file transfer, etc.) which is directly
in-line with corporate network security administration.
1.3
P
URPOSE OFR
ESEARCH ANDM
ETHODOLOGYThe purpose of this research is to investigate current theories and research in the area of
visualization for computer and network security. This background will help to show the current
trends in the area and state-of-the-art theories. This understanding will allow for greater
understanding of visualization theory as it applies to computer and network security and
therefore allow the user to both critically examine research in the area and also better develop
visualization mechanisms of their own for network security.
Secondly, this research provides the development of a functioning prototype for
visualization of network security events. This prototype utilizes some of the extant research to
develop a system which can aid in network administration. Specifically, the system is developed
for CDCs, to allow participants at these competitions to better understand network security
concepts and better perform network security functions. The design science research
Third, this research provides an evaluation of the prototype utilizing both qualitative and
quantitative measures. These evaluations provide a first step at understanding how to evaluate
network security visualization systems. The exploratory research methodology provides a first
pass at understanding these types of systems, while the quasi field experiment provides a more
structured methodology for evaluation.
1.4
P
LAN OFP
RESENTATIONThe following chapters are reprints of papers which have been written pertaining to the
research plan above. Chapter 2 proposes a novel component-based framework for the
development of network security visualization systems. Chapter 3 details the develop ment of a
network visualization system for use during CDCs. Chapter 4 provides a qualitative analysis of
the system detailed in the previous chapter utilizing participant interviews during a CDC.
Chapter 5 details a quasi field experiment which tests the intention of users to utilize the system
developed in Chapter 3. Finally, Chapter 6 will offer some concluding remarks in regard to the
papers and also some limitations with the current implementation as well as future research
C
HAPTER
2:
A
C
OMPONENT
-B
ASED
F
RAMEWORK FOR
V
ISUALIZATION OF
I
NTRUSION
D
ETECTION
E
VENTS
Modified from a paper published in Information Security Journal
Andy Luse1, Kevin P. Scheibe, and Anthony M. Townsend
KEYWORDS
Intrusion Detection, Information Visualization, Framework, Security
ABSTRACT
Visualization systems for intrusion detection are becoming more prevalent with time, but the
lack of an organizing framework for proper development of these systems is problematic. This
paper introduces a component-based structure which can be used to adequately design and
implement intrusion detection information visualization systems. This component-based
structure implements a combination of common information visualization components with
operational components which are specific to the critical, real-time nature of intrusion detection.
The manuscript also performs an analysis of intrusion detection visualization research projects
by verifying their use of the components described by this framework.
1 I performed the primary portion of the manuscript preparation as well as the literature review and analysis for the
INTRODUCTION
The traditional method for network security examination has been the analysis of logs, a
tedious and difficult task with which many administrators contended. This analysis involved
sifting through text-based log files in a search for activity which could be interpreted as system
misuse. While many intrusions and security breaches have been detected by log examination, the
system is not without its flaws: First, the logs are encoded as simple text and uncovering a
security breach requires a highly serial examination of all of the log data; second, many logs only
record application specific behavior, which only provide information, often not security related,
relevant to specific applications on the system; finally, the sheer magnitude of the logs which
must be inspected is so immense that even well-intentioned examinations may be cursory and
ineffective (Takada & Koike, 2002b).
Intrusion Detection (ID) is a network security mechanism which has increased in
popularity during the last two decades and is seen as a viable method for dealing with nefarious
code, as well as network intrusions. The goal of ID is simple: detect intrusive behavior
(Kemmerer & Vigna, 2002) through an automated analysis of both network logs and real time
network traffic to prevent successful attacks on the network. ID relieves network specialists of
the tedium of log examination and offers a much quicker turnaround time than mere human
analysis, expediting intrusion detection and prevention.
Unfortunately, high false detection rates have eroded confidence in many ID
implementations. Two types of false detection, false positives and false negatives, can be
problematic. False positives interpret normal behavior as intrusive while false negatives fail to
recognize truly intrusive behavior (Koike, Ohno, & Koizumi, 2005). Current ID systems often
Information visualization (IV) has been explored extensively in recent years as a
mechanism for improving ID analysis of network traffic. This mechanism attempts to improve
the quality of the human contribution to the overall ID system, with the goal of reducing system
detection error. While IV-enabled systems continue to employ machine filtering for intrusive
behavior detection, the network specialist is given a more active role in the overall detection
strategy than in traditional ID systems. IV exploits the extraordinary capacity of the human
visual system for analyzing and understanding complex concepts via visual stimuli to augment
the automated processes of traditional ID.
IV-enabled ID systems are currently developed within one of two frameworks: A
user-based framework, where operator tasks receive the majority of visualization augmentation, or an
input-based framework, where the visual presentation of alerts is the impetus for visualization
development. While research and system design are well-documented within both of these
frameworks, research focusing on a comprehensive visualization scheme for ID systems has yet
to be explored. Accordingly, our research develops a comprehensive methodology for
IV-enabled ID systems that is consistent with extant research and practice, and which embraces
broader information visualization theory.
We first review background research in ID itself, in existing IV-enabled ID research, and
in IV theory. Following this review, we describe how IV theory suggests an additional
visualization framework that can be combined with existing IV-enabling systems to construct a
comprehensive visualization scheme. To demonstrate the viability of this comprehensive
approach we perform a review and analysis of 23 ID visualization systems that have been
BACKGROUND
Intrusion Detection (ID) was formally coined in the 1980‘s (Denning, 1986). Proctor
describes ID as ―the art of detecting and responding to computer misuse‖ (Proctor, 2001). ID
involves a machine or human detecting behavior on a computer or network which could be
intrusive and then taking actions to verify the behavior as truly intrusive before stopping or
mitigating the effects of the intrusive behavior.
Ideally, ID would be in real-time. If an attacker is performing an intrusive action, system
administrators would like to stop this action as soon as possible. Temporally speaking, the closer
the detection is to an attack the more proactive the system administrator can be to prevent
damage, and this is the goal for most ID systems. Towards this goal, several frameworks have
been developed for different types of ID systems. The remaining portion of this section provides
an overview of categorizations of the various types of ID systems.
Detection Type Categorization
Two primary methods can be used to decipher the intent of activities on a network –
signature-based and anomaly-based. Both methods have their inherent advantages and
disadvantages.
Signature-based systems employ descriptions or ―signatures‖ of known attacks to identify
a matching attack (McHugh, Christie, & Allen, 2000). The system compares the traffic or user
activity to a rule-base of techniques used by attackers to compromise systems (Mukherjee,
Heberlein, & Levitt, 1994). These signatures are typically made up of data which an attack
packet or stream would contain. The ID system collects raw packet data from network traffic and
compares these data to the signature. This type of detection mechanism is also known as misuse
mechanisms (Kemmerer et al., 2002). These signatures are analogous to the virus definitions a
virus scanner updates and uses to detect viruses in files.
Anomaly-based systems use models of intended or ―normal‖ behavior on the network as
a baseline to detect deviations from this norm (Kemmerer et al., 2002). This approach assumes
that exploitation of system vulnerabilities will involve some abnormal use of the system
(Denning, 1986). Detecting intrusive behavior based on deviations from an established norm
allows the system to detect novel attacks (McHugh et al., 2000). Whereas signature-based
systems rely on encoding of previously known attacks, anomaly-based systems do not rely on
such signatures.
While both detection type methods are currently in use, anomaly-based mechanisms are
more widely deployed for IV. Signature-based visual analysis is generally useful only after an
operator has worked with a system for some time and begins to recognize certain visual patterns
as specific attacks. Conversely, anomaly-based methods can be employed successfully by all
technicians, even those new to the network. Operators will begin to notice visual o utliers that
deviate from the normal visual pattern of network data and, consequently, explore this abnormal
data further for possible intrusive activity.
Topology-based Categorization
Topology-based ID categorizations provide delineations according to the ID system‘s
position within the network topology. This position in the network allows multiple, differently
located detection mechanisms to more efficiently analyze certain types of intrusive activity
across the system. Within each of these topology-based categorizations, the respective system
can consist of signature-based or anomaly-based detection. Table 1, following this section, gives
Network-based ID systems typically consist of independent machines on the network
which are used to monitor the network traffic flow for intrusions (Mukherjee et al., 1994).
Network ID systems analyze packets as they traverse the network from host to host. A variety of
filters can be set to analyze fields within the packet header as well as the data portion of the
packet. Network-based ID systems offer an overview of all activity on the network and are
usually placed at a critical position in the network (e.g. where the internal corporate network
connects to the external Internet). For this reason, network-based ID systems see all traffic going
into and out of a network and, therefore, are capable of showing a high-level overview of
network traffic.
Host-based systems operate on a single host within the network, analyzing audit and/or
log data as well as traffic to and from the host. Various application and operating system (OS)
logs can be used to discover a broader range of intrusive behavior as opposed to solely analyzing
network traffic data (which is performed by network-based ID). Also, the behaviors and system
calls of various applications on the host can be monitored for anomalous behavior (McHugh et
al., 2000). Host-based ID systems are superior for analyzing host-specific data. Host-based
systems can monitor various applications in a way that would be impossible for a network ID
system because it involves intrusive acts on the computer which does not send data across the
network (McHugh et al., 2000). Host ID systems have a greater understanding about what
payloads of packets will do to a specific host (Xin, Dickerson, & Dickerson, 2003).
Distributed ID systems combine information from distributed nodes into a central
repository for further analysis (Snapp, Brentano, Dias, Goan, Heberlein, Ho, Levitt, Mukherjee,
Smaha, Grance, Teal, & Mansur, 1996). Each host in the network is equipped with a monitoring
machine can then correlate this host data with data it has collected using network-based ID
mechanisms (Mukherjee et al., 1994). Distributed ID systems attempt to combine the advantages
of both network-based and host-based ID systems. With distributed, host-based sensors at each
machine, intrusive activity that occurs at a single host is monitored even if it is not visible to a
network monitor. The data from these individual monitors are then used to augment the data
which has been collected using network-based ID systems. In this way both ID types are
leveraged together to better understand the activity on the network as a whole.
While all three of the above topology-based ID types have been used for data collection
for ID visualization systems, network-based systems are currently the most often employed.
There are several reasons for this. First, many companies are primarily interested in attacks
which originate from the Internet and are not as concerned with activities on any single host.
Second, the burden of collecting data from multiple machines greatly decreases the likelihood of
real-time data analysis, which is a primary expectation for the system. Third, the cost involved
with deploying many host-based or distributed ID endpoints is much greater than deploying one
Table 1: Combinations of intrusion detection categorization types
Detection Type Categorizations
Topology-based
Categorizations Signature-based Anomaly-based
Network
compares network traffic to rules of already known intrusive behavior
analyzes network traffic for deviations fro m "normal" tra ffic patterns (current work)
Host
compares host activity with rules of already known intrusive behavior
analyzes host activity for deviations fro m "normal" system usage
Distributed
gathers information fro m distributed endpoints and combines this with network data comparing this data to rules of already known intrusive behavior
gathers information fro m distributed endpoints and combines this with network data analyzing this data for deviations fro m "normal " system usage
Information Visualization Theory
In its broadest sense, information visualization utilizes computer graphics to help
understand abstract data. Many scientific disciplines (geology, meteorology, animal science, etc.)
use conventional visualizations to help analyze data which are based on underlying spatial data
(Chi, 2002). Conversely, IV is designed to take advantage of visualizations that represent
abstract data (Card, Mackinlay, & Shneiderman, 1999). Industries such as banking,
manufacturing and consumer products are using IV for analysis (Wright, 1997). Other
applications of IV exist in data mining and knowledge discovery (Fayyad, Grinstein, & Wierse,
2001), concept maps (Cañas, Carff, Hill, Carvalho, Arguedas, Eskridge, Lott, & Carvajal, 2005)
and medicine (Chittaro, 2001), to name a few.
Information Visualization Components
IV theory posits that common components become necessary for the user when
framework of certain components which should be available to the user of any IV system. These
components provide the user with a usability structure that enables effective interaction with the
data that is being visually presented, and are necessary regardless of the type of data being
visualized.
Overview – An overview provides an overall picture of the entire underlying dataset of an
IV system. This type of view commonly includes zoomed-out pictures of the data with an
adjoining detail view.
Zoom – Zooming allows the user to zoom in and focus on a specific portion of the IV.
Quality systems allow the user to control this feature fluidly and provide smooth zooming to
preserve the user‘s sense of position and context.
Filter – The filter task allows the user to filter out uninteresting data values and focus on
those items of interest. This can follow either a subtractive model (where the user removes those
values he or she deems unneeded or uninteresting) or a additive model (where the user highlights
items which he or she believes are of greater interest, thereby drawing attention away from
uninteresting data values).
Details-on-demand – The user is allowed to select certain aspects of the visualization to
gain more detailed information about the underlying information pertaining to that piece or
subsection of the data. Details-on-demand typically coincide with the overview task and the
zoom task above.
Relate – Relation allows the users to specify relations among data present in the
visualization system. These relationships can be revealed using lines, colors, textures, as well as
History – History allows users to review the visualization during past states. This allows
the user to replay the data for further review, undo actions taken, and also refine actions.
Extract – The user is allowed to extract data and or visualizations for later viewing or
displaying to others. This often involves statistical summaries using common statistical
visualization methods (histograms, pie charts, etc.) or captures of the visualization state at
specific moments.
The Real-Time Imperative
Requirements for IV systems differ based on the requirements for the system. The book
Information Dashboard Design (Few, 2006) describes visual dashboards which are used to aid in
various business activities. The book describes some interesting taxonomies of task orienta tions
(e.g., role-based classification, orientating the visuals toward strategic, operational, and
analytical functions) but most importantly, notes the imperative for real-time display of
information when visualizing time-dependent activities. While this may seem to be a self-evident
characteristic for security visualizations, it is not a characteristic common to all IV and must be
added to the general component structure described above. All of the components of an
IV-enabled ID system must present both historical system data, as well as real-time information as it
is happening.
Curre nt Intrusion Detection Visualization
Little research has been done in designing a comprehensive structure for intrusion
operational frameworks, which are based on the two primary actors in an ID visualization
system: the user and the alert.
The user-based framework (Goodall, 2005; Goodall, Lutters, & Komlodi, 2004; Goodall,
Ozok, Lutters, Rheingans, & Komlodi, 2005b; Komlodi, Goodall, & Lutters, 2004; Komlodi,
Rheingans, Ayachit, Goodall, & Joshi, 2005) describes an approach which looks at ID
visualization systems from the user‘s perspective. Research in this aspect of system design
involved interviews and prototype evaluations using security analysts with ID expertise. This
work led to a user-based process model for ID visualization. The model laid out a framework
based on three phases of user interaction with the system: monitoring, analysis, and response.
Each of these three areas involves certain user tasks included in the following delineation.
1. Monitoring: monitoring attack alerts and identifying potential attacks
2. Analysis: analyzing alerts and other data to diagnose an attack
3. Response: responding to the attack, documenting and then reporting
In (Komlodi et al., 2004), the authors broadly describe high-level visualization mechanisms
which analysts need access to during the above three phases, but do not offer detail and instead
focus on the user process. The research offers a very good framework for user policy when
delineating necessary tasks for the successful use of an ID visualization system.
The alert-oriented framework (Foresti, Agutter, Livnat, Moon, & Erbacher, 2006; Livnat,
Agutter, Moon, Erbacher, & Foresti, 2005) is designed around the presentation of system alerts.
The authors‘ framework, which they refer to as the w3 premise, focuses on three attributes of a
possible attack on the network. This includes when in time the alert happened, where the alert
primary item of interest, and designs the system around what is necessary to assess these alerts
effectively. The framework allows for effective ID visualization by designing the system
entirely around the data inputs to the system.
Taken together, these two frameworks codify the operational underpinnings of effective
ID visualization; however, while they describe what the system needs to accomplish, they do not
offer a clear methodology of presentation, in particular, one which is consistent with broader IV
theory. By taking these operational dicta and reforming them within Shneiderman‘s component
structure (Shneiderman et al., 2005), they offer a unified and comprehensive approach to
effective visualization of network security.
A COMPREHENSIVE SYSTEM
Development of any visualization system necessarily involves various pieces which
interact. A comprehensive system for development provides a clear sense of the operational
needs for the system and an effective method to structure these operations for the most effective
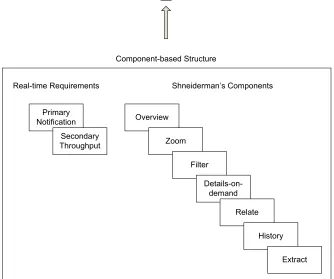
user visualization and interaction. In Figure 1, we present a diagram of this system that shows the
operational criteria presented within the user-based and input-based frameworks, along with the
Input-based Framework
Information Visualization
System
User-based Framework
Overview
Zoom
Filter
Details-on-demand
Relate
History
Extract Primary
Notification Secondary Throughput
Shneiderman’s Components
Real-time Requirements
[image:25.612.139.473.190.469.2]Component-based Structure
Figure 1: Overall information visualization framework showing operational frameworks and org anizing structure.
In more detail, the comprehensive framework shows:
1. User-based framework, which looks at the system from a user‘s perspective. This
framework describes the processes the user executes when interacting with the system.
2. Input-based framework, which focuses on the presentation of data gleaned from the
various network security analyses.
3. Component-based structure, describes the actual method of presenting the above
visually presented, it would be presented in a system where each activity would have
overview, zoom, filter, etc. capacity to allow for maximally efficient interaction between
the user and the IV-enabled system.
An effective framework for ID visualization thus incorporates the operational imperatives
of both the user-based framework (Goodall, 2005; Goodall et al., 2004; Goodall et al., 2005b;
Komlodi et al., 2004; Komlodi et al., 2005) and the input-based framework (Foresti et al., 2006;
Livnat et al., 2005) organized within a component-based structure.
At this point, we can present our ID visualization framework in full detail; with the
component-based structure for ID visualization systems built around the data, activities, and
analyses unique to the underlying nature of ID data. The common visualization components are
taken from Shneiderman (Shneiderman et al., 2005) (as described above).
The operational role also dictates two additional real-time requirements which are critical
in ID visualization: primary notification and secondary throughput(Few, 2006). Primary
notification describes the necessary requirement that the user is made aware of an alert. If the
user is not notified that an alert has arisen, the user will not be able to respond to the alert in a
timely fashion. Second, the data necessary to evaluate and respond to an alert must be made
available to the user. This entails the throughput of the information related to the identified alert.
Using the combination of the above elements, a component-based structure can be
described. These common visual components will be described in relation to their use in ID
Overview – Provides an overall picture of the network. This may be a literal mapping of
the data to physical locations or a logical mapping with no tie to physical space. An overview
allows the analyst to get an idea of what is occurring on the entire network.
Zoom – Allows the analyst to zoom in on a specific area of the network. This may
correspond to increased network activity in a specific area or greater detail of an area where an
alert has been spotted.
Filter – Filter allows the analyst to focus on specific characteristics of interest on the
network. The subtractive model would allow the user to remove those items on the network
which he or she is not currently interested in. The additive model allows the user to highlight
(possibly using colors, contrast, etc.) those items of interest.
Details-on-demand – The analyst can select certain aspects of the visualization to receive
detailed information about the network, traffic, and/or alerts in a specific section. Many times
this involves two separate views where the user clicks on one view and receives information
pertaining to the selection in the first view displayed in the second view.
Relate – Analysts can setup relationships between similar items. Typically this involves
using various visual mechanisms (lines, colors, textures) to delineate this relationship (see Figure
2).
History – The analyst is allowed to review past network traffic and alert data. This will
allow for reconnaissance as well as evidentiary corroboration for legal trials which may result
from certain illegal acts perpetrated on the network (see Figure 3).
Extract – Extraction allows the analyst to capture the state of the network at specific
moments of interest. Many times statistical charts (histograms, pie charts, etc.) as well as screen
Primary Notification – The user is notified that an alert has occurred. This involves
real-time notification and may even occur before all the data pertaining to the alert is available to the
user. This is different from traditional IV systems which typically have all the pertinent
information available when it is made available to the user. This type of visual notification is
usually accomplished with visual cues such as color change, flashing, etc.
Secondary Throughput – The data pertaining to a specific alert is made available to the
user for greater detail once the data has been completely received. This component typically
[image:28.612.120.494.316.465.2]utilizes the details-on-demand component above and will therefore be categorized with it.
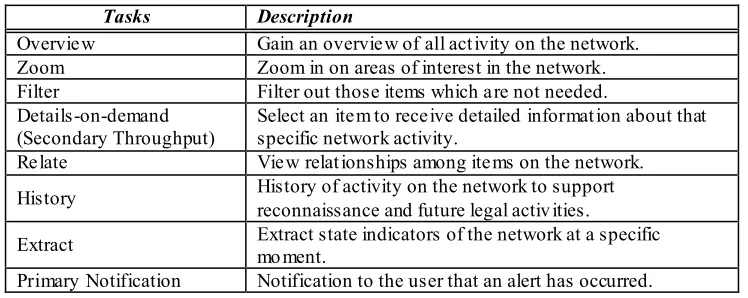
Table 2: Components for intrusion detection information visualization
Tasks Description
Overview Gain an overview of all activity on the network. Zoom Zoom in on areas of interest in the network. Filter Filter out those items which are not needed. Details-on-demand
(Secondary Throughput)
Select an item to receive detailed information about that specific network activity.
Relate View relationships among items on the network. History History of activity on the network to support
reconnaissance and future legal activ ities.
Extract Extract state indicators of the network at a specific mo ment.
Figure 4: NVisionIP (Lakkaraju, Bearavolu, & Yurcik, 2003; Lakkaraju, Yurcik, Bearavolu, & Lee, 2004a; Lakkaraju, Yurcik, & Lee, 2004b) showing statistical extraction (available at
http://security.ncsa.uiuc.edu/distribution/NVisionDownLoad/pix/AllViewBig.JPG).
ANALYSIS
To examine the viability of our framework with regard to contemporary systems, we
analyzed 23 ID visualization systems described by research in this area. We attempted to be as
complete as possible in the compilation of the list of ID visualization system research. Table 3
provides a listing of the features of the component-based structure which are evident in these
projects. Most products have been listed and referenced using their given name, but those which
Table 3: Component-based structure research analysis
Component-based Sub-Framework Elements
Product
O
ve
rvi
ew
Zoom Filte
r D etai ls -on -D eman d (S ec on d ar y Th rou gh p u t) R el ate H is tor y Extr ac t P ri mar y N oti fi cati on
IDS-V(Hiraishi & Mizoguchi, 2001) x x x x x x
(Erbacher, 2003) x x x x
Tudumi(Takada et al., 2002b) x x x
NIVA(Ny arko, Capers, Scott, & Ladeji-Osias, 2002) x x x x
SnortView(Koike & Ohno, 2004) x x x x
CyberSeer(Papadopoulos, Ky riakakis, Sawchuk, & He, 2004) x x x
TNV(Goodall et al., 2005a) x x x x x
(Colombe & Stephens, 2004) x x x x
VisFlowConnect(Yin, Yurcik, Treaster, Li, & Lakkaraju, 2004) x x x x x x x
PortVis(McPherson, Ma, Kry stosk, Bartoletti, & Christensen, 2004) x x x
VISUAL(Ball, Fin k, & North, 2004) x x x x
NVisionIP(Lakkaraju et al., 2003; Lakkaraju et al., 2004a; Lakkaraju et al., 2004b) x x x x x x x
SCPD(Lau, 2004) x x
(Krasser, Conti, Grizzard, Gribschaw, & Owen, 2005) x x x x x
Flatland(Fisk, Smith, Weber, Kothapally , & Caudell, 2003) x x x x
Nam(Estrin, Handley , Heidemann, McCanne, Xu, & Yu, 2000) x x x x x (Abdullah, Lee, Conti, & Copeland, 2005) x x x x
IDS RainStorm(Abdullah, Lee, Conti, Copeland, & Stasko, 2005) x x x x x
IDGraphs(Ren, Gao, Li, Chen, & Watson, 2005) x x x x
IP Matrix(Koike et al., 2005) x x x x
Visual Firewall(Lee, Trost, Gibbs, Beyah, & Copeland, 2005) x x x x
MieLog(Takada & Koike, 2002a) x x x x x
Island(Oline & Reiners, 2005) x
An examination of the table confirms that all of the components that we identify as
critical exist in ID visualization systems. It is also clear that no one system utilizes all of these
components (See Sidebar for further discussion). While ―overview,‖ ―primary notification,‖ and
―secondary throughput‖ components are well represented in most of these systems (91%, 56%,
and 73% respectively) none of the other components are represented in more than 50% of these
DISCUSSION
Our component-based structure provides a useful taxonomy of visualization components
for ID visualization systems and provides the visual mechanisms for the organization and
presentation of the analytics and operations recommended in the user-based and input-based
frameworks. The components which make up the component-based structure are a combination
of traditional IV components combined with urgency-based components which are unique to the
operational environment surrounding ID visualization systems.
Our analysis of IV-enabled ID systems suggest both positive and negative interpretations
of the current state of IV-enable ID systems. Many of the systems are aligned with traditional IV
theory, in that they provide the user with an overview of the data and subsequent
details-on-demand when needed. Unfortunately, most of the systems fail to effectively reflect IV theory in
most other respects. About half the systems do not provide proper zoom mechanisms for greater
data analysis, filtering capabilities, the ability to relate visual mechanisms on the screen, and the
capability for historical forensic analysis. Two-thirds of the systems do not allow extraction of
state data and the ones who did have this capability typically provided it only in some sort of
statistical analysis. Finally, and probably most disturbing, is that almost half the systems did not
provide primary notification of alerts to users. This is very discouraging as effective ID depends
on real-time alerts of potential attacks.
CONCLUSION
In this paper we have presented an organizing structure for designing ID visualization
visualization schemes, and then aligning these operational imperatives with a modified
component-based structure taken from IV theory. The component-based structure was
specifically developed using a combination of Shneiderman‘s (Shneiderman et al., 2005) IV
component delineation and Few‘s (Few, 2006) Information Dashboard role-based categorizations
(specifically, the operational category). The resulting structure combined common IV
components with urgency-based components, to best meet the requirements of ID systems.
Finally, a survey of 23 different ID visualization research projects was conducted to evaluate the
applicability of the above structuring system.
FUTURE WORK
This article provides several avenues for future research. First, the above delineation of a
component-based structural framework setup for IV has only been discussed here with regards to
ID visualization systems. The author‘s believe this same organizing approach can potentially be
applied to IV systems in other fields, but greater testing is needed. Additiona lly, our literature
review provides corroboration that past research in ID visualization systems have employed
some or all of the components described in the sub-framework, albeit not in a comprehensive
system. Greater research needs to be undertaken to actually develop a system that fully
embraces the advantages of the component-based system that we describe, and examine the
ACKNOWLEDGEMENTS
We would like to thank Dr. A.B. Schwarzkopf of the University of Oklahoma for his
constructive comments regarding the development of the component-based sub-framework. We
would also like to thank Dr. Kenneth Kozar and Dr. Gerald R. Wagner for their help with
background material. Also, thanks to Dr. Derrick Parkhurst who helped to initiate interest in this
REFERENCES
Abdullah, K., Lee, C., Conti, G., & Copeland, J. A. (2005). Visualizing network data for intrusion detection. In Proceedings from the Sixth Annual IEEE Systems, Man and Cybernetics (SMC) Information Assurance Workshop, 2005., pp. 100 - 108, Georgia Inst. of Technol., WA, 15-17 June 2005.
Abdullah, K., Lee, C., Conti, G., Copeland, J. A., & Stasko, J. (2005). IDS rainStorm: visualizing IDS alarms. In IEEE Workshop on Visualization for Computer Security, 2005. (VizSEC 05), pp. 1-10, Minneapolis, MN, Oct. 26, 2005.
Ball, R., Fink, G. A., & North, C. (2004). Home-centric visualization of network traffic for security administration. In Proceedings of the 2004 ACM workshop on Visualization and data mining for computer security, pp. 55 - 64, Washington DC. ACM Press. Cañas, A. J., Carff, R., Hill, G., Carvalho, M., Arguedas, M., Eskridge, T. C., et al. (2005).
Concept Maps: Integrating Knowledge and Information Visualization. In Lecture Notes in Computer Science (Vol. 3426, pp. 205-219): Springer Berlin / Heidelberg. Card, S. K., Mackinlay, J., & Shneiderman, B. (1999). Readings in Information
Visualization: Using Vision to Think: Morgan Kaufmann.
Chi, E. H. (2002). A Framework for Visualizing Information (Vol. 1). Dordrecht, Netherlands: Kluwer Academic Publishers.
Chittaro, L. (2001). Information visualization and its application to medicine. Artificial Intelligence in Medicine, 22(2).
Colombe, J. B., & Stephens, G. (2004). Statistical profiling and visualization for detection of malicious insider attacks on computer networks. In Proceedings of the 2004 ACM workshop on Visualization and data mining for computer security, pp. 138 - 142, 2004. ACM PressWashington DC.
Denning, D. E. (1986). An intrusion-detection model. IEEE Transactions on Software Engineering, 13, 222-232.
Erbacher, R. F. (2003). Intrusion behavior detection through visualization. In IEEE
International Conference on Systems, Man and Cybernetics, 2003., pp. 2507-2513, Albany Univ., NY, 5-8 Oct. 2003.
Estrin, D., Handley, M., Heidemann, J., McCanne, S., Xu, Y., & Yu, H. (2000). Network visualization with Nam, the VINT network animator. Computer, 33(11), 63 - 68. Fayyad, U., Grinstein, G. G., & Wierse, A. (2001). Information visualization in data mining
and knowledge discovery. San Francisco, CA: Morgan Kaufmann Publishers Inc. Few, S. (2006). Information Dashboard Design: The Effective Visual Communication of
Data. Sebastopol, CA: O'Reilly Media, Inc.
Fisk, M., Smith, S. A., Weber, P. M., Kothapally, S., & Caudell, T. P. (2003). Immersive Network Monitoring. In Passive and Active Measurement Workshop Proceedings, pp. 249-258, Apr. 2003.
Foresti, S., Agutter, J., Livnat, Y., Moon, S., & Erbacher, R. (2006). Visual Correlation of Network Alerts. IEEE Computer Graphics and Applications, 26(2), 48-59.
Goodall, J. R., Lutters, W. G., & Komlodi, A. (2004). The Work of Intrusion Detection: Rethinking the Role of Security Analysts. In Proceedings of the Tenth Americas Conference on Information Systems, pp. 1421-1427, New York, NY.
Goodall, J. R., Lutters, W. G., Rheingans, P., & Komlodi, A. (2005a). Preserving the big picture: visual network traffic analysis with TNV. In IEEE Workshop on
Visualization for Computer Security, 2005. (VizSEC 05), pp. 47-54, Minneapolis, MN, Oct. 26, 2005.
Goodall, J. R., Ozok, A. A., Lutters, W. G., Rheingans, P., & Komlodi, A. (2005b). A user-centered approach to visualizing network traffic for intrusion detection. In
Conference on Human Factors in Computing Systems, pp. 1403 - 1406, Portland, OR, 2005. ACM Press.
Hiraishi, H., & Mizoguchi, F. (2001). Design of a visual browser for network intrusion detection. In Tenth IEEE International Workshops on Enabling Technologies: Infrastructure for Collaborative Enterprises, 2001. WET ICE 2001. Proceedings., pp. 132-137, Chiba, Japan, 20-22 June 2001.
Kemmerer, R., & Vigna, G. (2002). Intrusion detection: a brief history and overview. Computer, 35(4), 27-30.
Koike, H., & Ohno, K. (2004). SnortView: visualization system of snort logs. In Proceedings of the 2004 ACM workshop on Visualization and data mining for computer security, pp. 143-147, Washington DC, 2004. ACM Press.
Koike, H., Ohno, K., & Koizumi, K. (2005). Visualizing cyber attacks using IP matrix. In IEEE Workshop on Visualization for Computer Security, 2005. (VizSEC 05), pp. 91-98, Minneapolis, MN, Oct. 26, 2005.
Komlodi, A., Goodall, J. R., & Lutters, W. G. (2004). An Information Visualization
Framework for Intrusion Detection. In Conference on Human Factors in Computing Systems, pp. 1743-1746, Vienna, Austria, 2004. ACM Press.
Komlodi, A., Rheingans, P., Ayachit, U., Goodall, J. R., & Joshi, A. (2005). A user-centered look at glyph-based security visualization. In IEEE Workshop on Visualization for Computer Security, 2005. (VizSEC 05), pp. 21 - 28, Minneapolis, MN, Oct. 26, 2005. Krasser, S., Conti, G., Grizzard, J., Gribschaw, J., & Owen, H. (2005). Real-time and
forensic network data analysis using animated and coordinated visualization. In Proceedings from the Sixth Annual IEEE Systems, Man and Cybernetics (SMC) Information Assurance Workshop, 2005, pp. 42 - 49, Atlanta, GA, 15-17 June 2005. Lakkaraju, K., Bearavolu, R., & Yurcik, W. (2003). Nvisionip – a traffic visualization tool
for security analysis of large and complex networks. In International Multiconference on Measurement, Modelling, and Evaluation of Computer-Communications Systems (Performance TOOLS), 2003.
Lakkaraju, K., Yurcik, W., Bearavolu, R., & Lee, A. J. (2004a). NVisionIP: an interactive network flow visualization tool for security. In 2004 IEEE International Conference on Systems, Man, and Cybernetics, pp. 2675 - 2680, Urbana, IL, 10-13 Oct. 2004. Lakkaraju, K., Yurcik, W., & Lee, A. J. (2004b). NVisionIP: netflow visualizations of
Lau, S. (2004). The Spinning Cube of Potential Doom. Communications of the ACM, 47(6), 25 - 26.
Lee, C. P., Trost, J., Gibbs, N., Beyah, R., & Copeland, J. A. (2005). Visual firewall: real-time network security monitor. In IEEE Workshop on Visualization for Computer Security, 2005. (VizSEC 05), pp. 129-136, Minneaplis, MN, Oct. 26, 2005. Livnat, Y., Agutter, J., Moon, S., Erbacher, R. F., & Foresti, S. (2005). A Visualization
Paradigm for Network Intrusion Detection. In Proceedings of the 2005 IEEE
Workshop on Information Assurance and Security, pp. 30-37, United States Military Academy, West Point, NY, 17-19 June 2005. IEEE.
McHugh, J., Christie, A., & Allen, J. (2000). Defending yourself: the role of intrusion detection systems. IEEE Software, 17(5), 42-51.
McPherson, J., Ma, K.-L., Krystosk, P., Bartoletti, T., & Christensen, M. (2004). PortVis: a tool for port-based detection of security events. In Proceedings of the 2004 ACM workshop on Visualization and data mining for computer security, pp. 73 - 81, Washington DC, 2004. ACM Press.
Mukherjee, B., Heberlein, L. T., & Levitt, K. N. (1994). Network intrusion detection. IEEE Network, 8(3), 26-41.
Nyarko, K., Capers, T., Scott, C., & Ladeji-Osias, K. (2002). Network intrusion visualization with NIVA, an intrusion detection visual analyzer with haptic integration. In 10th Symposium on Haptic Interfaces for Virtual Environment and Teleoperator Systems, 2002. HAPTICS 2002. Proceedings., pp. 277-284, Baltimore, MD, 24-25 March 2002.
Oline, A., & Reiners, D. (2005). Exploring three-dimensional visualization for intrusion detection. In IEEE Workshop on Visualization for Computer Security, 2005. (VizSEC 05), pp. 113 - 120, Minneapolis, MN, Oct. 26, 2005.
Papadopoulos, C., Kyriakakis, C., Sawchuk, A., & He, X. (2004). CyberSeer: 3D audio-visual immersion for network security and management. In Proceedings of the 2004 ACM workshop on Visualization and data mining for computer security, pp. 90 - 98, Washington DC, 2004. ACM Press.
Proctor, P. E. (2001). The practical intrusion detection handbook. Upper Saddle River, NJ: Prentice-Hall.
Ren, P., Gao, Y., Li, Z., Chen, Y., & Watson, B. (2005). IDGraphs: intrusion detection and analysis using histographs. In IEEE Workshop on Visualization for Computer Security, 2005. (VizSEC 05), pp. 39-46, Minneapolis, MN, Oct. 26, 2005. Shneiderman, B., & Plaisant, C. (2005). Designing the User Interface (4th ed.): Pearson
Education, Inc.
Snapp, S. R., Brentano, J., Dias, G. V., Goan, T. L., Heberlein, L. T., Ho, C.-L., et al. (1996). DIDS (distributed intrusion detection system) - motivation, architecture, and an early prototype. In Proceedings of the 19th National Information Systems Security
Conference, pp. 361-370, October 1996.
Takada, T., & Koike, H. (2002b). Tudumi: information visualization system for monitoring and auditing computer logs. In Sixth International Conference on Information Visualisation, 2002. Proceedings., pp. 570-576, Japan, 10-12 July 2002. Wright, W. (1997). Business visualization applications. IEEE Computer Graphics and
Applications, 17(4), 66-70.
Xin, J., Dickerson, J. E., & Dickerson, J. A. (2003). Fuzzy feature extraction and
visualization for intrusion detection. In The 12th IEEE International Conference on Fuzzy Systems, 2003. FUZZ '03., pp. 1249-1254, Ames, IA, 25-28 May 2003. Yin, X., Yurcik, W., Treaster, M., Li, Y., & Lakkaraju, K. (2004). VisFlowConnect: netflow
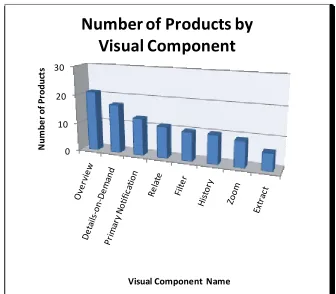
SIDEBAR
The component-based model contains eight categories that delineate specific visual
components and interaction mechanisms exemplified in the literature. These components are
further corroborated by their inclusion in at least one of all the reviewed products (with the
least included still existing in roughly one-third of the products). Sidebar Figure 1 shows a
count of products per category. It is tempting to interpret prioritization of categories is
Sidebar Figure 1, but is misleading. For example, while most products have an overview
feature, it may not be because that category is considered more important than the others but
because it may be the simplest to provide. Then again, it may be the most important feature.
A very interesting study would be to determine the relative importance of each category to
[image:40.612.146.482.400.694.2]those using these types of systems.
Figure 5: Sidebar 1 0
10 20 30
N
um
be
r
of
P
roduc
ts
Visual Component Name
Number of Products by
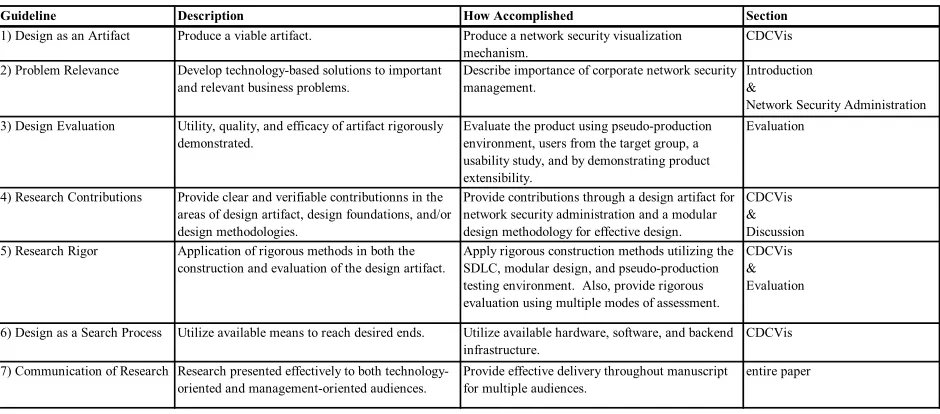
Sidebar Figure 2 provides a ranking of the products according to the number of
components each possesses. As is with the first graph, this is only an initial assessment of
the ―best‖ product, and future work should investigate better delineations of the ranking of
[image:41.612.149.482.213.506.2]the components in the model and thereby the products which contain these components.
Figure 6: Sidebar 2 0
1 2 3 4 5 6 7 8
N
um
be
r
com
po
ne
nt
s
Product Name
C
HAPTER
3:
CDCV
IS
:
A
C
ONFIGURABLE
V
ISUALIZATION
M
ECHANISM FOR
C
ORPORATE
N
ETWORK
S
ECURITY
A
DMINISTRATION
Modified from a paper currently being revised for submission.
Andy Luse2, Brian Mennecke, Nate Karstens, Doug Jacobson
ABSTRACT
Corporate network security administration is a never-ending balancing act for network
administrators straddling the line between information protection and availability. The
constant increase in informational needs, speed, and sharing coupled with the proliferation of
more advanced attacks, provides a daunting workload for most network security
administrators. The objective of this paper is to alleviate the task of network security
administration through the development of a novel, modular, plug-and-play, information
visualization system for network security. A design science research paradigm is utilized
whereby the visualization product is planned, designed, developed, deployed, and evaluated.
A pseudo-corporate environment and analogous target population are provided using cyber
defense competitions as a production test bed. These competitions provide fodder for system
enhancements as well as a user population for more formal tests of usefulness and usability
of the developed system.
2 I performed the primary portion of the manuscript preparation and also completed a good portion of the
KEYWORDS
network administration, computer and network security, information visualization, cyber
defense competition, design science
INTRODUCTION
Informational needs of organizations as well as their social nature require that
organizations process information (Mackenzie 1984). Also, due to information needs both
within the corporate structure as well as between partners, customers, and other external
entities, information must be shared (Daft et al. 1986) and this sharing forms the basis of all
organizational activity (Barrett et al. 1982). The above two requirements of information need
and information sharing along with shrinking time requirements require the use of modern
digital networks for exchanging this information.
Information Assurance involves all aspects of information, particularly focused on
insuring that information is where you want it, when you want it, in the condition you need it,
and readily available to those who should have access to it (Blyth et al. 2001). This has
typically been thought of with regards to the CIA model, specifically Confidentiality,
Integrity, and Availability (Denning 1999). Various types of information, both good and bad,
are flowing in, out, and through the corporate network. The challenge is to protect corporate
information from attackers, both internal and external, who wish to compromise this data.
Network security has increased in importance within the past decade as the need for
effective network security administration has become a critical factor in the overall health of
security violations to transmitted data (Stallings 2005). Many forms of corporate security
administration are necessary; for example, firms need to manage everything from host-based
security to securing the corporate Internet gateway (Kaeo 2003). Of great importance is the
detection of computer misuse to allow for responsive action, or intrusion detection (Denning
1987; Proctor 2001). Traditionally, researchers have looked for more effective methods for
intrusion detection (Lippmann et al. 2000; Northcutt 1999; Zhu et al. 2001) as even a 1%
false alarm rate can inundate administrators with unmanageable amounts of data (Durst et al.
1999).
Information Visualization has recently been explored as a means for reducing false
alarms with regards to intrusion detection and more broadly, network security (Luse et al.
2008). Information visualization research for intrusion detection attempts to utilize the
parallel processing power of the human vision system (Breitmeyer 1992) for analysis of
network events. Network administrators are able to utilize these information visualization
dashboards to allow for better decision-making with regards to potentially nefarious activity
on their network. While many different programs have been developed, very few
multi-module visualization systems for network security have been created where multiple
visualization components can be utilized for evaluation of network activity. Furthermore,
very little research has been conducted to test these systems, especially in production
scenarios by individuals planning a career in network security and administration.
Design science allows researchers to develop new artifacts to solve existing problems
(Hevner et al. 2004). Design science research has received a great deal of notice as a viable
research method (Hevner et al. 2004; March et al. 1995; Walls et al. 1992), but researchers in