1078
MS
AJNR Am J Neuroradiol 21:1078–1083, June/July 2000Diffusion Changes in the Aging Human Brain
Terry Chun, Christopher G. Filippi, Robert D. Zimmerman, and Aziz M. Ulug˘
BACKGROUND AND PURPOSE: Quantifying changes in the human brain that occur as part of normal aging may help in the diagnosis of diseases that affect the elderly and that cause structural changes in the brain. We sought to assess diffusion changes that are inherently related to brain structure during aging.
METHODS: MR scans were obtained from 11 healthy volunteers and 27 patients (ages 26 to 86 years [53.4 6 17.0 years]). Images acquired from the patients either showed no abnor-malities, contained minimal periventricular white matter changes, or revealed focal lesions. Maps of the average diffusion constant (Dav) were calculated for each subject. Changes in Dav were determined with distribution analysis (histogram) for the entire brain and compared with region-of-interest measurements from the periventricular white matter and thalamus.
RESULTS: Mean Dav of the entire brain (0.74 6 0.02 3 1025 cm2/s) showed weaker age
dependency compared with the periventricular white matter Dav(0.76 6 0.04 3 1025 cm2/s).
The Dav of the thalamus Dav (0.75 6 0.03 3 1025 cm2/s) had no age dependency. The
age-dependent changes of entire brain Dav may be significant for subjects older than 60 years compared with younger subjects.
CONCLUSION: In this study, we observed minimal changes in the Dav of the entire brain with aging. The mean Davof the human brain is nearly constant throughout most of adulthood.
Changes in brain structure are a normal aspect of aging and are well documented with MR studies (1–3). The most notable changes observed in the elderly include enlargement of CSF spaces, hyper-intense regions in the white matter and basal gan-glia, and widening of cortical sulci associated with brain atrophy (1, 2). Images obtained with standard MR protocols are effective for evaluating these gross anatomic changes, but few microstructural al-terations can be inferred with this method.
Recently, age-related brain changes have been assessed with MR diffusion imaging (4–6). This method is sensitive to incoherent water motion, which is dependent on the brain’s microstructure. In 1994, Gideon and colleagues (4) indicated a pos-itive correlation between the diffusion constant of white matter and aging. They speculated that these changes may be caused by age-dependent neuronal degeneration or by changes in myelination. Their study, however, required electrocardiographic trig-gering to avoid influences of pulsatile brain motion
Received August 20, 1999; accepted after revision January 24, 2000.
From the Weill Medical College of Cornell University— New York Presbyterian Hospital, Department of Radiology, 1300 York Avenue, New York, New York.
Address reprint requests to Aziz M. Ulug˘, PhD, Weill Med-ical College of Cornell University, Department of Radiology, Box 141, 1300 York Avenue, New York, NY 10021.
qAmerican Society of Neuroradiology
and was limited to diffusion measurements in one direction only. That same year, Nomura and col-leagues (5) reported diffusion constants that were fairly unchanged in adults. That study measured diffusion constants in two directions and focused mostly on the diffusion differences between pedi-atric and adult subjects. More recently, Nusbaum and colleagues (6) reported their preliminary data during a conference on diffusion changes in cere-bral white matter revealed by echo-planar fluid-at-tenuated inversion-recovery tensor imaging. They showed that histograms of the orientation-indepen-dent diffusion tensor trace can be used to assess whole-brain changes in diffusion.
The purpose of our study was to evaluate related changes in brain diffusion and provide age-specific normative values, which may serve as a baseline for future research.
Methods
FIG1. Whole-brain–diffusion-constant distribution map (diffusion histogram) from a healthy volunteer. The data (dots) are fitted with a
triple gaussian function to accommodate the two-compartment nature of the data and the mixing between two compartments (solid curve). The brain tissue compartment has a narrow distribution of values around its mean. The second and third compartments have broader distributions. The mean of the brain tissue pixel distribution (also mode of the entire distribution) is recognized as a mean diffusion constant for the entire brain (BDav). The distribution width (s) of the brain tissue compartment is also recorded.
FIG2. BDavhistograms from an 86-year-old subject with age-appropriate atrophy. The thicker curve is the Davhistogram from three
slices through the lateral ventricles. The tissue peak (around 0.75310–5cm2/s) and the CSF peak (around 3.2310–5cm2/s) are well
separated. The thinner curve is the whole-brain Davhistogram. The location of the tissue peaks in both histograms did not change,
demonstrating that the tissue peak is truly free of CSF contamination. The histograms are scaled so that the tissue peaks are the same height.
53.4 years and standard deviation of 17.0 years. This group included 20 male and 18 female subjects.
MR scans were acquired for all subjects on a 1.5-T scanner. Axial diffusion images (10 000/100 [TR/TE]; FOV, 22 cm; 30 interleaved slices of 5-mm thickness; image matrix, 128 3 128) were obtained with an echo-planar multislice sequence. Diffusion was measured in three directions (x, y, z), with a b-value of 100 000 s/cm2 for each direction. In addition, an
image without diffusion gradients was acquired. Using diffu-sion-weighted images in three orthogonal directions, an ori-entation-independent diffusion-weighted image (DWItrace), which is related to the trace of the diffusion tensor, is obtained on the scanner as follows:DWItrace5 Ï3DWIxDWIyDWIz. This trace-weighted image and the image without diffusion weighting (So) is transferred to a computer workstation. A C
program employing the equation (DWItrace5Soexp(2bDav) is used to calculate the orientation-independent average diffu-sion maps (Dav5Trace/3) on a pixel-by-pixel basis.
Another custom C program was then used to calculate the diffusion distribution maps (histograms) from the entire brain (BDav) (Fig 1). The program distributed the pixels to 250 bins
with bin widths of 0.0231025cm2/s. This distribution map
(histogram) was fitted to a triple gaussian curve using com-mercial software (KaleidaGraph, Adelbeck Software, Reading, PA). This curve
2 2
2[(Dav2BD )/av s] 2[(Dav2D )/2 s2]
(C e1 1C e2
2
2[(Dav2D )/3 s3]
1C e3 )
represents a two-compartment model with mixing (three com-partments): 1) the brain tissue compartment, 2) brain tissue mixed with CSF, and 3) the high-diffusion compartment con-sisting of CSF and non-brain tissue, such as the eyeballs. Peak locations and peak widths were determined from the fitted
data. The peak location of the tissue compartment (mode of the entire distribution and the median of the tissue pixels) was interpreted to be BDav. We also measured the tissue-compart-ment Davdistribution width,s. Because the diffusion constant
of CSF is more than four times higher than that of the brain tissue, the tissue pixels contaminated with more than 10% CSF would be included in the broad mixing compartment. Hence, the measured BDav and scharacterize the brain tissue pixels
that are not contaminated with CSF (Fig 2).
We also measured the Davvalues of the periventricular white
matter and thalamus by using region-of-interest (ROI) analysis. We used a custom program (IMAX2, courtesy of Dr. Peter Barker, Johns Hopkins University). This program allows place-ment of ROIs on Davmaps and calculates the mean value for
each ROI. Periventricular white matter measurements included 16 to 38 ROIs placed over three slices for 36 subjects and over two slices for two subjects. Thalamic measurements included two ROIs placed on a single slice.
To compare the Davmeasurements between different patient age groups, we used a two-tailed Student’s t-test. Pearson cor-relation coefficients were calculated with commercial software (KaleidaGraph). The significance level was set at P,.05.
Results
Our study population consisted of 38 subjects with an age range of 26 to 86 years and a mean age of 53.4617.0 years. For all subjects, our dis-tribution analysis showed the mean BDavto be 0.74 31025cm2/s, with a standard deviation of 0.023 1025 cm2/s. The ROI measurements showed that the periventricular white matter Dav was 0.76 6 0.043 1025cm2/s and the thalamus D
AJNR: 21, June/July 2000 1080 CHUN
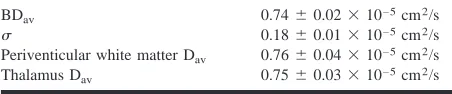
TABLE 1: Average diffusion measurements for the study popu-lation (n538) (age range 26–86 years, mean 53.4617.0 years)
BDav s
Periventicular white matter Dav
Thalamus Dav
0.7460.0231025cm2/s
0.1860.0131025cm2/s
0.7660.0431025cm2/s
0.7560.0331025cm2/s
Note.—Values reported as mean6standard deviation. BDavis the
mean average diffusion constant for the brain;sis distribution width of brain tissue average diffusion constant.
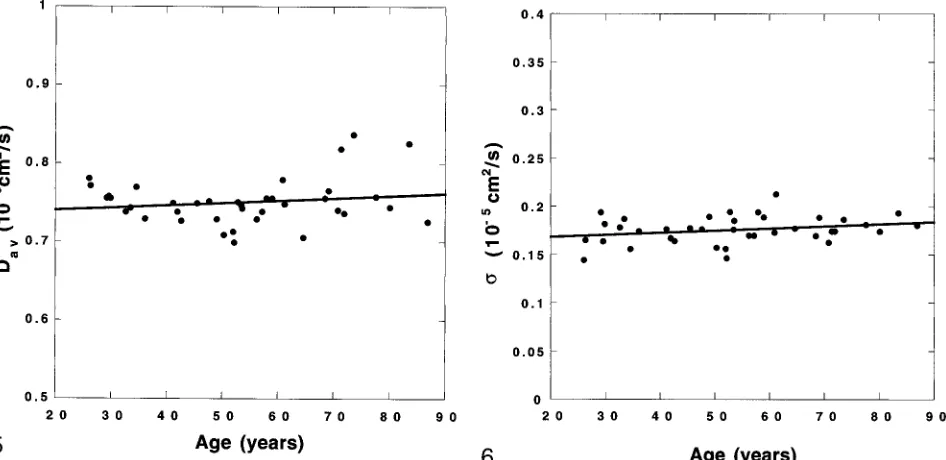
FIG3. The brain diffusion constants (circles) measured from distribution maps are plotted against age of the subjects. A linear fit to the data (solid line) is also shown (BDav50.71710.0004213Age, r50.383,P,.05). Age dependency of the data is minimal.
FIG4. The diffusion constants determined from ROI measurements of the periventricular white matter (circles) are plotted against age of the subjects. There is a significant increase with respect to age. A linear fit to the data (solid line) is also shown (Dav50.7181
0.0008763Age, r50.406,P,.015).
60.0331025cm2/s (Table 1). These findings are in excellent agreement with previously reported values (4, 7–11).
On inspection (Fig 3), BDavincreases gradually with age (r50.383, P,.05), but this age depen-dency is minimal (4.2131029 cm2/s per year). In contrast, the periventricular white matter Dav (Fig 4) measurements, which were obtained by ROI placement, were more significantly correlated with age (r 50.406, P,.05), with an age-dependency factor of 8.76 3 1029 cm2/s per year. No correla-tion was seen between thalamic Dav and age (Fig 5) (r 50.174, P. .29), which was also measured by ROI placement.
When evaluating BDav changes, we observed a statistically significant difference (P , .05) when we compared subjects 60 years or older with sub-jects younger than this (Table 2). For the subsub-jects in the age range of 60 to 86 years, the BDav was 0.7560.0131025cm2/s, whereas for the younger population, this value was 0.74 6 0.02 3 1025 cm2/s. Similarly, the D
av for periventricular white matter was also significantly different between
these two groups. This value was calculated to be 0.7860.0431025cm2/s for the older population and 0.76 6 0.03 3 1025 cm2/s for the younger group. There was no significant difference in mea-surement of the thalamus between these two age groups.
When we divided the study population into three equal groups (ages 26–45 years, n513; 46–59 years, n512; and 601years, n513), we observed a highly significant difference only in the periven-tricular white matter Dav(P , .009) and BDav (P , .003) of the youngest and oldest groups (Table 3).
There were no statistically significant changes with age for the Dav distribution width, s (Fig 6) (r50.273, P..1). For the entire adult population, the Dav distribution width, s, was measured to be 0.18 60.01 31025 cm2/s.
Discussion
FIG5. The diffusion constants measured from the thalamus (circles) by using ROIs are plotted against age of the subjects. Data do
not show age dependency. A linear fit to data (solid line) is also shown (Dav50.73410.0003013Age, r50.174,P..29).
[image:4.612.65.538.60.290.2]FIG6. The distribution width (s) of the brain diffusion constants measured from distribution maps (circles) are plotted against age of the subjects. Data do not show age dependency. A linear fit to the data (solid line) is also shown (s 50.16310.0002273Age, r5 0.274,P..10).
TABLE 2: Average diffusion measurements between subjects 601years and subjects younger than 60 years
Age Group ,60 Years 601Years Significance
Mean age
BDav
Periventricular white matter Dav
Thalamus Dav
43.6610.9 years n525
0.7460.0231025cm2/s
0.7660.0331025cm2/s
0.7460.0231025cm2/s
72.368.0 years n513
0.7560.0131025cm2/s
0.7860.0431025cm2/s
0.7660.0431025cm2/s
P,.05
P,.05 Not significant
Note.—Values reported as mean6standard deviation.
TABLE 3: Average diffusion measurements of three age groups
Age Group 26–45 Years 46–59 Years 601Years
Mean age
BDav
Periventricular white matter Dav
Thalamus Dav
34.166.5 years n513
0.7360.0131025cm2/s
0.7560.0231025cm2/s
0.7560.0231025cm2/s
53.463.6 years n512
0.7460.0331025cm2/s
0.7660.0431025 cm2/s
0.7460.0231025cm2/s
72.368.0 years n513
0.7560.0131025cm2/s
0.7860.0431025cm2/s
0.7660.0431025cm2/s
Note.—Values reported as mean6standard deviation.
of the normal and pathologic states of the brain. Diffusion-weighted sequences are sensitive to mi-croscopic movement of water molecules; therefore, alterations in degree of diffusion reflect alteration in the microscopic environment of these water mol-ecules. It is, therefore, reasonable to infer that changes in diffusion reflect changes at the scale of cellular and extracellular structures of the brain.
In this study, we assessed the diffusion charac-teristics of the entire brain as a function of age by
using data obtained from a routine diffusion-weighted sequence widely used in clinical practice. This knowledge is important for two reasons:
[image:4.612.57.541.391.462.2]AJNR: 21, June/July 2000 1082 CHUN
2 years of age, diffusion is increased com-pared with older children and adults. This dif-ference has been ascribed to the lack of or incomplete myelination, with consequent in-creased water motion relative to the more re-strictive environment seen in fully mature, myelinated brain. Prior published studies have also suggested that diffusion increases in the elderly (4). These early investigations were limited by technical factors. They were performed using diffusion-sensitizing gradi-ents in only one or two directions; thus, white matter diffusion anisotropy effects could not be eliminated or evaluated independently. In addition, the entire brain was not imaged. ii. The knowledge of age-dependent normal
dif-fusion values is critical in the assessment of diffuse processes such as hypertensive en-cephalopathy (due to vasogenic edema) and obstructive hydrocephalus (due to interstitial edema) (12, 13). Changes in diffusion have been assessed by obtaining multiple ROI mea-surements from locations in the brain. This technique is limited for several reasons. The choice of location, number, and size of ROIs is operator dependent. This may lead to site-selection bias and may limit the reproducibil-ity of results. ROIs may include heteroge-neous tissues (eg, white matter and CSF) and measurements of diffusion may fail to reveal changes occurring in the brain tissue.
The use of distribution analysis of average dif-fusion constant (Davhistograms) provides an effec-tive method for measuring mean diffusion for the entire brain. The three-dimensional diffusion infor-mation of a subject’s brain can be reduced to a single number (mean brain diffusion constant: BDav) by using appropriate modeling. This physi-cal parameter can be used for intersubject compar-ison. Furthermore, because this is an automated process, no operator bias can interfere with the de-termination of BDav. ROI measurements, on the other hand, depend on correct identification of the measured structure by the operator. Also, because signal-to-noise ratio in a given measurement is pro-portional to the square root of the number of pixels measured, the determination of BDavis much more precise than a given ROI measurement. The distri-bution analysis uses all pixels, whereas ROI mea-surement uses only the pixels of interest. The stan-dard deviations of measurements in Table 1 confirm this fact. The standard deviation of BDav measure-ments is the lowest when compared with the stan-dard deviations of the thalamus and the periven-tricular white matter Dav measurements.
The use of distribution analysis has other advan-tages. Distributing pixels according to signal inten-sity theoretically should remove the contaminating effects of blood vessel flow and small CSF spaces (lacunes and Virchow-Robin spaces). On Davmaps, these phenomena appear as foci of high diffusion.
These regions may be unintentionally included in ROI measurements, causing abnormal elevation of Dav values. Histograms distribute the pixels of these high-diffusion areas to the right and remove their contribution to brain tissue Davmeasurements. Our analysis showed that Davin brain tissue has a gaussian distribution. This is expected for the brain, which has a relatively homogeneous distri-bution of tissue water. Furthermore, the Dav distri-bution width was not correlated with age (Fig 5), indicating that the brain water distribution does not change considerably during normal aging.
In this study, BDavwas found to be nearly con-stant. The BDav measurements obtained from dif-ferent healthy subjects of difdif-ferent ages were very close to each other. All the BDav data measured were narrowly distributed between 0.70 and 0.78 1025 cm2/s. Significant changes with age were found only when the data of subjects older than age 60 years were compared with those of younger subjects.
The diffusion of water molecules in the human brain is restricted by the tissue microstructure. An increase in diffusion may be caused by either de-creased restriction or inde-creased water content. Ev-idence of changes in brain tissue microstructure during aging may come from a study done by Hut-tenlocher (14), who measured synaptic density in the human frontal cortex. Using a tissue-fixative method that revealed synaptic profiles, he showed that synaptic density was constant throughout most of adulthood (ages 16–72 years). There was, how-ever, a small decline in synaptic density for the aged (ages 74–90 years). A decrease in synaptic density can reduce the restriction of water mole-cules and, hence, cause increased diffusion. None-theless, a homogeneous increase of brain tissue wa-ter with aging can also have the same effect.
Because the subarachnoid space enlarges in the ag-ing atrophic brain, the Virchow-Robin spaces may enlarge as well. Enlargement of these perivascular spaces in white matter can lead to increased free water diffusion and to increased white matter Dav measurements when ROIs are used.
Alternatively, increase in diffusion constant of white matter can be explained by increased water content caused by thinning blood vessels. In 1987, Stewart and colleagues (21) reported capillary changes in the blood-brain barrier in the aging hu-man brain. In their study of biopsy specimens, they observed that white matter capillary walls become thinner as one ages. This thinning is caused by loss of pericytes and shrinkage of the endothelial cy-toplasm. Loss of pericytes implies that the blood-brain barrier of the elderly is less efficient in pre-venting transient leaks. This may further increase white matter Dav measurements. If, however, this were the cause of the increase in ROI measure-ments of white matter diffusion constant, we would expect that the s of the brain tissue should also change with age. We did not observe any statistical changes ofsduring aging in this sample size, sug-gesting the water distribution of the brain tissue does not change during most of the adulthood.
We have provided a database of age-specific dif-fusion values of the periventricular white matter, thalamus, and the entire brain that can be used as normative values. We have shown in this study that distribution analysis can be used to assess whole-brain diffusion accurately. The contaminating ef-fects from blood vessels and small fluid spaces are essentially eliminated, allowing for true measure-ments of the tissue diffusion constant. Further de-velopment in this methodology will likely increase its use for evaluating a number of brain diseases.
Conclusion
We have used data obtained from a routine clin-ical diffusion-weighted sequence to assess total brain diffusion. Distribution analysis and modeling were used to determine mean diffusion constant for the entire brain. The mean diffusion constant of the human brain is nearly constant throughout most of adulthood. Mild increase in the BDav with age might be significant for individuals 60 years or old-er compared with youngold-er subjects. Measurements from the periventricular white matter and thalamus obtained using ROIs showed an age-dependent in-crease in Dav of the periventricular white matter, but no changes in the thalamus.
Acknowledgments
We would like to thank Dr. Peter Barker of Johns Hopkins University for providing the IMAX2 data display and process-ing program that we used in ROI measurements. We would
also like to thank the MR technologists (Richard Fischer, Sean Skolkin, John Crespo, John McCormick, Chul Gil Lee, Keith Clay, Thomas Farrell) at New York Presbyterian Hospital for their help with data transfers.
References
1. Drayer BP. Imaging of the aging brain. Part I. Normal findings.
Radiology 1988;166:785–796
2. Jernigan TL, Press GA, Hesselink JR. Methods for measuring
brain morphologic features on magnetic resonance images. Validation and normal aging. Arch Neurol. 1990;47:27–32
3. Pfefferbaum A, Mathalon DH, Sullivan EV, Rawles JM, Zipursky RB, Lim KO. A quantitative magnetic resonance imaging study
of changes in brain morphology from infancy to late adult-hood. Arch Neurol. 1994;51:874–887
4. Gideon P, Thomsen C, Henriksen O. Increased self-diffusion of
brain water in normal aging. JMRI 1994;4:185–188
5. Nomura Y, Sakuma H, Takeda K, Tagami T, Okuda Y, Nakagawa T. Diffusional anisotropy of the human brain assessed with
diffusion-weighted MR: relation with normal brain develop-ment and aging. AJNR Am J Neuroradiol 1994;15:231–238
6. Nusbaum AO, Tang CY, Buchsbaum MS, Wei TC, Atlas SW.
Global changes in cerebral white matter diffusion in normal aging. Proc Intl Soc Magn Reson Med 1999;7:637
7. Ulug˘ AM, van Zijl PCM. Orientation-independent diffusion
im-aging without tensor diagonalization: anisotropy definitions based on physical attributes of the diffusion ellipsoid. J Magn
Reson Imaging 1999;9:804–813
8. Chun T, Ulug˘ AM, van Zijl PCM. Single-shot diffusion-weighted
trace imaging on a clinical scanner. MRM 1998;40:622–628
9. Pierpaoli C, Jezzard P, Basser PJ, Barnett A, Di Chiro G.
Diffu-sion tensor MR imaging of the human brain. Radiology 1996;
201:637–648
10. Hirsch JG, Bock M, Essig M, Schad LR. Comparison of
diffu-sion anisotropy measurements in combination with the flair-technique. Magn Reson Imaging 1999;17:705–716
11. Hajnal JV, Doran M, Hall AS, et al. MR imaging of
anisotrop-ically restricted diffusion of water in the nervous system: tech-nical, anatomic and pathologic considerations. J Comput Assist
Tomogr 1991;15:1–18
12. Gideon P, Thomsen C, Gjerris F, Sorensen PS, Henriksen O.
In-creased self-diffusion of brain water in hydrocephalus mea-sured by MR imaging. Acta Radiologica 1994;35:514–519
13. Ulug˘ AM, Filippi CG, Souweidane M, Zimmerman RD. Use of
diffusion imaging for assessing the treatment of obstructive hydrocephalus. Proc Int Soc Magn Reson Med 1999;7:1809
14. Huttenlocher PR. Synaptic density in human frontal cortex—
developmental changes and effects of aging. Brain Research
1979;163:195–205
15. Miller AKH, Alston RL, Corsellis JAN. Variation with age in
the volumes of grey and white matter in the cerebral hemi-spheres of man: measurements with an image analyser.
Neu-ropathol Appl Neurobiol 1980;6:119–132
16. Awad IA, Spetzler RF, Hodak JA, et al. Incidental subcortical
lesions identified on magnetic resonance imaging in the elderly. I. Correlation with age and cerebrovascular risk factors.
Stroke 1986;17:1084–1089
17. Awad IA, Johnson PC, Spetzler RF, et al. Incidental subcortical
lesions identified on magnetic resonance imaging in the elderly. II. Postmortem pathological correlations. Stroke 1986;17:1090–
1097
18. Marshall VG, Bradley WG Jr., Marshall CE, Bhoopat T, Rhodes RH. Deep white matter infarction: correlation of MR imaging
and histopathologic findings. Radiology 1988;167:517–522
19. Brant-Zawadzki M, Fein G, Van Dyke C, Kiernan R, Davenport L, de Groot J. MR imaging of the aging brain: patchy
white-matter lesions and dementia. AJNR Am J Neuroradiol 1985;6:
675–682
20. Heier LA, Bauer CJ, Schwartz L, Zimmerman RD, Morgello S, Deck MDF. Large virchow-robin spaces: MR-clinical
correla-tion. AJNR Am J Neuroradiol 1989;10:929–936
21. Stewart PA, Magliocco M, Hayakawa K, et al. A quantitative