MASTER’S
THESIS
“HOW TO INCREASE THE EFFECTIVENESS OF E-MAIL COMMUNICATION WITHIN
ORGANIZATIONS”Company: Mansystems Nederland B.V. Robert Sauer
Student number: 0185671
Business Administration, Information Management Defense: December 13th, 2010, 15.45 Spiegel 7 1th committee member: Dr. C. Amrit
I
A
BSTRACT
III
P
REFACE
This research was initiated by Mansystems BV in Barneveld. This company builds and maintains software that supports service management processes for middle-size and large organizations e.g. KPN, Ziggo, Rijkswaterstraat. The solutions of Mansystems are built on Remedy ARS of BMC Software. The architecture of their solutions is completely according to the ITIL service management processes. The core essence of this software is to cope with requests that are initiated inside and outside organizations.
This underpins the logical relation between this research and the company’s core business. Even in highly automated organizations, there is always communication between employees that flows outside pre-described information routes that are embedded into the architecture of service management tools. Mansystems does of course not believe that this out of pre-described workflows should be eliminated, but believes a software tool could facilitate these information flows more effective in a way the freedom stays with the employees. This has already been made possible with the introduction of e-mail. But what if e-mail lacks elements that can be reduced by an alternative software solution? If e-mail lacks elements, which this research should discover, it can provide groundings for a profitable new business since e-mail is one of the major asynchronous communication methods in a lot of organizations.
For me it was quite an assignment to startup this research because, although there is a lot of research been done in the sense of e-mail communication in organizations, there are not many methods of testing this in a this case. Furthermore, before testing it, how can I conceptualize e-mail communication in a way that the lack of effectiveness could be measured? It took a lot of time before I could decide that the best way of measuring this conceptual model was to build an automated quantitative research that gave e-mail users the opportunity to analyze their own e-mail behavior by answering multiple questions about every single e-mail message they receive of their colleagues out of a specific time-span. This was, according to all the literature I found, never been done using a specially programmed research-tool. One research, that came as closest to this one, used a time-consuming inbox walkthrough in which the researcher and the subject manually inspected the user’s e-mail behavior. This automated way provided lots of data in a short amount of time, and more important, the repeatability of this research makes possible to test the effectiveness a possible future solution (whether it is a software solution or a change in the organization’s policy). The research has provided indeed a lot of data but, good for Mansystems, did not show severe lack of effectiveness of e-mail communication in this case. Proceeding interview data further explored this subject and explained the quantitative data in order to increase the completeness of the conclusion.
IV Of course this research was not possible without the assigner Hans van Donge MSc MBA. Hans provided a lot of possible directions where e-mail may lack effectiveness. This knowledge jump-started this research in a way that conceptualizing e-mail and finding literature was easier. I used his thoughts about who is responsible for responding on requests that are sent by e-mail for the interviews that preceded the automated quantitative research. These interviews proofed these thoughts that the lack of feeling of responsibility for responding on a received request seriously varied based on several causes.
V
I
NTRODUCTION
In this master thesis a literature review and an empirical research is conducted in order to further conceptualize the phenomenon.
The problem is allocated in the field of responsiveness behavior of units in an organization towards e-mail communication. These units are not aware whether they are responsible for ongoing communication processes or not. The problem is that there are shortcomings associated with the transparency in responsibilities for communication through e-mail. E-mail is one of the latest communication methods; it is easy to use, low-cost, quick, and can contain all kinds of attachments, which can easily be sent to multiple recipients. An organizational design describes the organizational structure, processes and information flows, but lacks flexibility to fit in the cognitive complexity of the units inside the organization. E-mail provides opportunities for exploring informal networks and information-flow content.
This thesis will explore the problem using existing literature and a research. A research design will be explained of an automated research method of e-mail communication. This research is executed and the subsequent quantitative data will be extended with qualitative interview data.
VII
C
ONTENTS
Abstract ... I Preface ... III Introduction ... V
1 Problem description ... 1
1.1 Problem content ... 1
1.2 Approach to solve ... 1
2 Conceptual Model ... 2
2.1 Content and handling of information flows ... 3
2.2 Information flow intensity ... 4
2.3 Information channels ... 5
2.4 E-mail client ... 7
2.4.1 Current archiving usage of the client ... 7
2.4.2 Attempt to improvement 1: Belotti, Ducheneaut, Howard, & Smith in 2003 ... 8
2.4.3 Attempt to improvement 2: Scerri, Davis, Handschuh, and Hauswirth 2009 ... 9
2.5 Conceptualization ... 10
2.5.1 Content of information flows ... 10
2.5.2 Routes of information flows ... 11
2.5.3 Responsibility ... 11
2.5.4 Reaction on incoming requests ... 11
2.5.5 The amount of information flows ... 12
2.5.6 Remaining research ... 12
3 Research Method ... 13
3.1 Units ... 13
3.2 Treatment ... 14
3.2.1 Software design ... 15
3.2.2 Qualitative interviews ... 23
VIII
4 Results ... 27
4.1 Content and handling of information flows ... 27
4.2 E-mail intensity... 30
4.3 Network ... 31
4.4 E-mail client ... 32
4.5 Case studies ... 32
4.5.1 Interview 1 – ID 98 ... 33
4.5.2 Interview 2 – ID 148 ... 36
4.5.3 Interview – ID 171 ... 38
5 Conclusion ... 41
5.1 The existence of the phenomenon ... 41
5.2 Reducing or preventing the phenomenon ... 44
6 Discussion ... 47
7 Index ... 48
7.1 Figures ... 48
7.2 Tables ... 48
7.3 Graphs ... 48
8 References ... 49
8.1 Index ... 49
8.2 Concept Matrix ... 50
9 Appendix ... 51
9.1 All results from the e-mail survey ... 52
9.2 Recurring process for the e-mail survey ... 53
9.3 Architectural design Database for the research tool ... 54
9.4 Transcripts interviews ... 55
9.4.1 Interview 1 ... 59
9.4.2 Interview 2 ... 60
9.4.3 Interview 3 ... 63
1
1
P
ROBLEM DESCRIPTION
1.1
P
ROBLEM CONTENTThe main objective of this research is to find a way:
“How to increase the effectiveness of e-mail communication within organizations” The problem is that:
“There are shortcomings associated with the transparency in responsibilities for communication through e-mail”
Everybody in an organization using e-mail is a problem owner. The shortcomings in the transparency of responsibility can occur when someone in the organization receives an e-mail in which a request is enclosed. Because lack of awareness of responsibility the receiver’s action upon the request might be late, insufficient, or absent. There are situations in which this lack of action in response upon a request can cause severe problems for the continuity of organizational processes.
Nevertheless, does this phenomenon really exist? If so, what are the consequences? Does it happen everywhere, or just in some organizations or some professions? The new research question then is:
“How to measure the existence of phenomenon in a specific setting and how to find out why it exists”
1.2
A
PPROACH TO SOLVETo decrease this phenomenon, the way people in an organization use e-mail have to be changed. There are multiple ways of changing this of course; e.g., you can create a pre-described process to describe how people have to act upon requests that are sent by mail, or you can build software that can improve or replace e-mail clients, in which you can delegate responsibilities. The first question therefore is:
“What would be the most effective way of decreasing the phenomenon?”
Before finding a solution the problem need to be further explored using existing literature and own research. The literature will help to build a conceptual model that underpins the following research. After the research the following question will be answered:
2
2
C
ONCEPTUAL
M
ODEL
The conceptual model is the first stage of the exploration of the phenomena of e-mail communication. This conceptual model will be based on the preliminary described problem description followed by the literature review.
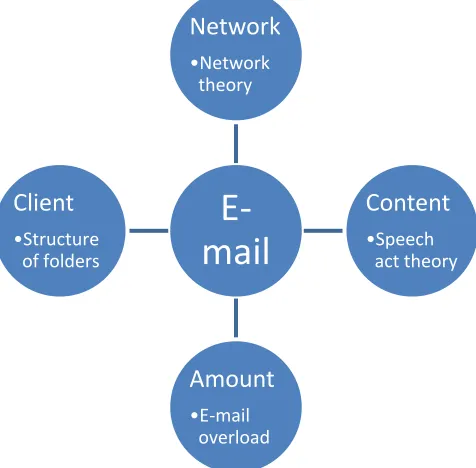
[image:12.612.188.426.351.585.2]The digitalization of communication is globally taking place in a massive way; therefore, a lot of literature is available. The literature review should answer the initial questions for a great part, more specified questions should arise which could be answered by the then following research. To maintain overall transparency this review is split up into multiple parts. The first part is about the content and handling of information flows, these paragraphs explain how the communication flows fit into daily operations. The information intensity describes how the number of information flows, or its size, can influence other factors. The next paragraphs explain how these information flows fit in organizations, who is communicating to whom, how these information routes can be explained, and how current software is supporting e-mail communication (e-mail client). The theories are summarized in a concept map. The elementary base of the conceptual model will cover four elements of e-mail communication.
FIGURE 1 CONCEPTUALIZATION OF E-MAIL
Two attempts to improve e-mail communication are explained. At last, the extent to which the theories answer the research questions is explained.
Network
•Network theory
Content
•Speech act theory
Amount
•E-mail overload
Client
3
2.1
C
ONTENT AND HANDLING OF INFORMATION FLOWSRequests that are sent by e-mail are probably unplanned; they are probably not integrated in a pre-designed workflow. A paper from 1997 defines a better description of these unplanned communications. That paper introduced ad-hoc workflows in order to add flexibility to traditional workflows; these ad-hoc workflows are not described but designed by the initiator of a process that is needed in for the continuity of the pre-described traditional workflow(Voorhoeve and van der Aalst 1997). Therefore, the process of an unplanned information flow is better defined as an ad-hoc workflow. These ad-hoc workflows can be executed more structured; the paper of Voorhoeve and van der Aalst suggested that an ad-hoc workflow is based on process templates. Using their method the probability of leaving an ad-hoc workflow unfinished is reduced. An e-mail is always an ad-hoc workflow. These less structured processes are supported by groupware, an e-mail client can be categorized as groupware. The task and its priority order are not fixed; this flexibility makes it hard to support and control the ongoing work (Voorhoeve and van der Aalst 1997).
Like mentioned before, this research is limited to e-mail communication supporting ad-hoc workflow information flows. An e-mail that initiate a ad-hoc workflow contains a “speech act”, the speech act theory is published by J. L. Austin in 1962; this theory is based on the question: how to do things with words. A speech act can be information, a question, a request, a warning, a promise, or a challenge. Based on this knowledge it should be possible to design a process for every type of speech act. One article suggests that a special designed e-mail system can autonomously find out what the e-mail contains so the system can initiate a specific workflow(Scerri, Handschuh et al. 2008); this will be discussed later.
In an ideal world a “speech act”, like a sent e-mail, is followed by an immediate response action; of course this is not always the case. The lack of response, e.g. late response, no response, or a bad quality response, is the main issue of the obscurities associated with e-mail communication. Another problem of e-mail is the use of e-mail for purposes where it’s not designed for, this is called “E-mail overload”(Whittaker and Sidner 1996); this paper describes situation in which e-mail users are using their mailboxes for i.e. task management or personal archiving. This is a problem because the inbox can lose its overview, which may be a cause for the previous mentioned lack of response. In the study (Whittaker and Sidner 1996) there are three major distinguished e-mail functions:
• task management,
• personal archiving,
• asynchronous communication.
4 According to the qualitative research of(Whittaker and Sidner 1996), they found several reasons why some mails were not answered immediately. Some messages were described as “to-dos”; these messages require the receiver to perform action and the message remain in their inbox as reminder. In some cases, users received “to-reads”, these mails contain a large amount of text which is mostly not read on the moment a user received that mail. Another possibility is that a message has an indeterminate status; in that case, the receiver cannot see whether an e-mail has high priority or not in one instance. These mails were often filed for later reconsideration. At last, the mailbox is sometimes used for ongoing, but incomplete, asynchronous conversations; when one person is asked a complex question, he probably is not able to answer immediate; in this case, the whole conversation is jammed because everyone is waiting for that single answer.
A study about embedded personal information management(Ducheneaut and Bellotti 2001) the authors argued the difficulties emerged with the increasing usage of e-mail. They consider e-mail as becoming more like a habitat than an application. They investigated the unanticipated use of e-mail and proposed a potential design idea to solve that problem. A preliminary research among 60 individuals showed that many people use e-mail throughout the day, that it is the major non-face-to-face communication method, that it is also used for purposes e-mail was not designed for, and that e-mail is overloaded. Knowing this, they designed a research among 28 individuals over three different companies. The sample was receiving a minimal of three to a maximum of 100 e-mails per day with a mean of 42. 72 Persons sends themselves mails as reminder and 83 percent leaves messages in their inboxes as reminder. This paper was published in 2001; the sample might not represent the current situation due to further developments in personal information management tools (PIMs).
Communication through e-mail doesn’t only occur using the text field; employees in an organization sometimes communicate through attached files like spreadsheets. In the research of Ducheneaut and Belotti, they found that the words: e-mail and file transfer protocol were misused interchangeably. Ducheneaut and Belotti found that there is a strong correlation between the role of an employee and a combination of the use of e-mail to distribute agendas and the documentation of their activity. The authors leave one question unanswered: Would it be possible to design an e-mail client where the interface and functionality can vary based on the role of the user?
Other explorative research have showed that e-mail users have a responsiveness image of the one they communicate with; this causes e-mail users to choose a person to ask something based on his previous responsiveness behavior (Tyler and Tang 2003).
2.2
I
NFORMATION FLOW INTENSITY5 that much e-mail that it’s out of control. The last mentioned definition of e-mail overload will be maintained in this thesis since PIMs are developed and used better nowadays. The article of Dabbish & Kraut is useful; they investigate the relation between the e-mail use and the e-mail overload and its moderator. When there is a moderator which could decrease the effect of e-mail overload, this moderator could be part of the solution of the problem proposed by Mansystems. The extent in which someone receives e-mail depends on many factors. Dabbish & Kraut used in their research the interdependence, autonomy and task variety as influence on the volume of sending and receiving e-mail. The proposed moderators on the relation between the volume of sending and receiving e-mail and the feelings of e-mail overload are called e-mail management tactics, these tactics are: 1. Check e-mail after an acoustic or optic signal, 2. Restrict yourself to check e-mail on specific times, 3. Try to keep the inbox small, 4. Keep messages as reminder for tasks, 5. Leave read messages in the inbox, 6. Delete work-related messages after reading them, 7. Manually file messages as soon they come in, 8. File messages in separate folders. In their research, they selected a sample all across the United States of 484 individuals. 26% of the sample was in managerial occupation. The average amount of e-mail they receive was 42 messages every day; they read only 32 of them and sent 21 messages per day. The average of items in their inboxes was 311 messages, only 10% kept more than 600 items. The higher the interdependency and task variety, the higher the importance of e-mail to an individual’s work. Based on the empirical study the researchers concluded that generally staying aware of important incoming information is better than to check for incoming messages at some moments. The more information a person receives the more a person needs to check the inbox. The method of inbox checking is important; when a person checks the mailbox at fixed times instead of all the time, the feeling of e-mail overload is reduced. Keeping the number of folders low and keeping the inbox clear also reduces the feeling of e-mail overload. The last conclusion is probably the most important one, considering the focus of this research, if workers could control mail overload by having e-mail software designed for managing e-e-mail easier, the coordination would improve.
2.3
I
NFORMATION CHANNELS6 The importance of this part of the paper is that the function of the sender of a e-mail can be a reason for the inadequate processing of that e-mail; e.g. an e-mail from a manager is more likely to be responded properly to then a message from someone on the same level in an organization or a on different department or someone outside the organization. The paper (Tyler, Wilkinson, & Huberman, 2004) presented a method of research for indentifying communities within organizations fully automated. This method uses large e-mail log-files and only uses the To and From field of each message. This method saves a lot of time since it is not necessary to perform a survey or other time-consuming research methods, besides, because the sample is as large as the population, lack of validity is almost impossible. To visualize the results, it is
most effective to build a graph. This graph contains vertices and edges, in which the vertices represent the people and the edges the communication channels. With this method, you can calculate the betweenness centrality, the number of edges between two vertices (Freeman 1979). This is useful when measuring how people relate in a community. In figure 3 an example is given,
this is also the smallest possibility of the connection of two communities. To use this method it is important not to use all the e-mail communications, for example you can exclude messages sent to more than 10 people at once, or exclude not-bidirectional communication flows, this to give a better impression about the social behavior in community. Tyler et al. found out within a study of the HP labs mail server (185,773 messages) that organizational hierarchy is somewhat visible in the e-mail network. Evaluating results from these graphs can give information about actual leadership; this was with previous methods hard to discover. Though
managers think they have a good image of the organization, social network analysis studies are showing that they have different levels of accuracy in understanding the network around them (Cross, Parker et al. 2001). As units move higher into an organizational structure, their work begins to entail more administrative tasks
[image:16.612.88.522.419.651.2]FIGURE 3 THE SMALLEST POSSIBLE GRAPH OF TWO
FIGURE 2 FORMAL VS. INFORMAL STRUCTURE IN A PETROLEUM FACTORY Senior Vice Pres. Jones Exploration Williams G&C Cohen Smith Hughes Ramirez Bell Cole Hussein Kelly Petrophysi cal Cross Andrews Drilling Taylor Sen Moore Miller Production Stock Production O'Brien Paine Resevoir Shapiro Cole
Shapiro Paine
O’Brien Stock Cohen Kelly Smith Cross Moore Hughes Hussein
Ramirez Bell
7 that makes them both less accessible and less knowledgeable about the day to day work of their subordinates (Cross, Parker et al. 2001). In one of the studies they wrote about, they found out that a person low in the organizational structure was in fact the center of the social network; an example is given in figure 2. The figure gives a clear example of a possible difference between a formal and an informal structure. The authors also argue that the physical location of an employee also affects the interaction between co-workers; enabling them to use electronic ways of synchronous communication, like instant messaging, will improve their interactions. Although e-mail is an asynchronous method of communication it is used “synchronous” sometimes, this because people immediately respond on an message which is bouncing a few times till the problem is solved, this is called peri-synchronous communication (Tyler and Tang 2003).
2.4
E-
MAIL CLIENTThis chapter explains the influence of the e-mail client on the phenomenon of responsiveness behavior. Since all e-mail clients have basically the same features, the influence of this aspect on the phenomenon of responsiveness behavior is not critical. However, some scientist developed some attempts to improvements for existing e-mail clients; in particular Microsoft Outlook. Can these improvements be a solution for the proposed problem? An e-mail client can be categorizes as a personal information management tool, which from now on will be abbreviated as a PIM.
Before referring to literature about current clients and already developed solution, I would like to re-emphasize the proposed problem. The main research question is; what are the shortcomings associated with the transparency in responsibility for internal information flows through e-mail.
The attempts of redesign to improve e-mail communication that are available are not designed as solutions for specific proposed problem. Though one article contains explanation that the reliability of e-mail is suffering the fact that the ad-hoc workflow processes of e-mail are not manageable (Scerri, Davis et al. 2009). Another group of scientists argued that although e-mail has taken a central role in task management, e-mail tools have remained relatively static while user’s practices evolved (Belotti, Ducheneaut et al. 2003). Both teams developed an experimental layer over Microsoft Outlook. Scerri, Davis, Handschuh, & Hauswirth developed software to add semantics to e-mail; they go that far that their software is able to “read” a message and decides what a e-mail exactly is based on the Speech Act theory. Belotti, Ducheneaut, Howard, & Smith developed software to make e-mail more task-oriented.
All e-mail clients offer the same possibilities for archiving e-mail into folders. The e-mail user is free to build as much folders as he likes. Next paragraph will explore this way of organizing e-mail traffic.
2.4.1
C
URRENT ARCHIVING USAGE OF THE CLIENT8
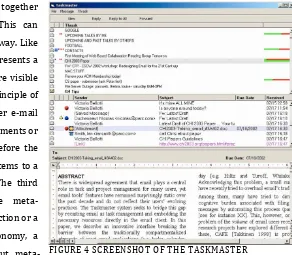
FIGURE 4 SCREENSHOT OF THE TASKMASTER
30 folders to maintain the effectiveness of filing inboxes; the mean number of the participants of the research was 90.8 with a median of 27, the maximum was 400 folders. Strangely, the greater the e-mail experience, the higher the number of folders; this evolves the question whether more experience increases the effectiveness of e-mail or not. Folders are created based on different criteria, e.g. sender, organization, project, or personal interest. The main reason why the individuals file their mail into folders is to increase access-time to previous received mail. Further results showed that a few people use the search function of their e-mail client but almost all respondents use the sort function.
2.4.2
A
TTEMPT TO IMPROVEMENT1:
B
ELOTTI,
D
UCHENEAUT,
H
OWARD,
&
S
MITH IN2003
Here a new layer over Outlook was designed, the Taskmaster. This system should embed task-centric resources into the e-mail client. The prototype they designed was tested during a two-week study. They are indignant about the fact that in Microsoft Outlook the inbox is separated from the task list; despite much of the received messages are indistinguishable from to-dos. They based their redesign on earlier studies of e-mail use. Only the user interface is redesigned without touching the infrastructure. In their research, they found a relation between the number of threads one is tracking per day and the length of the interval between the messages of these threads. The multiplication of these variables gave a better relation with e-mail overload then just the number of messages, this because when someone is keeping track of a thread with a large interval, the last message drifts away in the inbox when new messages arrive. The first part of their redesign are the Threaded Task-Centric Collections; this provides a semi-automatic system to build a collection of different items that belong together
(to the same task) in your inbox. This can decrease the risk of messages drifting away. Like shown in the sample the list above represents a list of different tasks, below the items are visible related to the selected task. A second principle of this system is that they do not consider e-mail messages as always the carrier of attachments or links as classic e-mail clients do. Therefore the new system allows users to add these items to a task that has never sent by e-mail. The third principle is that items can have meta-information like a deadline, reminder, action or a color code. Using the theory of taxonomy, a semantic can be information but
9
FIGURE 6 PROCESSING INCOMING MAIL
expires, they added action clusters to visualize the amount of actions related to the task, and task-specific contact lists to have easier contact with people associated with a specific thread.
The tool was designed, implemented and tested for two weeks by nine participants. The results proved that the positioning of e-mail as task management is something the users found undeniable necessary. Despite the poor quality of the software, some users are still using it after the experiment. The most important conclusion written in this research is that it is possible to significantly positively affect users’ experience by embedding task management resources directly in the inbox(Belotti, Ducheneaut et al. 2003).
2.4.3
A
TTEMPT TO IMPROVEMENT2:
S
CERRI,
D
AVIS,
H
ANDSCHUH,
ANDH
AUSWIRTH2009
The second attempt to improvement is quite recently developed. This tool also adds semantics to e-mail communication. They define e-mail as a transportation layer, which supports what effectively is a number of distributed and well-defined ad-hoc workflow processes. The developers noticed that the productivity of knowledge workers using e-mail suffers the fact that these ad-hoc workflows are not manageable. By adding semantics to mail, the developers wanted to enhance the functionality of
e-mail to give workers better possibilities to manage their ongoing workflows. The software they developed isn’t a change in the transport layer, not a new e-mail client but an extension for existing software, a complex theoretical model beneath a very simple graphical user interface, and it will be useful for everyone using e-mail. The technical method they used is Resource Description Framework (RDF)1
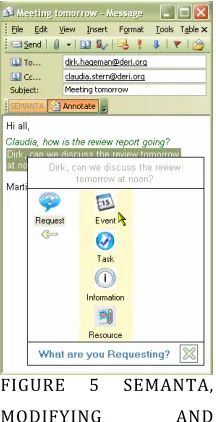
The solution is called Semanta. This software can recognize text within e-mail messages using text analytics services. Adding semantics to e-mail is getting in the neighborhood of Mansystems’ demands. When someone sends a message, the sender can create an annotation of which is known whether it is a request or not; when it is a request, you can also indicate whether it is an event, a task, information or a resource. The answer on a request is also semantically arranged, answering a question is possible by choosing out of several pre-defined answers, an illustration can be found in figure 5. Another advantage of adding semantics to
to bind machine-understandable metadata to e-mail messages. An e-mail has one or more purposes, or action items. These action items can be subdivided into several categories; e.g. a meeting request, a task assignment or a file request. Action items can be translated into Speech Acts, the authors used these terms interchangeable. The authors have many experience with the usage of technology and the coordination of interactions among individuals, they found an acceptable balance between computability and communication.
1 http://www.w3.org/RDF
FIGURE 5 SEMANTA,
[image:19.612.420.528.304.515.2]10 e-mail communication is that it is easier to track. Workers can now see an overview of all pending tasks, both incoming as outgoing. Mansystems wanted to make task management better traceable for higher management, these test results can therefore be of high value in the development of a new systems.
Semanta is tested involving six computer science researchers, though this is a small sample, previous research have revealed that 5-12 users are acceptable for a systems usability study. The results should give underpinning for further development, a later release is going to be tested on a wider audience. Some problems were that the semantics were improperly extracted out of the e-mail messages. The respondents appreciated the fact that they had an overview of all sent messages they were expecting a reply from, without the system and only Microsoft Outlook they took an average of 6.66 minutes to find out of which messages they did not received an answer yet. Users can normally remember 35% of the incoming tasks against a 65% outgoing tasks without checking the e-mail client. The respondents were highly appreciative about the action item tracking function.
2.5
C
ONCEPTUALIZATION [image:20.612.87.522.391.536.2]The literature review partly answers the sub questions proposed in the problem description. Lack of completeness, outdated conclusions and missing elements are the guidelines for the following research. But how might this research look like?
FIGURE 7 CONCEPTUALIZING THE PHENOMENON
Again, this research is intended to proof a phenomenon. What causes this phenomenon, and what is its effect? The literature review has shown multiple possible causes. Below there is a short summarization of the literature.
2.5.1
C
ONTENT OF INFORMATION FLOWSThe high and still increasing importance of information results in the availability of plenty of literature describing information flows. This literature was the underpinning for a better understanding of the usage of e-mail. An e-mail is an ad-hoc workflow, which contains a speech act in order to inform someone. E-mail has
Cause
•Absence of communication workflow
•Awareness of responsebility
•Artifacts of e-mail
•Content
•Semantic understanding
•Network
•Sender's aspects
•Multiple recipients
•Amount
•E-mail overload
•Client
•Other causes
Phenomenon
•Poor responsiveness
•Absence
•Incomplete/misunderstanding
•Long time span
Effect
11 therefore, in probably far most companies, no pre-described workflow. The ad-hoc workflow that arises when someone sends an e-mail is most dependent on the speech act within the e-mail. It is important to mention that one e-mail can contain multiple speech acts (Cohen, Carvalho et al. 2004). A speech act could be a request, a question, a promise, a challenge, or information. A request or a question needs response; this response has a certain quality and response time. This response is a task; people are using e-mail for task management by using their inbox as task overview.
2.5.2
R
OUTES OF INFORMATION FLOWSThe ease of e-mail as the major non face-to-face asynchronous communication method had great influence on the social network in which people communicate with each other. The hierarchy of an organization is the same as the formal network, the social network in which people communicate is in the literature explained as the informal network. The network theory provides methods to map these informal networks. Since E-mail is digitally stored, it provides great opportunities as indicator for these informal networks. These results offer valuable information about how people collaborate and exchange knowledge. It is important to mention there does not necessarily have to be similarities between the formal and the informal network. Another highly important effect of the ease of this communication method is the number of recipients someone can send a mail to at once; this might have influence on the feeling of responsibility to respond.
2.5.3
R
ESPONSIBILITYThe literature is leaving many gaps in the sense of responsibility within communication networks. In fact, no author was found at all building this thesis that has mentioned this subject. Responsibility has to be assigned and described in your job function. Most job functions lack description about responsibility in the sense of e-mail communication and individuals are therefore hardly accountable for poor responsive behavior. A specially developed software tool might increase the transparency of responsibility.
2.5.4
R
EACTION ON INCOMING REQUESTSThis is the most important question. The core problem is that people do not always respond on e-mails that do need a response. The research should give more insight in what might be a cause of this effect. Causes might be:
- Lack of feeling of responsibility - Lack of workflow description
- Lack of functionality of the e-mail client or infrastructure - E-mail overflow
The last three causes were tested in other research and were proven significant. Researchers also developed solutions for these causes, which are also described in this thesis.
- Lack of semantic understanding
12
2.5.5
T
HE AMOUNT OF INFORMATION FLOWSThe amount of e-mail someone receives in a specific amount of time has influence on to what extend someone experience e-mail overload. E-mail overload has influence on the quality of a response and the responding time.
2.5.6
R
EMAINING RESEARCHPeople are using e-mail for task management; authors understand that current e-mail clients are probably not appropriate for task-management. There are many historic survey data of the usage of e-mail, but the results might vary from a study in a different setting, how to measure the independent variables of the setting? The lack of understanding can be a problem for the responsiveness of an individual, because an e-mail can contain multiple speech-acts, an e-mail can also be partly misunderstood.
There is a lot known about the network theory; this theory can help to map the informal network, maybe some relations show up associated to responsibility.
The most important question now is:
13
3
R
ESEARCH
M
ETHOD
Now the attributes of e-mail are explained it is now clear where to look for the problem. When the problem is explored, there is a direction where to look for a solution. A case-study design will focus on the dynamics present within a single setting (Eisenhardt, 1989). This single setting is the organization of Mansystems BV. The question that now arises is how to perform a research that supports the exploration of this problem. The research should give insight how people within an organization communicate with e-mail. This has been done before using an inbox walk-through (Tang & Tyler, 2003) (Fisher & Dourish, 2004); in this case the researcher joined the e-mail user looking at the e-mail client to measure the content of e-mail communication and how did the user reacts upon requests. This method is very time-consuming.
The research should give insight in the four most important attributes of e-mail, which are the network, the content, the amount of messages, and the e-mail client. The units of the research are e-mail users within Mansystems. A possible examination is to confront e-mail user with their own e-mail behavior. When this could be automated, a lot of data will emerge in a short period of time. There is no automated method available to measure the phenomenon; therefore, it has to be designed. The functionality of the automated method should contain the following elements:
- Download the respondent’s e-mail messages
- Let the respondent answer questions about e-mail messages
o From colleagues only o From a specific time-span
- Save all data for analysis and delete all data that is not necessary - Analyze the data
The outcome will provide many data, which will explore the communication behavior within this organization.
3.1
U
NITS14 selected from each stratum. This is called a stratified random sample(Shadish, Cook et al. 2002). The independent variables that most probably influence the usage of e-mail are the function of employees and the department they are situated.
As mentioned before the respondents have to answer questions about their own e-mail usage while they are confronted with their own e-mail communication. In an ideal situation the research sample is 100%, in that case a request and it’s respond could be matched to find out whether there is semantic understanding or not. When the sample size is reduced to 20%, will the “match-able” messages also be reduced to 20%? This is probably not the case.
The usage of network theory should give a more insight in the physical attributes of the problem. The acquiring of these data should be of no effort for respondents due to automatic message synchronization with the survey tool. Should there be two groups of respondents? Both with all communication channels registered and one of which the messages of a specific time-span are surveyed.
So, to select a group of employees who are representative for all the employees of Mansystems, there need to be:
1. gathered a list of all the employees with their function and their department,
2. and selected a sample in a way that every function and department is represented, but the largest part of the sample will consist of respondents who are to a larger extent depending on e-mail communication.
3.2
T
REATMENTThis is the most extensive part of the research. The problem is how to find out whether or not the phenomenon takes place in a specific setting.
Although it is possible to perform this research only using interview data, this endangers the internal validity of the research since there probably is a difference between the human perception and the actual existence of the phenomenon.
15
FIGURE 8 THE HUMAN PERCEPTION AND THE ACTUAL EXISTENCE OF THE PHENOMENON
To find out the actual existence of the problem, a special research tool has to be designed. The software should be able to determine whether the phenomenon takes place or not in this case, and must be able to find correlations when the phenomenon takes place.
After that, these quantitative data will be extended with qualitative interview data to find out the human perception of the phenomenon. These interviews might reveal other causes of the phenomenon. In this part there will be a few cases explored deeply using all available data of the subjects.
3.2.1
S
OFTWARE DESIGNIn this chapter, all technological elements of this research are explained. Because this research has never been done before using this method in this setting, no existing software was available which was able to perform this research. The main system’s architecture consists of the research tool, the database management tool, the data analysis method, and the database itself. All tools were yet available before this research except for the Research Tool, which has to be newly designed.
Human
perception of
the
phenomenon
Actual
existence of
the
phenomenon
Database
Research tool
Database analysis method Database
management tool
[image:25.612.200.416.487.683.2]16
Database management tool
The database management tool was already developed; this tool was originally designed by myself and is able to design, simply analyze, and to modify databases that supports websites. Since the research tool is web-based, this method is ideal in this situation. This tool is used to build the database explained in the next section.
The database
Using previously described tool, a database was designed that supports all the information flows. The basic tables in the database contain the respondents, their e-mail flows and the questions they have answered upon these e-mails. The database contains several tables for storing and providing the data that supports all three elements. The first table [Users] contains the users that have access to the database management tool. Because of privacy issues, there is only one record in this table. The second table [Respondents] contains all the employees of the company, whether they participate in the survey or not. The [E-mail messages] table contains all the messages of all the respondents. The research tool uses this table to present the respondent the e-mail where they have to answer the questions about. These questions are then stored in the next table [Survey]. The [Blocked To-Field] table contains the e-mail addresses that when a message is sent towards this address it is probably not useful for answering the questions. There is only one address in this table [[email protected]]; messages sent to this e-mail address, will be redirected to everybody.
[image:26.612.155.458.393.642.2](This figure is also in the appendix in a better readable size)
17
The research tool
[image:27.612.217.395.153.348.2]This is the most crucial part of the development. This part is completely specific developed for this purpose. A suitable design framework for this development is the Function-Behavior-Structure framework (Gero & Kannengiesser, 2003).
FIGURE 11 FRAMEWORK OF GERO & KANNENGIESSER (2003)
This framework highlights the different between the expected behavior and the behavior derived from the structure. This design method provides eight different steps, which have to be performed in order to get what you want and to adjust the requirements during the design process according to new developments.
Process 1: The function variables have to describe the teleology of the object. This tool has to be able to follow the next steps, which are the Functions of this tool:
1. Connect to an inbox.
2. Download every e-mail from the inbox and store them into a database. The inbox will be downloaded using the POP3 protocol. The Microsoft Exchange server will provide all e-mails in the inbox whether they have been read or not. This excludes messages that have been filed into a different folder than the inbox. Some employees file all their mails into folders, these e-mails are then not available for this research. These employees cannot be a respondent for this survey.
3. Ask questions about some e-mails that meet specific demands:
• They need to be from a specific period
• They need to be from a person, so not automatic generated or spam • They have to contain work-specific requests or information
18 (This figure is also in the appendix in a better readable size)
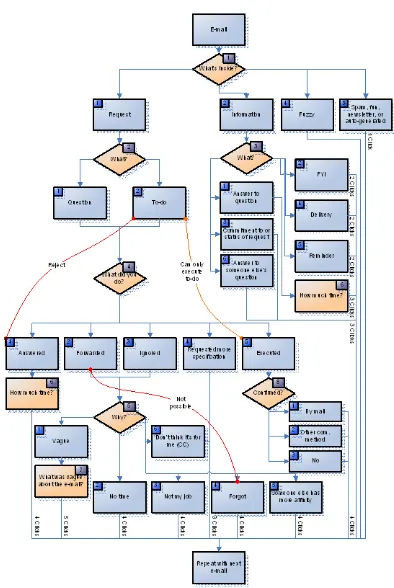
FIGURE 12 RECURRING PROCESS FOR EACH QUESTION IN THE RESEARCH TOOL
There are eight different questions of which only, according to the flowchart, some of them need to be answered based on their content. This survey tends to find what the sender’s purpose is and how the receiver responded upon the message. To find out whether it is a request or not the first question will derive the most important property of the message. Since e-mail messages may contain multiple speech acts, the user is asked to choose the most important goal of the message. Below you will find an explanation of all the questions. The numbers below match the numbers of the orange boxes in the flowchart.
This question offers four different answers; a request, information, fuzzy, or spam, fun, newsletter, or auto generated. Some e-mails can be categorized into more options. Therefore, the options are ranked, the first option that matches the e-mail should be chosen.
1
Spam, fun, newsletter, or auto generated FuzzyIn this case you’re not sure what the sender exactly means by sending the message; e.g. does he want you to act upon or does he just want you to know something. The last example can occur in case your name is in the CC field or you’re one of the many names in the To-field.
Request
19 When the user answered the main content of the message is a request it can be a question or a do. The to-do differs from the question when the question requires other action than just answering the question.
The third question has to be answered when the user indicated the main content is information. This could be separated into six different types of information. At first, it could be an answer to the user’s own question; this is the most important measurable type of information because after this the time span could be given between the initiation and the time the user answered. The remaining possibilities are listed in the explanation below.
answering a question or execute a task.
Information
This option has to be selected in case the sender wants to inform you. This includes answers or commitments to your requests.
2
QuestionIn this case the sender of the request wants you to just answer a question because the sender assumes you posses the knowledge
To-do
The sender wants you to perform some task other than just answering a question.
3
Answer to your questionYou asked a question, this is an answer whether it is useful or not.
For your interest
The sender has something that might interest you
Commitment to or status of your request
You assigned a task to someone; the person commits to the task or gives a status report of it.
Delivery
This message contains one or more attachments. This should not be initiated by a request by you; in that case it’s a “commitment to or status of a request”.
Reminder
The sender reminds you of something that you have already agreed on.
Answer to someone else’s question
20 The fourth question is preceded by the second question about the type of request. Since a request requires a response this question is about how the user reacted upon the request. This is the most important question of the survey. When the user answered multiple of these questions the responsiveness behavior becomes measureable.
In the cases that a user answered “forwarded” or “Ignored/did nothing yet” it is important why that happened. There are six different possibilities.
knowledge.
4
AnsweredYou have answered the question
Forwarded
You have forwarded this request to another colleague whom might be more able to respond on this or has more time for it.
Ignored/ did nothing yet
You did nothing with or without a reason.
Requested more specifications
Te proposed request was not clear enough, therefore you have requested more specification.
Executed
You have executed the proposed task; of course you cannot execute a question. (This one becomes available when the user answered “to-do” in the second question for obvious reasons).
5
Because it was vagueThe message was too vague to give a proper reply on it.
Because you got no time or still had no time
You just didn’t respond on it.
Because it’s not your job
Responding on this message does not belong to your set of tasks.
Because you accidently forgot it
You intended to respond on this message, but you accidentally forgot (this option is not available when the user selected “forwarded”).
21 This answer need to be answered after the user indicated that he has answered a question or has received an answer on his own question.
The following question is asked when a user indicated he did not responded upon a request because the content was vague. The user then has the possibility to copy/past the text of which he thinks that makes the message is unclear.
This question is asked when you user has indicated he executed a to-do. Logically the initiator of the task would like to know the status of the to-do, therefore the user can indicate whether or how he confirmed the finished to-do to the initiator.
This option is when you think the process will be finished more efficient or effective when someone else will take care of this (this option is not available when the user selected “ignored”).
This message is sent to multiple persons, I do not think I have to respond on this
You are one of the recipients, the probability that some other recipient will take care of this is high (this option is not available when the user selected “forwarded”).
6
How much time did it take?Directly
Less than an hour Half a day
One day A few days A week
More than a week
7
What was vague about the e-mail?8
Have you confirmed that you have executed the to-do?By replying with an E-mail
By other communication methods
This could be everything except e-mail; e.g. face-to-face, phone, text messaging, or instant messaging.
22 4. After the questionnaire the e-mail texts have to be emptied end e-mail addresses have to be converted into
numbers in order to maintain privacy
Process 2: This step is to transform the previous described requirements into a solution structure. This structure applied should then cause a behavior, which is visualized as Bs in the scheme. This structure is based upon the designer’s experience. This structure contains the different elements used and a description how they relate.
The elements:
• Microsoft Windows 2008 server • Internet Information Server 7.0
• An internet application build in Active Server Pages; the most important files:
o main_survey.asp This file regulates everything that’s support everything that has to do with
getting the survey tool working into the respondent’s browser
o phase_0.asp This file provides the possibility to log on
o phase_1.asp This file provides the possibility to connect to the respondent’s inbox o phase_2.asp This file is the survey itself, this file is used again for every e-mail
o phase_3.asp This file provides the possibility to end the survey, it will show that every
e-mail’s text is removed and e-mail addresses are converted to numbers
o process.asp this file provides all the data actions
[image:32.612.82.553.450.615.2]The next figure shows how they are connected to each other:
FIGURE 13 CONFIGURATION OF ALL TECHNICAL ELEMENTS OF THE RESEARCH TOOL
23 Like many software-development projects a lot of problems showed up at different stages. Therefore, the structure need to be adjusted in order to let the behavior derived from the structure match the expected behavior. During test-phase there were coming up a lot of unforeseen problems. So there was a difference between the expected behavior and the behavior derived from the structure; these differences needed to be repaired in the next steps.
Process 4: The evaluation whether the behavior derived from the structured matches the expected behavior indeed
Some differences between the expected behavior and the behavior derived from the structure were: - The database crashed while handling lots of data because one field that should be indexed wasn’t - When answering questions in multiple times, the user was presented the first question in later sessions
instead of the first unanswered question.
- One step of the procedure of questions was not available. Process 5: Producing the design description
In this process, the actual software is programmed. Since the simplicity of the research tool, describing this and the next processes does not have any benefit for understanding this research. This also since this theory was designed for alternative usage of software then its original purpose. In this case the expected behavior was mainly the same as the behavior derived from the structure.
3.2.2
Q
UALITATIVE INTERVIEWSThe software design, described in the previous section, can provide results with high statistical validity. Although these results can show whether the phenomenon takes place or not, people can experience this phenomenon different. Qualitative interviews therefore should go deeper in to a few cases and highlight differences between the way people experience the phenomenon and actual existence of the phenomenon. The questions are built based upon the conceptual model. After the interview the answers should reveal how interviewees experience previously discovered causes of the phenomenon, but the answers can also reveal new possible causes.
#1: Do you feel responsible for the continuity of your colleagues whenever it is in your possibilities to involve?
The first question is to find out whether someone feels responsible for the continuity of fellow colleagues in general instead of only the feeling of responsibility when just for filling a request sent by e-mail is enough. Responsibility is hard to research since it is somehow a vague definition, but the lack of transparency in this matter is one of the causes of the phenomenon. Especially in decentralized organizations this is an important issue.
24 This question focused on the feeling of responsibility in cases requests are sent by e-mail. Some properties of e-mail, e.g. the informality, multiple receivers, or the easiness of just sending a request, can influence the feeling of responsibility of the receiver.
#3: Do you think your respond times are above or below average responding times?
#4: Do you think you respond times are too slow?
#5: Do you think your respond times could be improved?
The phenomenon covers poor responding upon requests, so also late response. This part is measured in the quantitative part of this research, but the awareness of e-mail users is also important. The literature showed that responsiveness image of others influences the way people address their requests. People who are optimistic about other’s responding time are more likely to send requests.
#6: How do you think the quality of the answers you send relate to the answers that are sent to you?
Like respond time, the phenomenon also exists of response quality. When e-mail is answered in a short time span it is still possible the answer has insufficient quality; the answer could be incorrect or incomplete. The relation between the quality of the respondent’s response quality and the average response quality should give an indication of this.
#7: When you send a mail with question(s), how do you consider the average completeness of the answer?
A severe problem of the responsiveness behavior of e-mail user is the incompleteness of their responses. This is mainly the case in a situation an e-mail contains multiple requests. Often the requests are then partially answered which then causes the e-mail user to send one single e-mail for every question which in turn can increase e-mail overload.
#8: How do you think your satisfaction about the way your mail is replied could be increased?
Since e-mail user might experience this phenomenon often, they probably philosophize about a solution for this problem. This question can generate data for a possible solution for the problem.
#9: Do you use your mailbox for task management?
#10: Do you use your mailbox for personal archiving?
#11: Do you use your mailbox for a-synchronous communication?
E-mail is sometimes used for things for which e-mail is not designed. Research showed that e-mail is used for of course a-synchronous communication, but also for task-management and personal archiving (Whittaker & Sidner, 1996). The last to uses can have effect on the phenomenon.
25 Filing e-mails in folders can have effect on the phenomenon. There is an ideal number of folders for dealing with e-mail.
#13: When do you check your inbox?
The way people check their inbox can have an effect on the feeling of e-mail overload, which in turn has an effect on the phenomenon.
#14: How do you keep track on your outgoing tasks?
#15: How could a personal information management tool be improved in order to give a better overview of in- and outgoing tasks?
E-mail users sometimes have to deal with large amounts of incoming tasks, but also with the tasks they have sent towards others.
#16: The asynchronous character of e-mail communication gives users freedom to respond on an e-mail whenever they like to, do you think there is a way to have this way of communication more synchronous? Do you use e-mail peri-synchronous sometimes?
Since the purpose of this research is, besides investigating the phenomenon, also to build foundation for a solution. Peri-synchronous communicating through e-mail is a phenomenon when people are having a conversation with e-mail. In this case people respond on e-mails in a very short time-span and expect a message in return in that same amount of time; this looks like “chatting”. Sending requests with instant messaging tools can be an effective solution for the phenomenon. This question tends to find out the experiences of the respondent in the sense of this.
#17: Discussion about the integration of the proposed solutions in the literature. (Belotti, Ducheneaut, Howard, & Smith, 2003)(Scerri, Davis, Handschuh, & Hauswirth, 2009)
There are two possible solutions for this phenomenon built in the past; which are described in the previous chapter. This discussion tends to find out the respondents opinion about these solutions.
#18: Do you think your results are representing your e-mail behavior?
#19: Do you think the results are representing the average e-mail behavior in this company?
#20: Do you think the survey is missing some important measureable elements about e-mail communication?
The last three questions are important to test the validity of the quantitative research with the experience of the interviewees.
#21: Can you explain three or more advantages of e-mail?
26 It can be possible there remain some important elements overseen, maybe the interviewee has some important additional factors.
#23: Do you have experience with incompleteness of questions or other vague requests? E.g., you considered an e-mail as being just information but it turned out this was actually a request.
The lack of semantic understanding the content of an e-mail can be problematic. This cannot be tested with the quantitative research. Lack of semantic understanding can be a cause of the phenomenon.
#24: What do you think that causes the phenomenon?
#25: Where do we need to look for a solution?
Maybe there are some independent variables overseen which cause the phenomenon. The interviewee can provide all possible causes of the phenomenon.
#26: What do you think that are the effects of the phenomenon?
Maybe there are some effects of the phenomenon which are overseen. The interviewee can provide all possible effects of the phenomenon.
3.3
S
ETTINGQuantitative
To maintain internal validity the setting is a normal work environment. The questions that have to be answered are about historical data, their inbox messages between 21 and 7 days ago. These messages are filtered according to whether they are from a colleague from this company. The respondent can choose his or hers own moment to participate within a specific time span of initially a week. Some respondents participated within a month due to lack of time, not understanding the application, or technical failure.
Qualitative research
27
4
R
ESULTS
This chapter will present the results of this research. These results will contain quantitative data explained with the literature of which this concept of e-mail is based on and qualitative data from the interviews.
4.1
C
ONTENT AND HANDLING OF INFORMATION FLOWSThe content of and especially the handling upon information flows per e-mail is the most important part of this research. During the quantitative research, the response upon the requests can only be determined upon its content. The next results are based on a sample of 1060 e-mails.
GRAPH 1 THE AVERAGE CONTENT OF RECEIVED E-MAIL
In the graph the basic content of the information flows are printed. Like in the process in chapter 3.2.1 this is based on the very first question for each e-mail. Remark that this is only based on e-mail communication between colleagues. When the filter malfunctioned, the respondent still has the possibility to classify a message as spam. At Mansystems, 24% of the average incoming e-mail messages are requests, so they need a response. In the following graph the requests are subdivided between questions and to-dos. Of the requests, 59% need a response as an answer on a question, the other 41% need other response like the execution of a task.
Request 24%
Informat ion 65%
SPAM 6% Fuzzy
5%
All e-mails from colleagues
Based on 1062 results
Request Question
59%
Request To-do
41%
All e-mail requests from colleagues
28
GRAPH 2 WHAT RESPONDENTS DID WITH TO-DOS AND QUESTIONS
When the main problem of this research occurs, lack of response on a request, it should evolve within the folowing question, “What did you do?”. Of cours e these graphs should be very different. The following graphs show 5% of the to-do’s are ignored and 8% of the questions are ignored. During the research a future improvement of this research showed up. In case of a to-do and the respondent clicked on answered, this might be not satisfying to the sender because the respondent answered with a rejection. However, the sender of the to-do now knows what he can expect so he can rephrase, re-address, execute by himself his to-do instead of waiting for nothing.
So why are requests ignored? It’s not easy to say, although there is quantitative data, it is insufficient to base conclusions on since there are only 19 ignored requests.
- Vague 0
- No time 8
- Not my job 4
- Forgot 1
- Someone else more affinity 1 - Don't think it's for me 5
Three of the ignored requests were actually requests to cooperate in this research, eight of the ignored requests were sent to more than one person. This research lacks possibilities to determine the importance of a request, so even if there were larger number, it is impossible to measure the actual damage to the business’s continuity. Qualitative data should give more insight in this phenomenon.
Like written in the previous paragraph, eight ignored requests were also sent towards multiple recipients in the to-field; which does not have to mean that that is also the reason the request is ignored. But how often
Answere d 37%
Forwarde d 2% Ignored
5% Request
more spec.
2% Executed
54%
To-dos
Based on 159 results
Answere d 90% Forwarde
d 1%
Ignored 8%
Request more spec. 1%
Questions
29 does this take place? Based upon 8.596 e-mail messages there were 33% of them sent towards multiple recipients (only in the to-field), 52% of them were sent towards multiple people including the CC-field.
(Based on 8.596 results)
GRAPH 3 HOW MANY RECIPIENTS AN E-MAIL IS SENT TO
During the interviews the respondents notified they are all familiar with the phenomenon but do not experience this phenomenon as very problematic; which can be expected after looking at the quantitative data. Since all respondents experienced this phenomenon somehow, a variety of reasons came up.
This research focuses on the phenomenon on internal communications; the feeling of responsibility on the continuity of your colleagues work might have influence on the willingness of someone to act upon a request. In the interviews, all respondents felt responsible for their colleagues; but there were some other artifacts on this. One respondent felt more responsible to act upon his manager requests then to act upon requests of his colleagues on the same level in the organization. Somehow he felt more responsible when he has a nice relationship with the sender then in a case of someone he doesn’t like. Another respondent answered he felt this responsibility all the time; he even said: “I will always intervene when someone contacts me directly”.
Response time
30
GRAPH 4 RESPONDING TIMES
This graph is based on 174 answers given by the respondents and 214 answers sent towards the respondents, so unanswered questions are not included. These data also show that 96% of the requests of the answer sent by the respondents and 96.3% of the answer to their own questions are sent within half a day.
4.2
E-
MAIL INTENSITYThe results of this part of quantitative data determine the number of e-mail messages the respondents of Mansystems receive. Since the phenomenon was not proofed during this quantitative research it is not possible to base correlations on these data.
When the phenomenon would have been proved in this research, a correlation between the number of occurrences of the phenomenon and the average number of messages every week could prove the effect of e-mail overload. Statistical measurements using independent variables like the number of incoming requests, or further acuminated variables like incoming questions or to-dos can provide more specified results. Further research in multiple organizations should provide more information.
Resp. Avg.mes./week Resp. Avg.mes./week
56 76,00 140 7,21
102 56,90 163 81,00
80 72,73 21 63,11
50 79,90 110 44,17
98 14,14 75 16,17
171 27,86 97 11,00
105 115,80 146 30,88
96 100,75 69 6,50
47 102,50 11 9,75
101 150,00 27 46,78
31
48 21,53
TABLE 1 AVERAGE MESSAGE PER WEEK
4.3
N
ETWORKThe research tool is ideal for gathering data of who is actually communicating with whom. There might be a relation between some sender’s entities and the likelihood of the receiver to respond. The quantitative data showed some elementary social networks but lacks possibilities to measure the effect of these sender’s entities since the quantitative data does not contain enough ignored requests. Therefore, the quantitative data lacks two important aspects why it is insufficient:
• The data is based on the inbox, not over the two weeks where the questions were about, but all the
messages in the inbox. Since not everyone leaves all the e-mail in the inbox the data might miss important communication flows, i.e.: when the survey system has captured e-mail data of one month, you miss information about the other months; e-mail communication intenseness between two persons might heavily fluctuate over time. Using e-mail server’s log files for this analysis should improve the quality of this analysis; this because this can be based on e.g. one year of e-mail usage.
• Only a sample is selected out of the whole population in an organization. Since the data only contains
data from the respondents of the survey, important information routes may be missing in the results. This can also be solved using e-mail server’s log files.
32
GRAPH 5 THE NETWORK ANALYSIS - BETWEENNESS CENTRALITY
4.4
E-
MAIL CLIENTAll respondents were using Microsoft Exchange 2007 as e-mail client. Because the research tool can only be used with the e-mails in the inbox, respondents who have organized their messages into folders beside the inbox were not able to execute the survey as proposed. These respondents have summarized how they use their e-mail client to sort e-mail messages into different folders. Because the actual purpose of this research is to investigate mail behavior in order to find out how “mail” could be improved, information about how e-mail users are using their client right now can be of additional value.
In total there are 11 e-mail users who explained their e-mail organization behavior. So these data only contain explanations about the way e-mails are organized into folders.
Based on these data it is clear that archiving inboxes on customer or project is very popular. Note again that the data above are only the respondents that uses folders, users that do not use folders intensively were not included in this part of the research.
4.5
C
ASE STUDIES33
4.5.1
I
NTERVIEW1
–
ID
98
GRAPH 6 RESPONDENT 98 (RECEIVED MAIL BASED ON 56 E-MAILS)
E-mail routes and its content
The first part of the interview, about responsibility in general, the respondent finds himself responsible for the continuity of his fellow workers; although it depends on some other variables. It depends on whether he likes that person or not. He feels more responsible for processes of his manager then for the processes of colleagues of the same hiera