J*rinted in Great Britain © The Company of Biologists Limited 1984
RELATIONSHIPS BETWEEN NEURONAL
STRUCTURE AND FUNCTION
BY JOHN P. MILLER AND GWEN A. JACOBS
Department of Zoology, University of California, Berkeley and Department of Biology, State University of New York, Albany, U.SA.
SUMMARY
The geometry and electrical properties of a neurone determine how synaptic inputs and endogenously generated currents are integrated and transformed into the signals it transmits to other cells. The dependence of neuronal integration upon dendritic geometry has been studied extensively over the last three decades, both by experimentalists and by theoreticians. We review some of the general principles that have emerged from this work, and summarize recent studies that serve to illustrate these principles. The discussion is organized around the analysis of neuronal structure at three different levels. At the 'macroscopic' level, we show how the dendritic branching structure of an identified interneurone in the cricket cereal af-ferent system determines the directional sensitivity within its receptive field. At the 'microscopic' level, we illustrate the dependence of synaptic efficacy upon dendritic length, and demonstrate a very surprising result: that the extension (or 'growth') of a dendrite out beyond the point of a synaptic contact can increase the efficacy of that synapse. At the 'ultra-structural' level, we show how the structural and electrical properties of dendritic spines might have profound effects upon synaptic integration.
INTRODUCTION
It is a fundamental principle of neurobiology that the function of a neurone is dependent upon its structure. The structure determines, to a large extent, how the synaptic inputs and endogenously generated currents of neurones are 'integrated' and transformed into a 'meaningful' output to other neurones, muscles or effector organs. This functional dependence upon neuronal structure is manifest at three levels within a nerve cell: the 'macroscopic', 'microscopic' and 'ultrastructural'. By 'macroscopic' structure, we mean the overall shape of a neurone, how many dendritic and axonal branches it has, and where in the nervous system those branches are located. By 'microscopic' structure, we mean the shape, length, diameter and branching points of the individual branches. By 'ultrastructure', we mean the shapes of the neurites near the points where synaptic contacts are located, the 'local' contours, dendritic spines and varicosities.
The dependence of neuronal integration upon dendritic geometry at each of these three levels has been studied extensively over the last three decades, both analytically
and through the use of computer models. Due to the work of Rail, Jack, Redman Shepherd and many others, we have all developed a common, quantitative conven-tional wisdom about the relationships between neuronal structure and function. In addition, recent advances in single cell staining techniques now allow experimenters to take morphological measurements of cells from which electrophysiological record-ings have been obtained. Together, these theoretical and experimental studies have given us the tools we need to ask and answer very precise questions about neuronal form and function. It is the purpose of this paper to discuss the relationships between neuronal structure and function at each of the three levels listed above, by presenting examples of recent work which illustrate the use of new experimental and computer modelling techniques.
At the 'macroscopic' level, we show how the dendritic branching structure of an interneurone in the cricket cereal afferent system determines the directional sensitiv-ity within its receptive field. This example also demonstrates the use of a new technique we have developed which allows the experimenter to modify the structure of a cell while its activity is being monitored. The technique utilizes a laser microbeam to photoinactivate individual identified dendrites. This section also demonstrates how a computer model of this identified neurone was used to address questions that could not be answered through direct physiological experiments.
At the 'microscopic' and 'ultrastructural' levels we summarize recent theoretical modelling studies that one of us (JPM) has carried out in collaboration with Drs Wilfrid Rail and John Rinzel. At the 'microscopic' level we illustrate the dependence of synaptic efficacy upon dendritic length, and demonstrate a very surprising result. We show that the extension (or 'growth') of a dendrite out beyond the point of a synaptic contact can increase the efficacy of that synapse. At the 'ultrastructural' level we show how the structural and electrical parameters of dendritic spines might have profound effects upon synaptic integration. In particular, if the membrane on the head of a spine is capable of generating an action potential, a spine may act as a powerful 'amplifier' of synaptic efficacy.
MACROSCOPIC STRUCTURE
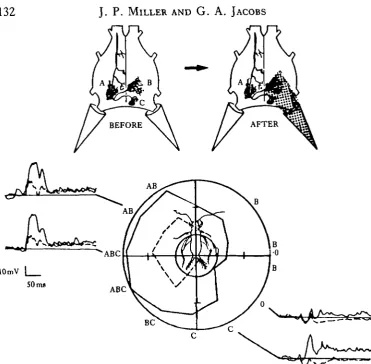
Fig. 1. Camera lucida drawing of interneurone 10-3 in the terminal abdominal ganglion. Three classes of sensory afferents associated with filiform haire on the cerci (represented as cones at the rear of the ganglion) overlap with the three dendrites labelled A, B and C. Each class responds to a different optimal wind direction indicated by arrows pointing at the hairs.
hypothesis directly for an identified interneurone. We demonstrate that this inter-neurone receives different inputs specific to each dendrite and that it sums these inputs in different combinations to shape its receptive field.
Fig. 1 is a camera lucida drawing of the identified sensory interneurone, '10-3' that we have used in our experiments. It has three separate dendritic regions in the last abdominal ganglion of the cricket nervous system. Based on anatomical observations described in detail by Murphey, Walthall & Jacobs (this volume), each dendrite is known to overlap with a separate class of sensory afferent which is sensitive to a dif-ferent wind direction. This is shown schematically in Fig. 1. These sensory neurones innervate filiform hairs that cover the surface of two sensory appendages called cerci at the rear of the animal. The hairs are lodged in sockets that constrain their movements to a single plane (Palka et al. 1977). The sensory neurone responds only when the associated hair is deflected in one direction (Tobias & Murphey, 1979). Puffing wind at the cerci from different directions therefore selectively activates different classes of sensory afferents, and thus provides a means of testing whether the receptive field of 10-3 fits the anatomical predictions suggested by Murphey and his co-workers.
nJ^A^rxM****
lOmV 50 ms
[image:4.451.40.412.45.409.2]'-•\A£^c*
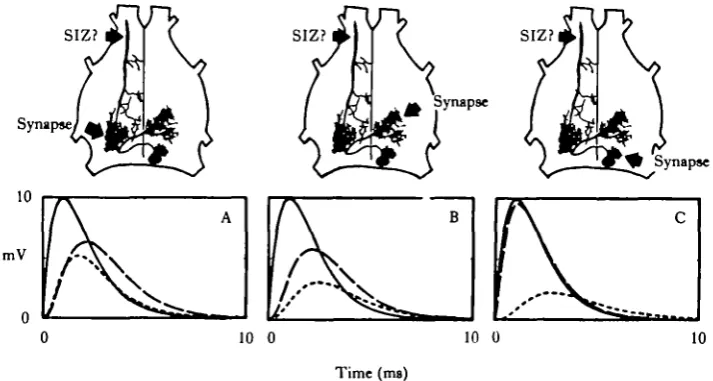
Fig. 2. Directional sensitivity of 10-3 before and after covering one cercus. The responses of it to five wind puffs at each position were averaged and the area was measured with respect to the baseline. These values were normalized to the maximum and plotted according to wind position. The outer circle indicates the maximum normalized area 10, and the small inner circle represents 0 0 . Values inside this inner circle indicate inhibitory responses. The letters around the perimeter of the graph indicate which dendrites should be activated by wind from that direction. For example AB indicates that two afferent classes that should activate dendrites A and B are stimulated from this position. The outer solid line represents the receptive field when all inputs were intact (upper left cartoon). The inner dashed line represents the receptive field after the right cercus had been covered (the stippling in the upper right cartoon). Sample records from the cell before (solid traces) and after (dashed traces) covering the right cercus are shown superimposed at four positions around the curve.
100 ms after stimulus onset and plotted as a function of wind position. The solid line in Fig. 2 represents the receptive field and fits the anatomical predictions quite well. The cell was directionally tuned to wind directed at the front and left side of the body which corresponds to the sum of optimal wind directions for the three classes of afferents that overlap with 10-3.
K^his blockage was achieved by covering the right cercus with Vaseline, which im-mobilizes the hairs and silences all the afferents that project to the right side of the ganglion. The inner dashed line in Fig. 2 represents the response of 10-3 to the remaining inputs. As predicted by the anatomy, the maximum response from 10-3 was observed for wind directed at the lateral face of the cercus, which is the optimal stimulus for afferents that overlap with dendrite A.
The most straightforward interpretation of these results is that the inner dashed line results solely from excitatory inputs onto dendrite A. However, we recorded inhibit-ory responses in this cell to wind stimuli at several other positions. These stimuli activate afferents that do not overlap with dendrite A and thus must be activating a polysynaptic pathway. The presence of these inhibitory pathways which have been identified in this (Levine & Murphey, 1980) and other analogous systems (Reichert, Plummer & Wine, 1983) clouds this simple interpretation.
Vvwv /
[image:5.451.39.420.252.601.2]10 mV 50 ms
In a second set of experiments a single identified dendrite was 'excised' from 10-a
in situ, with a laser microbeam. This technique provides a direct test of whether thai
dendrite receives a specific directional input and eliminates the possibility of it receiv-ing polysynaptic input from other afferents. A modification of the dye-sensitized photoinactivation technique devised by Miller & Selverston (1979) was used to ablate dendrite B of 10-3 (Fig. 3). The cell was filled with Lucifer Yellow and the dendrite illuminated with a spot of intense blue light, using a helium-cadmium laser directed through the optics of a stereo dissecting microscope as the light source. The microbeam could be focused to a spot of about 30 [im and allowed this dendrite to be inactivated without damaging the rest of the cell. In the experiment in Fig. 3 the left cercus was covered with Vaseline to block input onto dendrite A, leaving only inputs to dendrites B and C intact. A control receptive field was measured and plotted in the outer solid line which represents the summed inputs to dendrites B and C. Dendrite B was then inactivated with the laser and the receptive field was again measured and plotted (inner dashed line). The response of this modified 10-3 was maximally sen-sitive to wind directed at the medial face of the right cercus which indeed is the optimal stimulus for the remaining dendrite C. Wind directed at the front of the animal, the optimal stimulus for dendrite B, produced a negligible response. At positions which activate both dendrites B and C, the response was decreased by about half, which suggests that the inactivation was limited to the B dendrite and that inputs to dendrite C were still effective. In addition, responses to stimuli which should activate only the C dendrite were not changed in amplitude. This experiment reveals the directional sensitivity of dendrite C (dashed line) and by subtraction that of dendrite B. It also proves that the B dendrite receives input from a select class of afferents that respond to wind from the front of the animal, as predicted by the anatomy.
In summary, both of the experiments provide evidence that supports the idea that the receptive field of this identified interneurone consists of contributions of specific directional inputs to each of its dendrites. The overall directional sensitivity is therefore determined by the position of its dendrites within the central nervous system. The inherent limitations of the available recording techniques make a more com-plete analysis of this cell impossible. The main problem is that reliable recordings can only be obtained from the cell body. However, it is the voltage fluctuations at the spike initiating zone (SIZ) that we hope to understand and characterize, since it is these that determine its firing rate. In other words, the SIZ is where the inputs onto all of the dendrites are translated into the relevant output to higher centres.
t
immarized in this chapter) were identical to those described by Lev-tov, Miller, urke & Rail (1983). The passive electrical parameters for these compartments (membrane capacitance, Cm, cytoplasmic resistivity, Ri, and membrane resistivity, Rm) were assumed to be uniform throughout the cell. Values for Cm and Ri were set at 1 (J.F cm"2 and 70 Qcm respectively (for a summary of reported values from many preparations, see Rail, 1977).Values of Rm reported for other insect neurones may not necessarily be applicable to 10-3. Therefore, we used the model to calculate the most reasonable value for Rm by re-calculating iteratively the input resistance (Rin) of the model for different values of Rm. An Rm value of 10000 Qcm2 yielded an Rin of 11 MQ, which was the value measured from the cell body of the neurone used for the anatomical reconstruction. To locate the most likely site of spike initiation, we took a similar iterative approach by programming a special subroutine that could control the voltage of any dendritic compartment of the model. This subroutine was set to generate a voltage transient that displayed the time course of a real, overshooting action potential. We could 'connect' this 'spike-initiating' routine to any compartment of the model, and calculate what the attenuated spike would look like in the cell body. When the SIZ was in the compartment corresponding to the position indicated in Fig. 4, the amplitude and time course of the attenuated spikes calculated at the model soma matched those of recorded action potentials. If the spikes were initiated further from or closer to the model soma, the attenuated spikes were either too small and broad or too large and sharp, respectively. This relatively remote location for the SIZ is somewhat surpris-ing. We are currently performing experiments to locate the SIZ in living cells and testing the assumptions used in setting up the model.
The model could then be used to calculate the passive attenuation of postsynaptic potentials between any points, including this putative location of the SIZ. Our
SIZ?
Synapse
mV
10 0 10 0
[image:7.451.48.405.404.594.2]Time (ma)
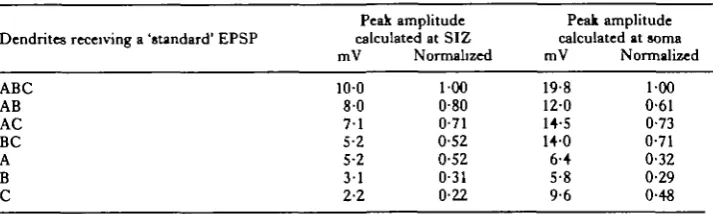
approach was (1) to generate a 'standard' 10 mV EPSP at a selected input site on thg model structure and (2) to calculate what the amplitude and time course of the attenuated EPSP would be at the SIZ and at the cell body (Fig. 4). For each of three dendritic input sites, the standard EPSP is drawn with a solid line, and the resulting soma and SIZ EPSPs with a long-dashed line and a short-dashed line respectively. First consider panel A, which shows the result of a 10 mV EPSP onto dendrite A. The peak amplitudes of the attenuated EPSPs calculated at the cell body and SIZ were 6 4 and 5 2 mV, respectively. These nearly equal attenuations are easily under-stood in terms of the structure of the cell: dendrite A is approximately equidistant from both the soma and SIZ. The results in panel C are also easily understood in terms of the 'electroanatomical distances' involved. A 10 mV EPSP onto dendrite C suffers little attenuation over the short path to the soma, but is severely attenuated along the long pathway to the SIZ. Peak amplitudes at the soma and SIZ were 9-6 and 2-2 mV, respectively. The centre panel shows the results of an EPSP onto dendrite B where peak EPSP amplitudes at the soma and SIZ were 5-8 and 3 1 mV, respectively. These results also make sense in light of the previous two panels: inputs onto this branch are the farthest of all three from the soma (hence the smallest soma EPSP) but are at an intermediate distance from the SIZ with respect to the other two dendrites.
[image:8.451.49.406.538.645.2]What do these calculations tell us about synaptic integration in this cell? First, the relatively high membrane resistance and large diameters of the dendrites ensure that all three of the synaptic input areas are 'electrically close' to the SIZ. The attenuation between the site of synaptic input and the SIZ ranges from 48 % (for dendrite A) to 78 % (for dendrite C). Although inputs to dendrite A would therefore have a greater 'weight' in controlling spike output of the cell, inputs to C would certainly exert a substantial effect. Second, by the same reasoning, the synaptic input areas are not isolated from one another, since they are closer to one another than they are to the SIZ. Thus, any inhibitory input to one branch might cause a significant 'shunt' to current entering another branch. Finally, and most important, the soma seems to be a valid recording site for this particular neurone. Indeed, the soma is electrically 'closer' to each of the synaptic inputs than the SIZ. Even the details of the directionality plots measured at the soma should be fairly accurate representations of what the SIZ 'sees'. Table 1 shows the values of the peak amplitude of 'composite' EPSPs calculated for the soma and SIZ, for different combinations of 'standard' EPSPs onto subsets of the three branches. For ease of comparison, the results obtained by normalizing each
Table 1. Values of the peak amplitudes of composite'EPSPs for different combinations
of'standard'EPSPs
Peak amplitude Peak amplitude Dendrites receiving a 'standard' EPSP calculated at SIZ calculated at soma
mV Normalized mV Normalized
100
3 =§. 50
E
w:
/
A B C
A B
A C
B C
Dendrites receiving EPSPs
Fig. 5. Peak amplitude of composite EPSPs due to simultaneous activation of synapses onto different combinations of the three dendrites of the model 10-3 neurone. Values were calculated at the soma (long-dashed line) and the SIZ (short-dashed line). The subset of the three dendrites activated in each are listed along the x axis. Values on the y axis are expressed as percentage of the maximal amplitude for each series (obtained by simultaneous activation of all three branches).
column to its maximal value are also listed, and plotted in Fig. 5. Discrepancies between the calculated effects at the two different sites are due largely to the location of dendrite C much closer to the soma than to the SIZ.
The use of this computer model has greatly enhanced our understanding of this neurone. Modelling studies are currently in progress that should help us to under-stand better the experiments in which single dendrites were inactivated with the laser microbeam.
MICROSTRUCTURE AND ULTRASTRUCTURE
The above calculations serve as an illustration of the more general principle, that the location of a dendritic arbor determines the other neurones with which a neurone may interact. From a 'developmental' standpoint, a neurone must 'send its branches' to particular locations in the CNS to obtain the appropriate inputs and to deliver the appropriate outputs. Once a dendrite has grown where it is 'supposed' to go, the fine structure of that dendrite must be 'adjusted' to obtain the appropriate synaptic efficacy. The material presented in the next two sections illustrates how the 'microstructure' and 'ultrastructure' of each dendrite can determine the extent to which synaptic input at one point in the cell will influence activity at any other point.
Dendritic microstructure and synaptic efficacy
between the two sites, (5) diameter of the dendrite and (6) the extent of 'side bram ching' between the two sites. Our understanding of these factors could be simply summarized through a consideration of interneurone 10-3. Consider, from a develop-mental standpoint, the dendrite that was the target of the laser-ablation experiments. If our personified neurone 'wanted' to maximize the interaction between synapses on the arborizations in areas A and B, it should grow an interconnecting dendrite B with (1) the shortest and most direct route, (2) the fewest number of side branches, (3) a large diameter, (4) a high membrane resistivity and (5) a low cytoplasmic resistivity. (Here we consider the membrane capacitance to be a constant 'beyond the control' of the neurone.) Any variation from these 'rules' due to other constraints would result in a decrease in the coupling between these two regions.
With all these factors in mind, Wilfrid Rail and one of us recently realized that the dependence of synaptic efficacy upon another important factor had never been systematically investigated (Miller & Rail, 1982). That factor is total dendritic length. How would the amplitude and time course of a PSP change if the length of dendrite distal to the point of synaptic contact were increased? From our developmental per-spective: how would synaptic efficacy be affected by a developmental 'overshoot' of
'Record' Synapse
10
Time (ms)
20 1 1-2 1-4 1-6 1-8 2
[image:10.451.65.381.306.501.2]Total dendritic length (in length constants)
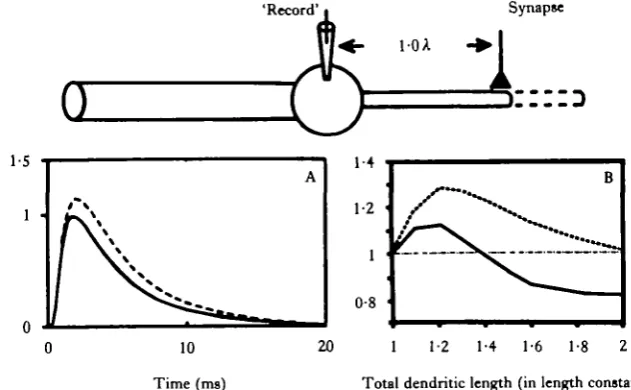
khe target synapse? We expected that as more dendrite was added beyond the point of synaptic contact, more synaptic current would be shunted down this extra tube and out across the extra membrane, resulting in a decrease in synaptic efficacy as measured at the soma. However, for a wide range of parameters, we obtained the opposite result: synaptic efficacy was increased by the addition of extra dendritic membrane. This result is shown in Fig. 6. In part A, the model 'experiment' is shown diagram-matically at the top. We have used a simple 'ball and cylinder' model, with a 'recording electrode' (i.e. calculation point) in the cell body, and a synapse at the tip of the dendritic cylinder. The 'control' EPSP (calculated at the soma) due to the activation of the synaptic conductance change is shown as the solid line in panel A. Next, the dendrite is 'grown' an additional 0-2 of a length constant beyond the synapse, in-dicated by the dashed cylinder. The result now of activating the same synaptic con-ductance change is a somatic EPSP of increased amplitude and duration (dashed curve in Fig. 6A). If the dendrite 'growth' is continued, the somatic PSP begins to decrease in amplitude, until a lower asymptotic value is approached.
These results are shown graphically in Fig. 6B. The solid curve is a plot of peak PSP amplitude at the soma versus total dendritic length, for a synapse one length constant from the soma. The curve drawn with a dotted line is a plot of the total charge imposed on the soma membrane by the PSP versus the dendritic length. (This value is propor-tional to the area under the somatic EPSP, and is perhaps a better measure of synaptic efficacy than the peak amplitude.) Values used to plot each curve were normalized to the initial value for each. (For example, that plotted on the solid curve for a total dendritic length of 1-2 A was obtained by dividing the peak amplitude of the dashed EPSP in panel A by the peak amplitude of the solid EPSP in panel A. The value plotted on the dotted curve in panel B for total L = 1 -2 A was obtained by dividing the area under the dashed EPSP in panel A by the area under the solid EPSP.)
Several aspects of the curves in Fig. 6 deserve special note. First, the seemingly counter-intuitive effect is observed: that the efficacy of a synapse at a fixed location can be augmented by an increase in dendritic length beyond the point of that synaptic contact. For the parameters used here (see legend), that increase in efficacy can be a substantial 10-30%. Secondly, there is an optimum range for the total dendritic length for a synapse at a particular location (i.e. there is a 'hump' in the curves).
Considering the high input impedances of fine dendritic processes, however, suck large amplitude local PSPs are certainly possible. For example, IPSPs can often summate effectively to 'clamp' a dendrite to the inhibitory reversal potential.
If these considerations are added to the list of 'rules' a neurone must 'keep in mind1 when growing dendrites or adjusting its synaptic strengths, several interesting possibilities present themselves. For example, might the B dendrite of the cricket interneurone actually grow beyond its target synapses to optimize those interactions? If so, should we reformulate our 'general principle' of the relationship between struc-ture and function at the macroscopic level, since the overall length and locations of terminal dendritic branches might lie beyond the 'intended' synaptic partners? Definitive answers to these complex speculative questions may be very difficult to obtain. Until we have a better understanding of (1) what cellular parameters are 'controlled' during the development or plastic change in a dendrite, and (2) how 'tightly' those parameters are controlled, we must be conservative in our estimates of the structural 'slop' of any neuronal system.
Dendritic ultrastructure and synaptic efficacy
Although most electro-anatomical studies have concentrated upon the structures at macro- and microscopic levels, one ultrastructural feature of nerve cells that has always attracted a wide interest is the dendritic spine. Dendritic spines are small 'lollipop-like' structures, consisting of an enlarged (sometimes spherical) 'head' at the tip of a thin stalk or 'neck', studding the surface of some dendrites like barbs on a cactus (Chang, 1952; Jacobsen, 1967; Jones & Powell, 1969; Peters & Kaiserman-Abramof, 1970; Ramon y Cajal, 1911; Scheibel & Scheibel, 1968). In most parts of the mammalian CNS, the majority of excitatory synapses are located on the heads of dendritic spines. Spines are also widely observed in many invertebrate preparations including the cricket cereal afferent system. Significant activity-dependent changes in the morphological parameters of spines have been reported in bees and mammalian brain slices (Brandon & Coss, 1982; Coss&Globus, 1978; Fifkova& Anderson, 1981; Fifkova&vanHarreveld, 1977; Lee, Schottler, Oliver & Lynch, 1980). Several severe neuropathologies have been shown to correlate with alterations in the density, distribution or morphology of spines (see, for example, Purpura, 1974).
kf the EPSP might be 'adjusted' to an 'appropriate' value. Two mechanisms by which the spine stem resistance could be decreased are: (1) a decrease in stem length, and (2) an increase in stem diameter. Such considerations have led Crick (1982) to propose that spines may actually 'twitch' over a rapid time course. A temporary muscle-like 'contrac-tion' of the spine stem would lower its resistance, decrease the IX R drop and lead to a temporary increase in synaptic efficacy. However, no such structural or electrical manipulation of a passive spine could ever yield a larger EPSP than one from a synapse placed directly onto the parent dendrite. In other words, a passive spine could, at best, be a 'variable attenuator' of synaptic input, but never an 'amplifier'.
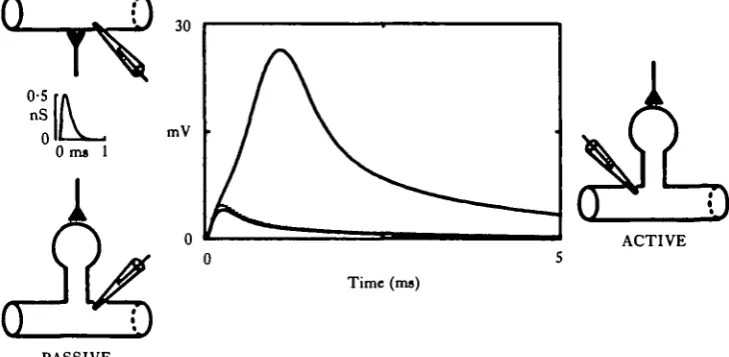
How might this picture change if the spine head had an active instead of a passive membrane? In 1975, Jack et al. performed several calculations to address this question. Based upon steady-state considerations, they suggested that an active spine might actually amplify an EPSP, if the voltage in it were sufficient to bring the membrane above threshold. The regenerative current entering during the 'local' action potential in the spine head might substantially augment the synaptic current, even if the dendrite itself were not capable of generating an action potential. One of us recently participated in a study directed toward a more detailed analysis of active spines (J. P. Miller, W. Rail & J. Rinzel, in preparation). Compartmental computer models were used to calculate the voltage transients that would result from transient conductance changes onto spines with active head membranes. The models used structural parameters for spines within the range of values reported in the literature.
ACTIVE
[image:13.451.43.408.345.523.2]PASSIVE
Fig. 7. Spines with active heads can greatly augment synaptic efficacy. EPSPs were calculated for identical conductance changes on three different structures: a passive dendrite (dotted curve), a passive spine onto an identical dendrite (lower solid curve) and an active spine (upper solid curve). The conductance transient is suprathreshold for action potential generation in the active head, resulting in a substantial augmentation of the current entering the spine. This results in a much enhanced EPSP at the base of the active spine. Parameters used for model calculations were as follows: resting membrane resistivity = 5000 Qcm2, cytoplasmic resistivity = 100 ficm, membrane capacitance = 1 fiF cm"2, dendrite diameter =• 1 fim, dendrite length infinite, spine head diameter — 0-75/an, spine stem resistance = 400 MQ, synaptic conductance transient: time course proportional to ae~m'', a™ SO, T«° 5ms, peak conductance 0'5nS, action potential three variable
model (Rail & Shepherd, 1968): kinetic coefficients: k, = 10s, kz = 6xlO4, k3 = 25, fc, = 0-2, ks= l , kt = 0>01, k
100
mV
[image:14.451.44.414.49.333.2]Time (ms)
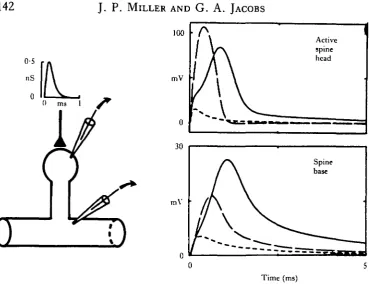
Fig. 8. There is an optimal stem resistance for maximal gynaptic efficacy. The diagram on the left represents the spine model. All structural and electrical parameters of the spine and dendrite except spine stem resistance are as in Fig. 7. Directly above the spine diagram is the time course of the synaptic conductance used for all calculations; peak conductance is OS nS. In each of the two enclosed panels are the voltage transients (EPSPs) corresponding to three different spine stem resistance values. EPSPs corresponding to stem resistance values of 200 MQ, 400 MQ and 800 MQ are represen-ted with short-dashed, solid, and long-dashed lines, respectively. The EPSPs were calcularepresen-ted at two different locations (spine head and spine base) for a spine head with active membrane. Note that the 400MQ stem results in a suprathreshold response for the active head (solid curve, upper right), yielding the largest PSP at the base of the spine (solid curve, lower right). Stems of either higher or lower resistances give lower amplitude EPSPs at the base.
Our results, summarized below, substantiate and extend the earlier results of Jack et
al. (1975), and leave us with the possibility that active 9pines may act as relatively
high-gain synaptic amplifiers. We note that D. Perkel & D. Perkel (in preparation) have addressed the same question using a slightly different approach, and have ob-tained essentially identical results.
•proportional to the area under the EPSP at the spine base) increased more than tenfold, resulting in an EPSP at the spine base that was longer and had a peak amplitude 6-5 times greater. Thus, synaptic efficacy was substantially increased.
Our second question was: how would the efficacy of a synapse onto an active spine depend upon the structural and electrical parameters of the spine? The transient computations (Fig. 8) show the effect of changing the stem resistance of an active spine, when all other parameters were left unchanged. A synaptic conductance change identical to the one used for the previous figure was initiated in the active spine head, and the resulting voltage transients were calculated both at the head and base of the spine. The solid curves in Fig. 8 are the EPSPs calculated for the 'standard' stem resistance. When this was reduced by half, a greatly reduced EPSP was obtained (curves with short dashes). This was because the reduction in stem resistance caused an overall decrease in input resistance at the spine head. The voltage transient in the head due to the conductance change was therefore reduced, and was not great enough to trigger an action potential.
When the stem resistance was doubled, the curves drawn with long dashes were obtained. The peak amplitude of the PSP in the spine head increased, but at the base was much decreased. How can this be? Doubling the stem resistance increased the input resistance of the spine head. This in turn increased the voltage response and caused the membrane to reach threshold earlier. Even though the resulting action potential in the head had a larger peak amplitude, it had a much shorter latency and duration. As a result, much less charge was delivered to the dendrite, and the resulting EPSP there had a smaller amplitude and area.
Any further increase of spine stem resistance would cause further reductions of the EPSP at the spine base, so that a maximal EPSP will occur at an intermediate spine stem resistance. This optimum corresponds to conditions where the spine head depolariza-tion just exceeds threshold, and to an intermediate value of synaptic conductance.
Measurements of the stem resistance in real spines have not been reported in the literature. Estimates of stem resistance based upon reported ranges of stem dimen-sions (assuming a uniform cytoplasmic resistivity) yield values at the low end of the range used in our calculations, that may substantially underestimate the true stem resistance (Wilson, Groves, Kitai & Linder, 1983). A significant proportion of a spine stem may be occluded by extensive cytoskeletal structures and by large membrane-bound vesicles called the spine apparatus (SA) (Fifkova & Delay, 1982; Matus et al. 1982; Tarrant & Routtenberg, 1979; Westrum, Jones, Gray & Barron, 1980). The resistance of such partially occluded stems could certainly fall within the ranges used for these calculations. Furthermore, the resistance of occluded stems would be very sensitive to small changes in diameter of either the SA or the stem itself.
meshwork might significantly alter the effective cytoplasmic resistivity, by directli obstructing the path for current or by changing the local ionic milieu. Assuming uniform cytoplasmic resistivity would lead to the same errors as arise if an 'average diameter' were used for calculations involving dendrites studded with multiple varicosities or constrictions. All of these possibilities have significant functional implications for local interactions, synaptic efficacy and plasticity, and provide an excellent demonstration of the interdependence between neuronal ultrastructure and function.
CLOSING REMARKS
We have examined the relationships between neuronal form and function as if through microscopes of successively higher power: a stereodissecting microscope, for the three dimensional structure of whole cricket neurones, a compound microscope, for synapses onto a single dendrite, and an electron microscope, for the ultrastructure of single dendritic spines. In doing so, we have attempted to show how the application of computer models and new experimental techniques have increased our knowledge in two fundamental ways: (1) we understand several aspects of neuronal integration more quantitatively, and (2) several new insights into neuronal integrative phenomena have been realized.
We acknowledge Wil Rail, John Rinzel and Rod Murphey as collaborators in the original studies and thank Barry Bunow for assistance with development of computer programmes. This work was supported in part by NSF Grant BNS-8202416 and a Sloan Foundation Fellowship to JPM, and NSF Grant BNS-8119799 to R. K. Mur-phey.
R E F E R E N C E S
BACON, J. P. & ALTMAN, J. S. (1977). A silver intensification method for cobalt filled neurons in wholemount preparations. Brain Res. 138, 359—363.
BACON, J. P. & MURPHEY, R. K. (1984). Receptive fields of cricket giant intemeurons are determined by their dendritic structure. J. Physiol., Land, (in press).
BRANDON, J. G. & Coss, R. G. (1982). Rapid dendritic spine stem shortening during one-trial learning: the honeybee's first orientation flight. Brain Res. 252, 51—61.
CHANG, H. T . (1952). Cortical neurons with particular reference to the apical dendrites. Cold Spring Harb.
Symp. quant. Biol. 17, 189-202.
Coss, R. G. & GLOBUS, A. (1978). Spine stems on tectal interneurons in jewel fish are shortened by social stimulation. Science, N.Y. 200, 787-789.
CRICK, F. (1982). Do dendritic spines twitch? Trends Neumsd. 5, 44-46.
DIAMOND, J., GRAY, E. J. & YASARGIL, G. M. (1970). The function of the dendritic spine: an hypothesis. In
Excitatory Synaptic Mechanisms, (eds P. Anderson &J. K. S. Jansen), pp. 213-222. Oslo:
Universitetsfor-laget.
FIFKOVA, E. & ANDERSON, C. L. (1981). Stimulation induced changes in dimensions of stalks of dendritic spines in the dentate molecular layer. Exp. Neural. 74, 621—627.
FIFKOVA, E. & DELAY, R. J. (1982). Cytoplasmic actin in neuronal processes as a possible mediator of synaptic plasticity. J . Cell Biol. 95, 345-350.
FIFKOVA, E. & VANHARREVELD, A. (1977). Long-lasting morphological changes in dendritic spines of dentate granule cells following stimulation of the entorrhinal area. J. Neurocytol. 6, 211—230.
HORWTTZ, B. (1981). Neuronal plasticity: how changes in dendritic architecture can effect the spread of postsynaptic potentials. Brain Res. 224, 412—418.
Neuronal structure and function 145
HACOBSEN, S. (1967). Dimensions of the dendritic spine in the sensorimotor cortex of the rat, cat, squirrel, monkey and man. J. comp. Neurol. 129, 49-58.
JONES, E. G. & POWELL, T . P. S. (1969). Morphological variations in the dendritic spines of the neocortex.
J. Cell Sri. 5, 509-529.
KAWATO, M. & TSUKAHARA, N. (1983). Theoretical study on electrical properties of dendritic spines. J. theor.
Biol. 103, 507-522.
KOCH, C. & Poccio, T . (1983). A theoretical analysis of electrical properties of spines. Proc. R. Soc. B 218, 455-477.
LEE, K. S., SCHOTTLER, F . , OLIVER, M. & LYNCH, G. (1980). Brief bursts of high frequency stimulation produce two types of structural change in rat hippocampus. J . Neuropkysiol. 44, 247-258.
LEVINE, R. B. & MURPHEY, R. K. (1980). Pre- and postsynaptic inhibition of identified giant interneurons in the cricket {Acheta domesticus). J. comp. Physiol. 135, 269-282.
LEV-TOV, A., MILLER, J. P., BURKE, R. E. & RALL, W. (1983). Factors that control amplitude of EPSPs in dendritic neurons. J. Neurophysiol. 50, 399-412.
MATUS, A., ACKERMAN, M., P E H U N G , G., BYERS, H. R. & FUJIWARA, K. (1982). High actin concentrations
in brain dendritic spines and postsynaptic densities. Proc. natn. Acad. Sri. U.SA. 70, 7590—7594. MILLER, J. P. & RALL, W. (1982). Effect of dendritic length upon synaptic efficacy. Neurosri. Abtt. 8, 414. MILLER, J. P. & SELVERSTON, A. I. (1979). Rapid killing of single neurons by irradiation of intracellularly
injected dye. Science, N.Y. 185, 181-183.
MURPHEY, R. K., WALTHALL, W. W. & JACOBS, G. A. (1984). Neurospecificity in the cricket cereal system.
J. exp. Biol. 112, 7-25.
PALKA, J., LEVINE, R. & SCHUBIGER, M. (1977). The cercus-to-giant interneuron system of crickets. I. Some attributes of the sensory cells. J . comp. Physiol. 119, 267-283.
PETERS, A. & KAISERMAN-ABRAMOF, I. R. (1970). The small pyramidal neuron of the rat cerebral cortex. The perikaryon, dendrites and spines. Atn.J. Anat. 127, 321—356.
PTJRPURA, D . P. (1974). Dendritic spine dysgenesis and mental retardation. Science, N.Y. 186, 1126-1128. RALL, W. (1974). Dendritic spines, synaptic potency and neuronal plasticity. In Cellular Mechanisms
Subserv-ing Changes in Neuronal Activity, (eds C. D. Woody, K. A. Brown, T. J. Crow, Jr. & J. D. Knispel), pp.
13-21. Brain Inf. Serv. Res. Rpt. No. 3, UCLA Press.
RALL, W. (1977). Core conductor theory and cable properties of neurons. In Handbook of Physiology. The
Nervous System I, (ed. E. Kandel), pp. 39-97. Bethesda, Md.: American Physiological Society.
RALL, W. (1978). Dendritic spines and synaptic potency. In Studies in Neurophysiology, (ed. R. Porter), pp. 203-209. Cambridge: Cambridge University Press.
RALL, W. & SHEPHERD, G. M. (1968). Theoretical reconstruction of field potentials and dendrodendritic synaptic interactions in olfactory bulb. J. Neurophysiol. 31, 884-915.
RAMON Y CAJAL, S. (1911). Histologie du Syteme Nerveaux de I'Homme et des Vertebres, Vols 1 & 2. Paris: A. Maloine.
REICHERT, H., PLUMMER, M. R. & WINE, J. J. (1983). Identified nonspiking local interneurons mediate non-recurrent, lateral inhibition of crayfish mechanooensory interneurons. J. comp. Physiol. 151, 261-276. RINZEL, J. (1982). Neuronal plasticity (learning). Lectures on Mathematics in the Life Sciences 15, 7—25. SCHEIBEL, M. E. & SCHEIBEL, A. B. (1968). On the nature of dendritic spines — report of a workshop. Communs
Behav.Biol. 1A, 231-265.
SHEPHERD, G. M. & BRAYTON, R. K. (1979). Computer simulation of a dendrodendritic synaptic circuit for self- and lateral-inhibition in the olfactory bulb. Brain. Res. 175, 377-382.
TARRANT, S. B. & ROUTTENBERG, A. (1979). Postsynaptic membrane and spine apparatus: proximity in dendritic spines. Neurosri. Lett. 11, 289-294.
TOBIAS, M. & MURPHEY, R. K. (1979). The response of cereal receptors and identified interneurons in the cricket (Acheta domesticus) to air streams. J. comp. Physiol. 129, 51—59.
TURNER, D. A. & SCHWARTZKROIN, P. A. (1983). Electrical characteristics of dendrites and dendritic spines in intracellularly stained CA3 and dentate hippocampal neurons, jf. Neurosri. 3, 2381-2394.
WESTRUM, L. E., JONES, H. D., GRAY, E. G. & BARRON, J. (1980). Microtubules, dendritic spines and spine apparatuses. Cell Tiss. Res. 208, 171-181.