Brain Atrophy in Mild or Moderate
Traumatic Brain Injury: A Longitudinal
Quantitative Analysis
John D. MacKenzie, Faez Siddiqi, James S. Babb, Linda J. Bagley, Lois J. Mannon, Grant P. Sinson, and Robert I. Grossman
BACKGROUND AND PURPOSE:Although mild or moderate traumatic brain injury (TBI) is known to cause persistent neurologic sequelae, the underlying structural changes remain elusive. Our purpose was to assess decreases in the volume of brain parenchyma (VBP) in patients with TBI and to determine if clinical parameters are predictors of the extent of atrophy. METHODS:We retrospectively assessed the total VBP in 14 patients with mild or moderate TBI at more than 3 months after injury and in seven patients at two time points more than 3 months apart. VBP was calculated from whole-brain MR images and then normalized by calculating the percent VBP (%VBP) to correct for intraindividual variations in cranial size. Clinical parameters at the time of trauma were evaluated for potential predictors of atrophy. Findings were compared with those of control subjects of similar ages.
RESULTS: In the single time-point analysis, brain volumes, CSF volumes, and %VBP were not significantly different between patients and control subjects. In the longitudinal analysis, the rate of decline in %VBP (0.02 versus 0.0064 U/day, P ⴝ .05) and the change in %VBP between the first and second time points (ⴚ4.16 ⴞ1.68 versusⴚ1.49ⴞ 1.7,P ⴝ.022 [mean
ⴞSD]) were significantly greater in patients. Change in %VBP was significantly greater in patients with loss of consciousness (LOC) than in those without LOC (Pⴝ .023).
CONCLUSION:Whole-brain atrophy occurs after mild or moderate TBI and is evident at an average of 11 months after trauma. Injury that produces LOC leads to more atrophy. These findings may help elucidate an etiology for the persistent or new neurologic deficits that occur months after injury.
Traumatic brain injury (TBI) is a major cause of morbidity and mortality, particularly in individuals aged 15–24 years or in those older than 75 years (1). The incidence is approximately 175–200 cases per 100,000 population (2). The clinical deficits produced by TBI range from the almost imperceptible to a persistent vegetative state. A number of classification systems have been developed; these classify TBI as mild, moderate, or severe (3–6).
Persistent neurologic problems are present in 10% and 67% of patients with mild and moderate TBI, respectively (7, 8), but these figures may substantially
underestimate the long-term effects of mild or mod-erate injury (4, 9, 10). TBI accounts for 2% of all deaths per year in the United States, and most emer-gency room visits for TBI (27 of 33 patient encounters for TBI) (2) involve mild injuries that do not require hospital admission. Weeks to months later, these pa-tients with mild or moderate brain injury often return to the clinic, complaining of neurologic and psycho-logical symptoms associated with the original head trauma. Although the correlation of TBI with these persistent deficits is controversial, growing evidence suggests that even mild injury may have greater con-sequences than formerly assumed (10, 11).
Previous volumetric imaging studies have demon-strated the presence of brain atrophy after TBI. How-ever, many of these studies were concerned with ei-ther regional changes in brain or CSF volume (12–17) or whole-brain volume changes after severe TBI (18). Hofman et al (19) described a loss of total brain volume after mild TBI and examined its potential relationships with neurocognitive outcome. We set out to further characterize changes in total brain Received January 16, 2002; accepted after revision June 14.
From the Department of Radiology (J.D.M., F.S., L.J.B., L.J.M., R.I.G.) and Neurosurgery (G.P.S.) University of Pennsylvania Medical, Center, and Fox Chase Cancer Center (J.S.B.), Philadel-phia, PA.
Supported by grant RO1 NS 391-3501.
Address reprint requests to Robert I. Grossman, MD, New York University School of Medicine, Department of Radiology, 550 First Street, HW-209, New York, NY 10016.
©American Society of Neuroradiology
volume in mild or moderate TBI by using a validated quantification method. We also examined some of the potential clinical predictors of volume change.
Methods
Patient and Control Populations
We considered patients who had had a closed head injury (nonmissile TBI) for inclusion in the study by searching the electronic dictation report archives for all head MR imaging examinations performed during 6 years at a large tertiary care center. Inclusion criteria were as follows: 1) mild to moderate closed head injury; 2) no known history or imaging result of CNS disease unrelated to the trauma; 3) area of CNS bleeding, contusion, or infarction smaller than 2.5 cm; 4) patient aged 18 years or older; 5) intrapatient serial MR imaging examinations performed more than 3 months apart (for those in the longi-tudinal analysis); 6) MR imaging examination performed more than 3 months after injury (for those in the single time-point analysis); and 7) availability of fast spin-echo MR images.
Mild head trauma was classified according to the definition developed by the Mild Traumatic Brain Injury Interdisciplinary Special Interest Group of the American Congress of Rehabil-itation Medicine (reviewed by Esselman et al [20]). The defi-nition includes manifestations of at least one of the following: 1) any loss of consciousness (LOC); 2) amnesia involving the events immediately before or after the injury; 3) any alteration in mental state at the time of injury; and 4) focal neurologic deficits. The injury must also have resulted in LOC of less than 30 minutes, an initial Glasgow Coma Scale (GCS) score of 13–15, and posttraumatic amnesia of less than 24 hours. We defined moderate head trauma with criteria similar to those of mild TBI but with a GCS score of 9–12. Eleven patients met the criteria for mild TBI, and three met the criteria for mod-erate TBI. Of these three, two had initial GCS scores of 7 and 8, which were prorated to 9–12, because the cause for their GCS was not a primary CNS process. The respiratory component of their GCS score could not be assessed, because they had been intubated in the field as a result of an airway obstruction, or they could not open eyes because of periorbital edema (21). The traumatic injuries that affected the initial GCS score and that were responsible for lesions outside the CNS resolved after appropriate medical management. Causes of brain injury included motor ve-hicle accidents (n⫽5), blunt impacts (n⫽2), falls (n⫽2), a motorcycle crash (n⫽1), a bicycle crash (n⫽1), a bicycle-car collision (n⫽1), a pedestrian-car collision (n⫽1), and unknown (n⫽1). Six patients had a brief (⬍30 minutes) LOC immediately after the injury, and eight had postconcussive symptoms for longer than 3 months after the trauma. Eight of the patients had a work or education history before the trauma that was documented in the medical record as follows: lawyer (n⫽1), elementary school teacher (n⫽1), construction foreman (n⫽1), nurse (n⫽1), unemployed (n ⫽ 1), college professor (n ⫽ 1), and college student (n⫽2).
Patients with CNS disease not resulting from the initial trauma and those who had undergone intracranial surgical intervention were excluded. Patients with large intracranial hemorrhages (⬎2.5 cm in diameter) were also excluded, be-cause extravasated blood replaces CSF, and an underestimated CSF volume would have resulted in a falsely large percent-volume of brain parenchyma (%VBP) (see calculation of vol-ume of brain parenchyma [VBP] below). The spectrum of MR findings resulting from the TBI included no detectable imaging abnormality (five patients), signal intensity changes in the brain parenchyma consistent with diffuse axonal injury (n⫽6), and a combination of small extraaxial hemorrhage plus diffuse axonal injury (n⫽3).
Emergency room admission, ward, and clinic charts were reviewed for pertinent information, including the initial GCS score, amnesia, LOC, hospital course, results of CNS imaging
studies, and eventual CNS functional outcome. The outcome was rated on a scale of 0–3, in which 0 indicated no neurologic deficits; 1, persistent postconcussive symptoms; 2, mild neuro-logic deficits; and 3, severe neuroneuro-logic deficits. Among the 10 trauma patients with known outcomes, the distribution was as follows: no neurologic deficits (n⫽2), postconcussive neuro-logic deficits (n ⫽5), mild neurologic deficits (n ⫽3), and severe neurologic deficits (n⫽0).
Two control populations with an age distribution similar to that of the patients were examined separately: 10 subjects underwent one MR imaging session, and four of the 10 under-went two sessions more than 3 months apart.
Written informed consent was obtained from each patient or control subject for the MR imaging examinations. A neurora-diologist (L.J.B. or R.I.G.) reviewed the control MR images to verify that no confounding lesions were present. Although no formal neuropsychological testing was performed, the volun-teers stated that they were free of prior CNS injury that caused LOC and any disease affecting the nervous system, including dementia, psychiatric illness, demyelinating disease, and alco-hol or drug dependency.
Image Acquisition
Imaging was performed on a 1.5-T unit (Signa; GE Medical Systems, Milwaukee, WI) with a quadrature transceiver-re-ceiver head coil. With the patient or control subject in the supine position, whole-brain dual fast spin-echo images (TR/ TE, 2700/16 and 80; echo train length, eight) were obtained with a 22-cm field of view (FOV), a 256 ⫻192 acquisition matrix, and an axial section thickness of 3 or 5 mm (contiguous, interleaved sections) from the base of the skull to vertex. Images were interpolated to a 256 ⫻256 matrix, converted from a proprietary GE imaging format on the machine to the Digital Imaging and Communications in Medicine (DICOM) (available atwww.medical.nema.org/dicom.html) on the picture archiving and communications system of our department. The images were then transferred offsite to an Ultra 60 workstation (Sun Microsystems, Mountain View, CA) for analysis with 3DVIEWNIX software version 1.1.1.
Volumetric Image Analysis
FOV (in square centimeters)]/[matrix size⫻section thickness]. To normalize variations in cranial size among subjects, the %VBP was calculated, and used for comparison, as follows: %VBP ⫽ VBP/(VBP ⫹ CSF volume) (26). The change in %VBP was calculated by subtracting the second %VBP mea-surement from the first.
Statistical Analysis
An analysis of covariance was performed to compare results in patients with those in control subjects and to compare results in patients with LOC with those without LOC. The %VPB, CSF volume, and brain volume were compared after we ad-justed for the potential confounding effects of age, sex, and differences in the time between MR imaging examinations. The associations between GCS scores and measures of atrophy (%VBP and change in %VBP) were assessed by using Spear-man rank correlation coefficients. Patients with different out-comes were compared with respect to measures of atrophy by using a Kruskal-Wallis test and with respect to the GCS score (grouped as less than 15 or equal to 15) by using the Fisher exact test. To analyze the relationships between clinical param-eters and volumetric measurements, %VBP values were ob-tained from the single time-point group and values for the change in %VBP were obtained from the longitudinal group. The magnitudes and rates of change in %VBP were verified by means of a permutation test (Fisher randomization test) to ensure that the analysis of covariance (ANCOVA) results were robust against violations of the assumptions underlying the ANCOVA analysis.
Results
Single Time-Point Analysis
The data from the second time point of the longi-tudinal study were combined with data from patients
with only one MR imaging study after TBI (Table 1). The patients and control subjects were not signifi-cantly different with respect to age. The mean patient age at time of injury was 36.1 years (range, 20–59 years; SD, 12.3 years), and the mean time between the head injury and the date of first observation was 418 days (range, 7 days to 4.52 years). The patients and control subjects did not significantly differ with re-spect to the rate of age-related decrease in brain volume (P ⫽ .87). No significant difference was de-tected in the CSF volume (P⫽.98) and %VBP (P⫽ .92) between trauma patients and control subjects.
Longitudinal Analysis
For the seven patients with head injury and multi-ple studies (Table 2), the mean age at the time of injury was 34.2 years (range, 20–59 years; SD, 15.2 years). ANCOVA revealed no significant age differ-ence between the patients and control subjects (P⫽ .81). The trauma group had only one female patient. The mean time between head injury and the date of first observation was 125 days (range, 7–430 days), and mean time between the first and second MR imaging examinations was 350 days (range, 107 days to 2.5 years). Examples of the visible qualitative changes over time in patients with moderate TBI are shown in the Figure.
[image:3.587.53.534.75.153.2]The change in brain volume over time was not significantly associated with age (P⫽ .17). Although the patients and control subjects were not signifi-cantly different with respect to the total loss of brain volume (P ⫽ .11), the rate of the decrease in brain
TABLE 1: Single Time-Point Analysis
Measure All Subjects (n⫽24) Patients with TBI (n⫽14) Control Subjects (n⫽10)
Mean Median SD Mean Median SD Mean Median SD
Age (y) 35.6 35.3 10.2 36.1 33.4 12.1 34.9 36.9 7.1
%VBP* 86.3 87.0 3.8 86.2 87.2 4.3 86.4 86.5 3.2
CSF (cm3) 199.5 199.0 62.7 199.5 195.2 71.7 199.6 200.3 51.1
VBP (cm3) 1248.0 1229.6 127.5 1234.4 1207.1 140.2 1267.0 1282.3 111.7
* %VBP⫽VBP/(VBP⫹CSF volume).
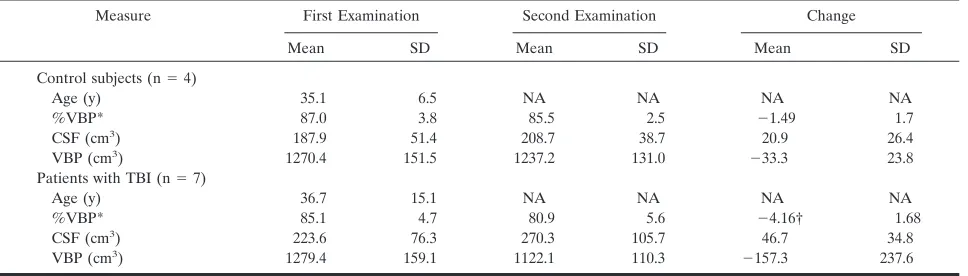
TABLE 2: Longitudinal Analysis
Measure First Examination Second Examination Change
Mean SD Mean SD Mean SD
Control subjects (n⫽4)
Age (y) 35.1 6.5 NA NA NA NA
%VBP* 87.0 3.8 85.5 2.5 ⫺1.49 1.7
CSF (cm3) 187.9 51.4 208.7 38.7 20.9 26.4
VBP (cm3) 1270.4 151.5 1237.2 131.0 ⫺33.3 23.8
Patients with TBI (n⫽7)
Age (y) 36.7 15.1 NA NA NA NA
%VBP* 85.1 4.7 80.9 5.6 ⫺4.16† 1.68
CSF (cm3) 223.6 76.3 270.3 105.7 46.7 34.8
VBP (cm3) 1279.4 159.1 1122.1 110.3 ⫺157.3 237.6
Note.—NA indicates not applicable. * %VBP⫽VBP/(VBP⫹CSF volume).
[image:3.587.54.538.192.330.2]volume was significantly greater in the patients with trauma (P⫽.031). Specifically, the trauma group lost an average of 0.528 cm3/d, whereas the control sub-jects lost 0.106 cm3/d. The change in CSF volume over time was not significantly associated with age (P⫽.57). The trauma patients and control subjects were not sig-nificantly different with respect to either the total change in CSF volume (P ⫽ .10) or the daily rate of change in CSF volume (P⫽.11). The change in %VBP was not significantly associated with age (P⫽.47).
Relative to the control subjects, the trauma group had a significantly greater loss in %VPB (P⫽ .022). The rate of decline in VBP was also significantly greater (P ⫽ .05) in the trauma group; the trauma group lost an average of 0.02 U/d of %VBP, whereas the control subjects lost an average 0.0064 U/d. Ver-ification of these results by means of a permutation test demonstrated that both the magnitude and rate of change in %VBP were significantly different in patients and control subjects (P ⫽ .016 and 0.047, respectively).
Analysis of Correlation
The relationship of GCS score in association with either %VBP or change in %VBP, as assessed with
Spearman rank correlation coefficients, was not sig-nificantly different, with correlations of 0.35 and 0.28, respectively, and P values of .24 and 0.59, respec-tively. The Kruskal-Wallis test revealed that the dif-ferences between outcome categories and either %VBP or change in %VBP were not significantly different, withPvalues of .249 and .501, respectively. In the comparison of GCS score with outcome, GCS scores were grouped (recoded) as either lower than 15 or equal to 15. The Fisher exact test revealed a statistically significant association (P⫽.024) between GCS (recoded) and outcome. Least-squares regres-sion was performed to determine whether the binary variable LOC and either %VBP or change in %VBP were associated after adjustments were made for dif-ferences in the following: 1) the patients’ ages at the first examination; 2) days from trauma; and 3) time between %VBP measurements. After we adjusted for covariates, no significant association between LOC and %VBP was observed. However, LOC was signif-icantly associated with the change in %VBP (P ⫽ .023), once adjustments were made for age. The equa-tion to predict the change in %VBP was as follows: change in %VBP ⫽ ⫺11.055 ⫹ (0.1516 ⫻ age) ⫹ (2.46⫻ LOC).
FIG 1. Visible atrophic changes after moderate TBI.
Discussion
Predicting the association between TBI and prema-ture loss of brain parenchyma is important in deter-mining the most worrisome injuries and the injuries that should be classified according priority (if a neu-roprotective strategy is available). Blatter et al (18) demonstrated a high to moderate correlation be-tween atrophy and cognitive outcome, and regional hippocampal volume decreases are correlated with decreased verbal memory function (14). Our data suggest that trauma associated with LOC results in a greater reduction in brain volume than trauma with-out LOC. In comparing patients of the same age, the reduction in %VBP between the first and second measurements of brain volume was 2.46 U higher in patients with LOC.
In this study of patients with mild or moderate TBI, the loss of brain parenchyma was 2.8 times greater (4.2% versus 1.5% change in %VBP) and the rate of %VBP loss was greater for the group with TBI than the control subjects. These results are consistent with the results of volumetric studies that demonstrate regional (12–17, 27) and whole-brain atrophy in mild (19) and moderate to severe TBI (18).
Our method of volume computation is highly reli-able and consistent. For the estimation involving le-sions in multiple sclerosis, the inter- and intraopera-tor coefficient of variation is 0.9%, with a confidence interval of 0–2.8% (25). The extremely high precision of the segmentation method has also been previously demonstrated (median coefficient of variation of 0.23% for VBP and 0.45% for CSF volume) by using our method and intrapatient repeat images obtained with a 3-mm section thickness (28). Similarly high precision has been found with intrapatient repeat images, in which one image was obtained with a 3-mm section thickness and the other was obtained with a 5-mm section thickness (Ge, personal communica-tion, June 2000). Blatter et al (29) also showed no statistically significant differences between the mea-surements of total brain volumes and CSF volumes by using standard spin-echo and fast spin-echo se-quences.
Regarding the longitudinal analysis, a number of factors make our results more conservative, because the study resulted in either an overemphasis of the %VBP for the control group or an underemphasis of the change in %VBP in the trauma group. In the longitudinal analysis, the interval between the first and second examinations was greater in the control group than in the trauma group (471 versus 280 days). Furthermore, the rate of parenchymal brain loss in the control group was greater (2.19% versus 0.265% per year) than that of a previously published analysis of age-based brain volumes in healthy subjects (18, 29). These differences may be accounted for, in part, by the small control sizes (n⫽10 and 4). Our results showed a lack of correlation between GCS score and either %VBP or change in %VBP, except when GCS score was divided into GCS scores of 15 and those less than 15. This observation suggests that GCS score
may be a poor predictor of the extent of atrophy in mild or moderate TBI. We hypothesize that future work may show that atrophy is a more specific pre-dictor of outcome than is GCS score in cases of mild or moderate TBI.
Because of the study design, a certain amount of caution must be exercised in generalizing statements about the role of atrophy in the general population of patients with mild or moderate TBI. Our patient population was retrospectively identified, and many of the selected patients had a postconcussive syn-drome that necessitated diagnostic workup with MR imaging. Because hemorrhage replaces CSF, and be-cause it would subsequently have be-caused a falsely large change in the %VBP, patients with intracranial hemorrhages with a diameter greater than 2.5 cm were not considered in the analysis. In addition, the software used to compute the brain volume relied on specific MR imaging protocols (ie, fast spin-echo se-quences) that were not performed in all head trauma patients who were examined with MR imaging. Pro-spective studies with a standardized MR imaging pro-tocol are required to remove these selection biases and validate our results. The small control and pa-tient populations may account for the observed lack of significance in the differences in brain volume and %VBP in the single time-point analysis. The finding of no significant change in VBP but a significant change in %VBP in the longitudinal group may em-phasize the need to normalize (with the %VBP cal-culation) for variations in cranial size. Also, the lon-gitudinal group had a proportionately greater number of men than women. Although a previous volumetric study demonstrated no significant differences in the VBP once sex-specific differences in total intracranial volume were corrected (29), as yet unknown sex-specific differences in response to head trauma may exist. Lastly, because of the small sample size, the observations should be viewed as preliminary.
Nevertheless, our study presents a number of in-teresting questions when placed in context with the current literature related to TBI. In general, recovery from a mild concussion appears to progress gradually over 3 months, with the greatest impairment occur-ring within the first several weeks (30). However, evidence from both clinical and basic science investi-gations suggests that TBI can result not only in per-sistent or long-term neurologic deficit but also con-tinued decay months to years after the original trauma. In an assessment of recovery and outcomes 5 years after TBI (31), 8% of patients reported that they felt their condition had deteriorated. In a sepa-rate prospective study of whiplash injury (5), 15% reported the onset of new symptoms 3 months after trauma. Minor head injury has been reported to cause new postconcussive symptoms, which were initially absent at clinical examination, within 6 weeks after the trauma (9). These symptoms continue at least 1 year after the concussion, and malingering or litiga-tion concerning the source of injury unlikely to ac-count for these symptoms.
imaging reveal CNS abnormalities that are undetect-able with conventional MR imaging methods. These findings suggest a structural basis for chronic postcon-cussive syndrome (32–34). Atrophy could be the ulti-mate consequence of these MT imaging patterns, and a variety of mechanisms that promote global brain atrophy, beyond trauma-induced necrosis, are cur-rently being elucidated (18, 35–39). The brains of patients with TBI have histopathologic features of Alzheimer disease, and patients with TBI are more likely to develop Alzheimer disease, of which one component is brain atrophy (40–42). One study has demonstrated the synergistic effect of head trauma and the presence of a particular apolipoprotein allele in patients with Alzheimer disease (43).
Mounting evidence in experimental models, as well as in humans, also suggests that apoptosis occurs (35, 38, 39, 43, 44) and continues months after the initial neuronal insult. A prolonged phase of neurodegenera-tion has been demonstrated as long as 1 year after injury (35–38), in addition to the neuronal damage and cell loss that occurs within hours of the initial trauma (45– 47). A neurodegenerative or apoptotic process would be a particularly appealing explanation as the pathophysi-ologic basis of the chronic course of TBI and may suggest avenues of therapeutic intervention. Our data are consistent with this hypothesis, which suggests that TBI results in chronic degeneration.
Conclusion
Our data provide evidence that brain volume de-creases after mild or moderate brain injury, presum-ably as a result of cellular loss, and that patients with LOC have a greater loss in volume. However, the biologic reasons for and the clinical consequences of this atrophy remain to be defined. The measurement of neuronal loss with proton spectroscopy, whole-brain N-acetylaspartate methods (14, 48, 49), neuro-psychological assessment, and the tracking of clinical markers over months to years after injury could pro-vide valuable clues to the consequences of atrophy in mild or moderate TBI. We believe that the effects of mild or moderate TBI occur over an extended period and that the associated parenchymal loss is more common than previously appreciated. The conse-quences of this parenchymal loss are still undeter-mined and must be viewed as being detrimental to neuropsychological function.
References
1. Sosin DM, Sacks JJ, Smith SM.Head injury-associated deaths in the United States from 1979 to 1986.JAMA1989;262:2251–2255 2. Kraus JF, McArthur DL.Epidemiologic aspects of brain injury.
Neurol Clin1996;14:435–450
3. Becker DP, Grossman RG, McLaurin RL, Caveness WF. Head injuries–panel 3.Arch Neurol1979;36:750–758
4. Cox WS, Grubb RL.Central nervous system trauma.In: Eliasson SG, Prensky AL, Hardin WB, eds. Neurological Pathophysiology. New York: Oxford University; 1978
5. Ettlin TM, Kischka U, Reichmann S, Radii EW, Heim S, Wengen D, Benson DF.Cerebral symptoms after whiplash injury of the neck: a prospective clinical and neuropsychological study of whip-lash injury.J Neurol Neurosurg Psychiatry1992;55:943–948
6. Jennet B, Teasdale G.Management of Head Injuries.Philadelphia: Davis; 1981
7. Kraus J. Epidemiology of head injury. In: Cooper P, ed.Head Injury.Baltimore: Williams and Wilkins; 1987:1–19
8. Sorenson S, Kraus J.Occurrence, severity and outcomes of brain injury.J Head Trauma Rehabil1991;6:1–10
9. Rutherford WH, Merrett JD, McDonald JR.Symptoms at one year following concussion from minor head injuries.Injury1979;10:225– 230
10. Barth JT, Macciocchi SN, Giordani B, Rimel R, Jane JA, Boll TJ. Neuropsychological sequelae of minor head injury. Neurosurgery 1983;13:529–533
11. McAllister TW.Neuropsychiatric sequelae of head injuries. Psy-chiatr Clin North Am1992;15:395–413
12. Arciniegas DB, Topkoff JL, Rojas DC, et al.Reduced hippocampal volume in association with p50 nonsuppression following trau-matic brain injury.J Neuropsychiatry Clin Neurosci2001;13:213–221 13. Anderson CV, Wood DM, Bigler ED, Blatter DD.Lesion volume, injury severity, and thalamic integrity following head injury.J Neu-rotrauma1996;13:59–65
14. Bigler ED, Blatter DD, Anderson CV, et al.Hippocampal volume in normal aging and traumatic brain injury.AJNR Am J Neurora-diol1997;18:11–23
15. Bigler ED.Quantitative magnetic resonance imaging in traumatic brain injury.J Head Trauma Rehabil2001;16:117–134
16. Cullum CM, Bigler ED. Ventricle size, cortical atrophy and the relationship with neuropsychological status in closed head injury: a quantitative analysis.J Clin Exp Neuropsychol1986;8:437–452 17. Gale SD, Johnson SC, Bigler ED, Blatter DD.Nonspecific white
matter degeneration following traumatic brain injury.J Intl Neu-ropsychol Soc1995;1:17–28
18. Blatter DD, Bigler ED, Gale SD, et al. MR-based brain and cerebrospinal fluid measurement after traumatic brain injury: cor-relation with neuropsychological outcome.AJNR Am J Neuroradiol 1997;18:1–10
19. Hofman PA, Stapert SZ, van Kroonenburgh MJ, Jolles J, de Kruijk J, Wilmink JT.MR imaging, single-photon emission CT, and neu-rocognitive performance after mild traumatic brain injury.AJNR Am J Neuroradiol2001;22:441–449
20. Esselman PC, Uomoto JM.Classification of the spectrum of mild traumatic brain injury.Brain Injury1995;9:417–424
21. Gale JL, Dikmen S, Wyler A, Temkin N, McLean A.Head injury in the Pacific Northwest.Neurosurgery1983;12:487–491
22. Udupa JK, Odhner D, Samarasekera S, et al. 3DVIEWNIX: An open, transportable, multidimensional multimodality, multipara-metric imaging software system.SPIE Proc1994;2164:58–73 23. Udupa JK, Samarasekera S.Fuzzy connectedness and object
defi-nition: theory, algorithms and applications in image segmentation. Graph Models Image Processing1996;58:246–261
24. Udupa JK, Wei L, Samarasekera S, Miki Y, van Buchem MA, Grossman RI.Detection and quantification of MS lesions using fuzzy topological principles.Proc SPIE1996;2710:81–91 25. Udupa JK, Wei L, Samarasekera S, Miki Y, van Buchem MA,
Grossman RI.Multiple sclerosis lesion quantification using fuzzy-connectedness principles.IEEE Trans Med Imaging1997;16:598– 609
26. Phillips MD, Grossman RI, Miki Y, et al.Comparison of T2 lesion volume and magnetization transfer ratio histogram analysis and of atrophy and measures of lesion burden in patients with multiple sclerosis.AJNR Am J Neuroradiol1998;19:1055–1060
27. Anderson CV, Bigler ED, Blatter DD.Frontal lobe lesions, diffuse damage, and neuropsychological functioning in traumatic brain-injured patients.J Clin Exp Neuropsychol1995;17:900–908 28. Ge Y, Grossman RI, Udupa JK, et al.Brain atrophy in
relapsing-remitting multiple sclerosis and secondary progressive multiple sclerosis: longitudinal quantitative analysis. Radiology2000;214: 665–670
29. Blatter DD, Bigler ED, Gale SD, et al. Quantitative volumetric analysis of brain MR: normative database spanning 5 decades of life.AJNR Am J Neuroradiol1995;16:241–251
30. Hugenholtz H, Stuss DT, Stethem LL, Richard MT.How long does it take to recover from a mild concussion?Neurosurgery1988;22: 853–858
31. Hillier SL, Sharpe MH, Metzer J.Outcomes 5 years post-traumatic brain injury (with further reference to neurophysical impairment and disability).Brain Injury1997;11:661–675
32. Bagley LJ, McGowan JC, Grossman RI, et al.Magnetization trans-fer imaging of traumatic brain injury.J Magn Reson Imaging2000; 11:1–8
imaging in the detection of injury associated with mild head trauma.AJNR Am J Neuroradiol2000;21:875–880
34. Sinson G, Bagley LJ, Cecil KM, et al. Magnetization transfer imaging and proton MR spectroscopy in the evaluation of axonal injury: correlation with clinical outcome after traumatic brain injury.AJNR Am J Neuroradiol2001;22:143–151
35. Colicos MA, Dixon CE, Dash PK. Delayed, selective neuronal death following experimental cortical impact injury in rats: possi-ble role in memory deficits.Brain Res1996;739:111–119 36. Bramlett HM, Dietrich WD, Green EJ, Busto R. Chronic
his-topathological consequences of fluid-percussion brain injury in rats: effects of post-traumatic hypothermia. Acta Neuropathol (Berl)1997;93:190–199
37. Povlishock JT, Erb DE, Astruc J.Axonal response to traumatic brain injury: reactive axonal change, deafferentation, and neuro-plasticity.J Neurotrauma1992;9(suppl 1):S189–S200
38. Smith DH, Chen XH, Pierce JE, et al.Progressive atrophy and neuron death for one year following brain trauma in the rat. J Neurotrauma1997;14:715–727
39. Fox GB, Fan L, Levasseur RA, Faden AI.Sustained sensory/motor and cognitive deficits with neuronal apoptosis following controlled cortical impact brain injury in the mouse.J Neurotrauma1998;15: 599–614
40. Coria F, Rubio I, Bayon C.Alzheimer’s disease, beta-amyloidosis, and aging.Rev Neurosci1994;5:275–292
41. Gedye A, Beattie BL, Tuokko H, Horton A, Korsarek E.Severe head injury hastens age of onset of Alzheimer’s disease. J Am Geriatr Soc1989;37:970–973
42. Graves AB, White E, Koepsell TD, et al.The association between head trauma and Alzheimer’s disease.Am J Epidemiol1990;131: 491–501
43. Mayeux R, Ottman R, Maestre G, et al. Synergistic effects of traumatic head injury and apolipoprotein-epsilon 4 in patients with Alzheimer’s disease.Neurology1995:45:555–557
44. Sinson G, Perri BR, Trojanowski JQ, Flamm ES, McIntosh TK. Improvement of cognitive deficits and decreased cholinergic neu-ronal cell loss and apoptotic cell death following neurotrophin infusion after experimental traumatic brain injury.J Neurosurg 1997;86:511–518
45. Adams JH, Doyle D, Ford I, Gennarelli TA, Graham DI, McLellan DR.Diffuse axonal injury in head injury: definition, diagnosis and grading.Histopathology1989;15:49–59
46. Dietrich WD, Alonso O, Halley M.Early microvascular and neu-ronal consequences of traumatic brain injury: a light and electron microscopic study in rats.J Neurotrauma1994;11:289–301 47. Soares HD, Hicks RR, Smith D, McIntosh TK. Inflammatory
leukocytic recruitment and diffuse neuronal degeneration are sep-arate pathological processes resulting from traumatic brain injury. J Neurosci1995;15:8223–8233
48. Gonen O, Viswanathan AK, Catalaa I, Babb J, Udupa J, Grossman RI.Total brain N-acetylaspartate concentration in normal, age-grouped females: quantitation with non-echo proton NMR spec-troscopy.Magn Reson Med1998;40:684–689