go.warwick.ac.uk/lib-publications
Original citation:
Klaise, Janis and Johnson, Samuel. (2016) From neurons to epidemics : how trophic
coherence affects spreading processes. Chaos: An Interdisciplinary Journal of Nonlinear
Science, 26 (6). 065310.
Permanent WRAP URL:
http://wrap.warwick.ac.uk/80753
Copyright and reuse:
The Warwick Research Archive Portal (WRAP) makes this work by researchers of the
University of Warwick available open access under the following conditions. Copyright ©
and all moral rights to the version of the paper presented here belong to the individual
author(s) and/or other copyright owners. To the extent reasonable and practicable the
material made available in WRAP has been checked for eligibility before being made
available.
Copies of full items can be used for personal research or study, educational, or not-for profit
purposes without prior permission or charge. Provided that the authors, title and full
bibliographic details are credited, a hyperlink and/or URL is given for the original metadata
page and the content is not changed in any way.
Publisher’s statement:
The following article appeared in Klaise, Janis and Johnson, Samuel. (2016) From neurons to
epidemics : how trophic coherence affects spreading processes. Chaos: An Interdisciplinary
Journal of Nonlinear Science, 26 (6). 065310.and may be found at
http://dx.doi.org/10.1063/1.4953160
A note on versions:
The version presented here may differ from the published version or, version of record, if
you wish to cite this item you are advised to consult the publisher’s version.
arXiv:1603.00670v2 [physics.soc-ph] 21 Jul 2016
Janis Klaise1 and Samuel Johnson1, 2,a)
1)Centre for Complexity Science, University of Warwick, Coventry CV4 7AL,
United Kingdom.
2)Warwick Mathematics Institute, University of Warwick, Coventry CV4 7AL,
United Kingdom.
Trophic coherence, a measure of the extent to which the nodes of a directed network are organised in levels, has recently been shown to be closely related to many structural and dynamical aspects of complex systems, including graph eigenspectra, the prevalence or absence of feedback cycles, and linear stability. Furthermore, non-trivial trophic structures have been observed in networks of neurons, species, genes, metabolites, cellular signalling, concatenated words, P2P users, and world trade. Here we consider two simple yet apparently quite different dynamical models – one a Susceptible-Infected-Susceptible (SIS) epidemic model adapted to include complex contagion, the other an Amari-Hopfield neural network – and show that in both cases the related spreading processes are modulated in similar ways by the trophic coherence of the underlying networks. To do this, we propose a network assembly model which can generate structures with tunable trophic coherence, limiting in either perfectly stratified networks or random graphs. We find that trophic coherence can exert a qualitative change in spreading behaviour, determining whether a pulse of activity will percolate through the entire network or remain confined to a subset of nodes, and whether such activity will quickly die out or endure indefinitely. These results could be important for our understanding of phenomena such as epidemics, rumours, shocks to ecosystems, neuronal avalanches, and many other spreading processes.
PACS numbers: 89.75.Fb, 87.18.-h, 64.60.ah, 84.35.+i, 87.23.-n
A great many processes involve some kind of ac-tivity travelling through a complex system: a ru-mour or contagious disease in society, waves of action potentials between neurons, cascades of defaults in a banking system, or species under stress in an ecosystem, for instance. It is well-known that food webs – or networks of predation – have a trophic structure, a hierarchy of plants, herbivores, omnivores, primary carnivores, and so on up to top predators, defined by how many steps separate each species from the source of en-ergy. It has recently been shown that “trophic coherence”, a measure of how neatly these nodes fall into distinct layers, is key to understand-ing many structural and dynamical features not just of food webs, but of a range of biological and artificial networks. In light of these observa-tions, we now study how trophic coherence affects spreading processes, and find that it plays an im-portant role. Our results suggest, for example, that whether a contagious disease will become en-demic, or whether a sensory stimulus will propa-gate through a brain, could be determined by the trophic coherence of the underlying networks.
I. INTRODUCTION
An activist tweets a picture and the image spreads through social networks, perhaps going viral; informa-tion enters the brain via sensory neurons and cascades through various kinds of cell before inducing motor neu-rons to fire; the plants in an ecosystem are decimated by a drought and the pulse of want travels up through trophic chains until even the top predators are affected. These and many others are examples of spreading processes in complex systems which can be regarded as cascades of ac-tivity percolating through directed networks. Crucially, the signals arriving at a node – person, neuron, species – can combine to create a nonlinear response: it is not the same to receive a trickle of signals over an extended period of time as a single, large package.
2
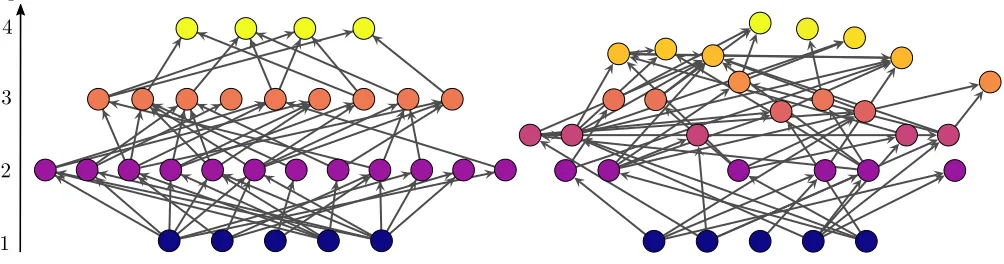
Figure 1. Left: An example of a maximally coherent network (q= 0). Right: A network with the same parametersN,B and
L as the one on the left, but less trophically coherent (q = 0.49). In both cases, the hight of the nodes on the vertical axis
represents their trophic level. The networks were generated with the preferential preying model as described in the main text,
withT = 0.001 for the one on the left, andT = 1 for the one on the right.
while not usually studied as spreading processes, has also been shown, in simple models, to depend fundamentally on topological properties, such as degree heterogeneity,17 assortativity,18 and clustering.19 Furthermore, much re-search has focused on mapping the structure of biological neural networks, and understanding how such topologies arise.20–25
‘Trophic coherence’, a measure of how neatly food webs or other directed networks fall into well-defined trophic levels, has recently been shown to play a key role in the dynamical stability of ecosystems.26 Such is the in-fluence of this topological property that sufficiently co-herent networks can become more stable with increas-ing size and complexity, thereby offerincreas-ing a solution to May’s paradox.26–29 It has also been suggested that the trophic coherence of ecosystems may have contributed to the devastating effect that human expansion had on Pleistocene megafauna.30 But it is not only food webs which exhibit a significantly non-random trophic struc-ture: this characteristic has recently been shown to de-termine properties such as eigenspectra,31 feedback,31,32 directionality,32 and intervality33 in a wide variety of bi-ological and artificial networks, including those of gene transcription, neurons, metabolites, cellular signalling, concatenated words, P2P users and world trade.31,32
In this paper we show that trophic coherence also af-fects spreading processes. We consider two seemingly rather different models, one a version of the Susceptible-Infected-Susceptible (SIS) epidemic model10extended to account for complex contagion,11,15 and the other an Amari-Hopfield neural network.34–36
To generate directed networks with tunable trophic co-herence we propose a variation of the ‘preferential prey-ing’ model (PPM) used by Johnson et al.26, with the difference that this version limits in random graphs in-stead of acyclic ‘cascade model’ networks, and is therefore less specific to food webs and perhaps more appropriate for investigating generic directed networks. Our numer-ical study reveals that trophic coherence can determine whether a pulse of activity in either model will propagate
through the entire network or remain confined to a small fraction of nodes, or become endemic as opposed to dying out soon after initiation. We conclude with some open questions and our assessment of the main areas where theoretical research might provide important insights.
II. METHODS
A. Trophic coherence
Let us consider a directed network given by theN×N
adjacency matrix A, with elements aij = 1 if there is
a directed edge from node j to node i, and aij = 0 if
not. The in- and out-degrees of nodeiarekin i =
P
jaij
andkout
i =
P
jaji, respectively. The number of edges is L = P
ijaij, and the mean degree is hki = L/N. We
shall assume that the network is weakly connected, and that there is a number B > 0 of nodes with kin = 0,
which we shall refer to asbasal nodes. It is standard in ecology to define thetrophic level si of nodes as
si= 1 +
1
kin i
X
j
aijsj, (1)
if kin
i > 0, or si = 1 if kini = 0. In other words, the
trophic level of basal nodes (autotrophs in the ecologi-cal context) is s = 1 by convention, while other nodes (consumer species) are assigned the mean trophic level of their in-neighbours (resources), plus one.37 Thus, for any directed network in which every node is on at least one directed path originating at a basal node, the trophic level of each node is a topological feature easily obtained by solving the linear system of Eq. (1). In a recent pa-per, Johnsonet al.26characterise each edge in an network with atrophic distance: xij =si−sj (not a distance in
the edges, the more coherent the network. As a measure of coherence, one can simply use the standard deviation ofp(x), which is referred to as anincoherence parameter:
q=phx2i −1.
When applied to food webs – networks of who eats whom in an ecosystem – it turns out that trophic coher-ence is the best statistical predictor of linear stability.26 Furthermore, a simple model which generates networks with tunable coherence shows that this property can al-low for systems to become more stable with size and edge density – which suggests a solution to May’s paradox, or why large, complex ecosystems are observed to be the most stable.26–29By defining the coherence ensemble, it has recently been shown31that trophic coherence is a key factor determining the cycle structure and distribution of eigenvalues in directed networks, and that it is possible to compare the empirical value ofq for a given network to its random expectation, ˜q=p
L/LB−1, whereLB is
the number of edges connected to basal nodes. It turns out that certain kinds of biological networks, such as food webs, some gene regulatory networks, or theC. elegans
neural network, are significantly coherent (q <q˜); while others, most notably metabolic networks, are less coher-ent than the random expectation (q >q˜).31
Figure1displays two small networks which differ only in their trophic coherence: the one on the left is maxi-mally coherent (q= 0), while the one on the right is more incoherent (q = 0.49). Even the one on the right, how-ever, is more coherent than the corresponding random expectation (˜q= 2.24). Note that the difference between the two networks is apparent thanks to the nodes be-ing plotted on a vertical axis representbe-ing trophic level – when this information is not highlighted in the visu-alisation, significantly coherent networks can appear no different from incoherent ones to the naked eye. From the network on the left, it is clear that a maximally co-herent network is also multipartite (or bipartite in the case of having only two trophic levels). Thus, trophic co-herence can be regarded as the extent to which a network approaches this state of order, much as modularity is a measure of how close an undirected network is to being disconnex.38
It is not yet known what mechanisms lead to trophic coherence – or incoherence – in directed networks. One possibility is that edges are formed preferentially between nodes with specific functions, which in turn are corre-lated with trophic level. For instance, in an ecosystem the biomass is produced by the plants and flows up the food chain through herbivores, primary carnivores, and secondary carnivores until it reaches the apex predators. Likewise, information enters a neural network via sensory neurons, and is passed on to interneurons and other cells with various processing functions before reaching the mo-tor neurons. On the other hand, since trophic coherence is related to several other structural and dynamical prop-erties, it may be that in certain systems topologies are selected for their stability, robustness or feedback
charac-0 1 2 3 4 5
TemperatureT 0
1 2 3 4 5
In
co
h
er
en
ce
q
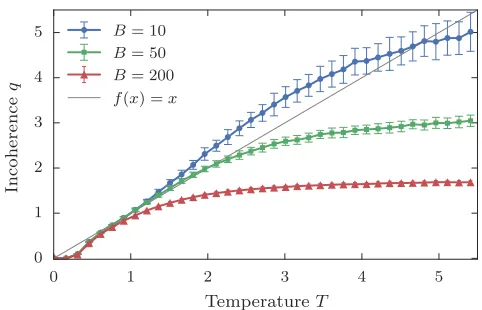
[image:4.612.322.563.58.213.2]B= 10 B= 50 B= 200 f(x) =x
Figure 2. Trophic coherence, as given byq, against the
tem-perature parameterT for networks generated with the
prefer-ential preying model described in the main text, for different
numbers of basal nodes:B= 10, 50 and 200, as shown. In all
cases, the number of nodes isN= 1000 and the mean degree
ishki= 5. Averages are over 1000 runs.
teristics, and coherence is a secondary effect. Be this as it may, the networks observed to exhibit this feature tend to be involved in the transport of some quantity – such as energy or information – through a system. In this paper we therefore explore the effects of trophic coherence on spreading processes, and find that it plays an important role, in some circumstances inducing transitions between qualitatively different regimes of dynamical behaviour.
1. Generating coherent networks
Johnsonet al.26 put forward a model for generating net-works with a tunable degree of trophic coherence, re-ferred to as the ‘preferential preying model’ (PPM). How-ever, the networks thus generated are always acyclic. While this is a characteristic of many food webs, we are here interested in studying the effects of trophic coher-ence on spreading processes in the most general circum-stances possible, and so propose an extension of the PPM which can generate cycles. In the first step of the model, we begin with B basal nodes and proceed to introduce
N−Bnon-basal nodes sequentially; each of these has, at this stage, only one in-neighbour, chosen randomly from among the extant nodes (basal and non-basal) already in the network when it arrives. At the end of this step, each nodei has a preliminary trophic level, ˜si, as given
by Eq. (1) (in every case an integer, since each non-basal node has so far only one in-neighbour). The second step is to introduce the remaining L−N +B edges needed to make up a total ofL. For this, each pair of nodesi, j
4
then placed with a probability proportional to
P(aij →1)∝exp
−(˜xij−1) 2
2T2
, (2)
until there are L edges in the network, and therefore a mean degree ofhki=L/N. As in the original PPM, the ‘temperature’ parameter T tunes the degree of trophic coherence, withT = 0 yielding maximally coherent net-works (q= 0), and incoherence increasing monotonically with T. The specific choice for the edge probability is arbitrary, but the form in Eq. (2) is conducive to a Gaus-sian distribution of distancesx, which we have found to be a good fit to empirical data on several kinds of net-works. The relationship between T and q in networks thus generated is shown in Fig. 2. At low T we ob-serve that q ≃ T, while the coherence saturates to the randomly expected value at higherT.
The main difference between the model described above and the original PPM as implemented by
John-son et al.26 – and also by Dom´ınguez-Garc´ıa et al. in
this same issue33 – is in the networks generated at high T. Both models generate maximally coherent networks when T →0. However, when T → ∞, the original ver-sion coincides with both the ‘generalised cascade model’, and with the ‘generalised niche model’ when its param-eter c = 0, a limiting behaviour which makes for use-ful comparisons in the context of food webs.39,40(These food-web models are based on a ‘niche axis’, defined by a random number given at the outset to each node: in the generalised cascade model, the in-neighbours of node
i are attributed randomly from nodes with lower niche values than i; the ‘niche model’ imposes the additional constraint that in-neighbours must be contiguous on the niche axis; and the generalised niche model interpolates between the two with a parameter c.) The version of the PPM which we now put forward generates networks which approach directed Erd¨os-R´enyi random graphs at high temperature. In fact, atT → ∞, the networks gen-erated are the overlap of two graphs: a “skeleton” with
N−B edges, which ensures that the network is weakly connected; and a directed random graph withL−N+B
edges, and the constraint thatB nodes havekin= 0.
B. Spreading processes
The spreading of some form of activity through a system has been extensively studied in a wide variety of set-tings, most notably in percolation theory.41,42 Examples include epidemics,10 opinions,15 forest-fires,43 trophic cascades,44 and avalanches of neural activity.45 With a view to exploring the influence of trophic coherence on how activity of some kind spreads through a system, we consider two different paradigms: a model of complex contagion, and an Amari-Hopfield neural-network model.
1. Complex contagion
Our first model is an adaptation of the standard Susceptible-Infected-Susceptible (SIS) epidemic model,10 in which each nodeiin a network is characterised at time
tby a binary variablezi(t), which can be in either of two
states: ‘susceptible’ (zi(t) =S) or ‘infected’ (zi(t) =I).
Our version of this model will take into account the phe-nomenon of “complex contagion”, whereby the probabil-ity of an element becoming ‘infected’ can be a non-linear function of the proportion of its neighbours who are al-ready ‘infected’. Centola has shown that social reinforce-ment plays a key role in the adoption of behaviour by participants in an online experiment,11 and theoretical research has recently highlighted how network clustering can influence this kind of spreading process.12 We con-sider that, at each time stept, each ‘susceptible’ node i
has a probability of becoming ‘infected’ given by
P[zi(t+ 1) =I|zi(t) =S] =fi(t)α, (3)
where f(t) is the fraction of i’s in-neighbours (i.e. of those nodes j such that aij = 1) which are in the
‘in-fected’ state at timet (zj(t) =I), andαis a parameter
which determines the kind of complex contagion. A node which is ‘infected’ at timetautomatically becomes ‘sus-ceptible’ again at timet+ 1:
P[zi(t+ 1) =S|zi(t) =I] = 1, (4)
and all nodes are updated in parallel.
The essence of complex contagion is captured also by the ‘q-voter model’ of opinion dynamics,15 a generaliza-tion of the well-known voter model13in which the prob-ability of an agent updating its state depends on there being a consensus amongqof its neighbours.
2. Neural networks
The second model we consider is an Amari-Hopfield neu-ral network, in which nodes are binary variables with statesvi(t) = ±1 representing the fact that, in a given
time window, a neuron can either fire an action potential, or not.34–36 Nodes are updated in parallel according to the probability
P[vi(t+ 1) =±1] =
1
2{±tanh [βhi(t)] + 1}, (5)
where the field atiis
hi(t) =
X
j
aijvj(t), (6)
and the parameter β sets the degree of stochasticity. (Note that the expression forhi(t) usually takes into
0.0 0.5 1.0 1.5 2.0 2.5 3.0 T
0.0 0.2 0.4 0.6 0.8 1.0
In
ci
d
en
ce
α= 0.75 α= 1.00 α= 1.25 α= 1.50
0.6 0.8 1.0 1.2 1.4 1.6 α
0.0 0.2 0.4 0.6 0.8 1.0
In
ci
d
en
ce
T = 0.5 T = 1.0 T = 1.5 T = 2.0
0.0 0.5 1.0 1.5 2.0 2.5 3.0 T
0.0 0.2 0.4 0.6 0.8 1.0
In
ci
d
en
ce
(c)
β= 2.0 β= 2.5 β= 3.0 β= 4.0 β= 5.0
1.0 1.5 2.0 2.5 3.0 3.5 4.0 4.5 5.0 β
0.0 0.2 0.4 0.6 0.8 1.0
In
ci
d
en
ce
(d)
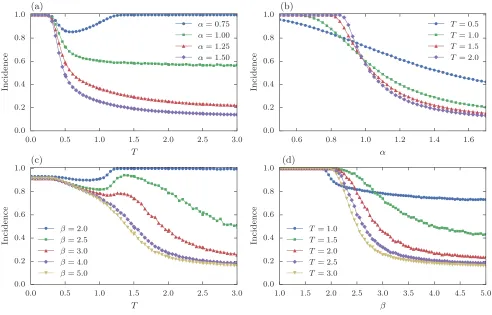
[image:6.612.61.553.51.366.2]T = 1.0 T = 1.5 T = 2.0 T = 2.5 T = 3.0
Figure 3. Average Incidence values from Monte Carlo simulations of the two spreading models on networks with varying trophic
coherence, as described in the main text. (a) Incidence againstT (smaller T means more coherent networks) in the complex
contagion model for several values of the contagion parameterα, as shown. (b) Incidence againstαin the complex contagion
model for several values ofT. (c) Incidence againstT in the Amari-Hopfield neural-network model for several values of the
stochasticity parameter β. (d) Incidence against β in the Amari-Hopfield neural-network model for several values of T. All
networks haveN= 1000,B= 50, andhki= 5. Averages are over 1000 runs.
Although real neurons exhibit far richer behaviour than this simple model would suggest, for many purposes collections of binary neurons are found to yield results qualitatively similar to those of more realistic models.46
III. RESULTS
In order to investigate numerically the effects of trophic coherence on spreading processes, we generate networks with given number of nodesN, basal nodesB, and edges
L as specified above, and carry out Monte Carlo runs of each of our dynamical models for different values of the parameter T – i.e. for different degrees of trophic coherence. For the complex contagion model, the initial condition is to set all nodes to ‘susceptible’ except for the basal nodes, which are all ‘infected’; that is,zi(t= 0) =S
if kin >0, and z
i(t = 0) = I if kin = 0. For each run
we measure the Duration of the infection, that is, the number of time steps until no nodes are ‘infected’; as well as theIncidence, or proportion of nodes which have at any time been in the ‘infected’ state.
Figure 3(a) shows the mean Incidence against T for various values ofα. On highly coherent networks (T ≃0) the infection spreads to the whole system for anyα. On less coherent topologies, however, whether contagion is sub- or super-linear has a strong influence on spreading: for α > 1 the infection only reaches a fraction of the network, while forα <1 the effect of coherence on Inci-dence is non-monotonic. In Fig. 3(b), where the mean Incidence is plotted againstα for different values of T, we can see how the effect ofαon spreading is modulated by topology, becoming less severe the more coherent the networks. Hence, it is the interplay of both the trophic coherence of the underlying network, and the form of the infection probability, which determines whether the infection can spread.
We also perform a similar investigation of the Amari-Hopfield neural model on networks generated in the same way. Now we set all the basal nodes initially to ‘firing’ [i.e. vi(t = 0) = 1 if kini = 0], and all other nodes to
‘not firing’ [vi(t = 0) = −1 if kiin > 0]. The Duration
6
0.0 0.5 1.0 1.5 2.0 2.5 3.0
TemperatureT 0.5 0.75 1.0 1.25 1.5 1.75 α (a)
0.0 0.5 1.0 1.5 2.0 2.5 3.0
TemperatureT 0.5 0.75 1.0 1.25 1.5 1.75 α (b)
0.0 0.5 1.0 1.5 2.0 2.5 3.0
TemperatureT 1.0 1.5 2.0 2.5 3.0 3.5 4.0 4.5 5.0 β (c)
0.0 0.5 1.0 1.5 2.0 2.5 3.0
TemperatureT 1.0 1.5 2.0 2.5 3.0 3.5 4.0 4.5 5.0 β (d) 0.0
0.2 0.4 0.6 0.8 1.0
In
ci
d
en
ce
0.5 1.0 1.5 2.0 2.5 3.0
lo g1 0 (D u ra ti o n )
0.0 0.2 0.4 0.6 0.8 1.0
In
ci
d
en
ce
0.5 1.0 1.5 2.0 2.5 3.0
lo g1 0 (D u ra ti o n )
Figure 4. Heat-maps showing average values of Incidence and of the common logarithm of Duration on a colour scale; results
are from Monte Carlo simulations of the two spreading models on networks with varying trophic coherence, as set byT. (a)
and (b) Complex contagion model, whereα is the contagion parameter. (c) and (d) Amari-Hopfield neural-network model,
whereβis the stochasticity parameter. All networks haveN= 1000,B= 50, andhki= 5. Averages are over 100 runs.
the proportion of nodes which at any moment during this period adopted the ‘firing’ state. As with the infection, whether this pulse will propagate throughout the whole network is determined by both the neural dynamics, as parametrised byβ; and the trophic coherence of the net-work. Figure 3(c) shows the mean Incidence against T
for several values ofβ, while Fig. 3(d) hasβon the x-axis for various values ofT. Despite the different dynamics, the curves bear a resemblance to the cases in panels (a) and (b). In both cases, a high trophic coherence (T ≃0) can ensure that the pulse of activity will reach most of the network irrespectively of other parameters, whereas if the network is incoherent (T ≫0) propagation requires lowα(for the complex contagion model) or lowβ(in the neural network).
Figure4displays heat-maps for the complex contagion case [panels (a) and (b)] and the neural-network model [panels (c) and (d)]. Panels (a) and (c) show the mean Incidence against T and the relevant model parameter (αfor the complex contagion and β for the neural net-work), while panels (b) and (d) show the logarithm of the Duration against the same parameters. We run the simulations for a maximum of 103Monte Carlo steps, so Duration above this can mean either a long but
eventu-ally finite (transient) period of activation, or an endemic state in which a degree of activity remains indefinitely.
By comparing Incidence and Duration, we can dis-cern that both models exhibit three qualitatively different regimes of behaviour: at highT and highαorβ, activity dies out quickly without reaching most of the system; at highT and lowαorβ, activity spreads to the whole sys-tem and remains indefinitely; at lowT, activity spreads to the whole system and then dies out quickly. We can refer to these regimes asinactive, endemic, and pulsing, respectively. The main qualitative difference between the behaviour of the two models regards the endemic regime. In the complex contagion case, this regime is confined to sufficiently incoherent networks, and its range increases monotonically with T. In the neural network it occurs for anyT ifβ.2, and the range is non-monotonic with
T, peaking at intermediate values ofT.
[image:7.612.65.552.51.366.2]0.0 0.5 1.0 1.5 2.0 2.5 3.0 T
0.0 0.2 0.4 0.6 0.8 1.0
In
ci
d
en
ce
N= 1000, B= 50 N= 5000, B= 250 N= 10000, B= 500
N= 1000, B= 100 N= 5000, B= 500 N= 10000, B= 1000
0.0 0.5 1.0 1.5 2.0 2.5 3.0 T
0.0 0.2 0.4 0.6 0.8 1.0
In
ci
d
en
ce N= 1000, B= 50
[image:8.612.64.553.52.205.2]N= 5000, B= 250 N= 10000, B= 500 N= 1000, B= 100 N= 5000, B= 500 N= 10000, B= 1000
Figure 5. Average Incidence values from Monte Carlo simulations of the two spreading models on networks with varying trophic
coherence, as described in the main text. (a) Incidence againstT (smaller T means more coherent networks) in the complex
contagion model forα= 1. (b) Incidence againstT in the Amari-Hopfield neural-network model forβ= 3. Symbols indicate
different network sizes (N = 1000, 5000 and 10000) and proportions of basal nodesB (N/B= 10 and 20). In all cases, the
mean degree ishki= 5. Averages are over 1000 runs.
P = 1, for anyα, and thus the infection moves up a level. By the same process, one time step later the infection moves to levels= 3, and continues to spread in this way until it has reached the whole system – at which point the infection dies out. On an incoherent network (high T), like the one in Fig. 1(b), as the pulse of activity moves up the trophic levels, the fraction of infected in-neighbours affecting a given nodei,fi, becomes lower with increasing si. Hence, if the network is insufficiently coherent, the
pulse will die out as it progresses up the levels, and only reach a finite fraction of the nodes. This explains why the pulsing regime occurs at low T. According to Eq. (5), the above considerations apply also to the neural-network model at lowT whenβ is sufficiently high that the probability of a node being activated when all its in-neighbours are active isP ≃1.
For the complex contagion to become endemic, given that nodes recover immediately after infection, there must be some degree of feedback. In other words, the network must have cycles. As Johnson & Jones have shown,31 the expected number of cycles in a network is a function of its trophic coherence, and for q below a particular value (which depends on other topological properties), networks are almost always acyclic. This ac-counts for an endemic phase which grows in range with
T. However, the extent of node re-infection will depend on both the density of cycles, and the probability that a node becomes infected by a given proportion of infected in-neighbours, as determined by Eq. (3); re-infection is therefore more likely at lowerα. Again this argument can be extended to the neural-network model, with a caveat. In the complex contagion model, a node must have at least one infected in-neighbour to become infected, so the endemic regime requires cycles. In the neural network, however, for any finite β there exists a probability of spontaneous node activation. For low enoughβ, the sys-tem enters the standard paramagnetic (or memoryless)
phase of the model, with continuous, random activation of nodes. This explains why the endemic regime of the neural model extends to the full range ofT for lowβ.
Finally, the non-monotonic dependence of the endemic regime withT in the neural model seems to be caused by a balance between the two mechanisms we have described for activity propagation: a rapid pulse which can travel on coherent networks, and the reverberation allowed for by the cycles of incoherent ones. It is perhaps noteworthy that this effect of feedback in the neural model is similar to the mechanism of ‘cluster reverberation’ put forward to explain short-term memory.19
To conclude we look into the effects of network size and of the proportion of basal nodes. Figure 5 shows how Incidence depends onT when we fix α= 1 for the complex contagion model [Fig. 5(a)], and β = 3 in the neural network [Fig. 5(b)]. Results are presented for three network sizes (N = 1000, 5000 and 10000), and two ratiosN/B = 10 and 20. In the complex contagion model the lines for differentN but fixed basal ratio col-lapse, and there is only a small effect of the basal ratio on the Incidence at highT. In the neural network there is a much more pronounced influence of the proportion of basal nodes: at high T, a ratio N/B = 10 allows for spreading to reach the whole system when this is not pos-sible ifN/B= 20. This may be a consequence of the de-pendence of the mean trophic level on this ratio,31which for random graphs has an expected value hsi = N/B. WhenN/B = 20, the non-monotonicity of Incidence with
T is also exacerbated slightly byN.
IV. DISCUSSION
nu-8
merical investigation of two seemingly quite different dy-namics – one a model inspired by epidemics, the other a neural-network model originally put forward to explain associative memory – indicates that this topological fea-ture is relevant for any system in which some kind of sig-nal is transmitted between elements in such as way that these signals interact. We do not yet have an analytical theory able to describe spreading as a function of trophic coherence, but it is clear that such a theory should take into account two effects: the transmission of pulses of synchronous activity which can occur on highly coherent topologies; and the maintenance of endemic states en-abled by feedback loops on incoherent networks. Trophic coherence has already been shown to play an important role in determining various features of directed networks, such as linear stability,26 feedback,31 and intervality.33 We add here to such work by showing that spreading pro-cesses are also strongly influenced by this recently iden-tified topological feature, and submit that more research is required to determine its relationship to other network properties, to build a generalised understanding of its bearing on dynamical processes, and to discover by what mechanisms non-trivial coherence or incoherence comes about in nature.
ACKNOWLEDGMENTS
J. K. was supported by the EPSRC under grant EP/IO1358X/1. We are grateful to Miguel A. Mu˜noz, Virginia Dom´ınguez-Garc´ıa, and Nick S. Jones for feed-back on the manuscript as well as innumerable conversa-tions of great use and enjoyment.
REFERENCES
1S. Boccaletti, V. Latora, Y. Moreno, M. Chavez, and D.-U.
Hwang, “Complex networks: Structure and dynamics,”Physics
reports, vol. 424, no. 4, pp. 175–308, 2006.
2A. Arenas, A. D´ıaz-Guilera, J. Kurths, Y. Moreno, and
C. Zhou, “Synchronization in complex networks,” Physics
Re-ports, vol. 469, no. 3, pp. 93–153, 2008.
3A. Barrat, M. Barthelemy, and A. Vespignani,Dynamical
pro-cesses on complex networks. Cambridge University Press, 2008.
4D. J. Watts and S. H. Strogatz, “Collective dynamics of
‘small-world’ networks,”Nature, vol. 393, pp. 440–442, 1998.
5C. Moore and M. E. Newman, “Epidemics and percolation in
small-world networks,”Physical Review E, vol. 61, no. 5, p. 5678, 2000.
6M. J. Keeling and K. T. D. Eames, “Networks and epidemic
models.,” Journal of the Royal Society, Interface / the Royal
Society, vol. 2, pp. 295–307, Sept. 2005.
7R. Durrett, “Some features of the spread of epidemics and
in-formation on a random graph.,” Proceedings of the National
Academy of Sciences of the United States of America, vol. 107,
pp. 4491–8, Mar. 2010.
8L. Danon, A. P. Ford, T. House, C. P. Jewell, M. J. Keeling, G. O.
Roberts, J. V. Ross, and M. C. Vernon, “Networks and the Epi-demiology of Infectious Disease,”Interdisciplinary Perspectives
on Infectious Diseases, vol. 2011, p. e284909, Mar. 2011.
9T. House, “Modelling epidemics on networks,” Contemporary
Physics, vol. 53, pp. 213–225, May 2012.
10R. Pastor-Satorras, C. Castellano, P. Van Mieghem, and
A. Vespignani, “Epidemic processes in complex networks,”
Re-views of Modern Physics, vol. 87, pp. 925–979, Aug. 2015.
11D. Centola, “The spread of behavior in an online social network
experiment,”Science, vol. 329, no. 5996, pp. 1194–1197, 2010.
12D. J. P. O’sullivan, G. J. O’Keeffe, P. G. Fennell, and J. P.
Glee-son, “Mathematical modeling of complex contagion on clustered networks,”Interdisciplinary Physics, p. 71, 2015.
13K. Suchecki, V. M. Egu´ıluz, and M. San Miguel, “Voter model
dynamics in complex networks: Role of dimensionality, disor-der, and degree distribution,”Physical Review E, vol. 72, no. 3, p. 036132, 2005.
14V. Sood, T. Antal, and S. Redner, “Voter models on
heteroge-neous networks,” Physical Review E, vol. 77, no. 4, p. 041121, 2008.
15C. Castellano, M. A. Mu˜noz, and R. Pastor-Satorras, “Nonlinear
q-voter model,” Physical Review E, vol. 80, no. 4, p. 041129, 2009.
16P. Moretti, S. Liu, C. Castellano, and R. Pastor-Satorras,
“Mean-field analysis of the q-voter model on networks,”Journal of
Sta-tistical Physics, vol. 151, no. 1-2, pp. 113–130, 2013.
17S. Johnson, J. Marro, and J. J. Torres, “Functional
optimiza-tion in complex excitable networks,”EPL (Europhysics Letters), vol. 83, no. 4, p. 46006, 2008.
18S. de Franciscis, S. Johnson, and J. J. Torres, “Enhancing
neural-network performance via assortativity,”Physical Review E, vol. 83, no. 3, p. 036114, 2011.
19S. Johnson, J. Marro, and J. J. Torres, “Robust short-term
mem-ory without synaptic learning,”PloS one, vol. 8, no. 1, p. e50276, 2013.
20J. White, E. Southgate, J. Thomson, and S. Brenner, “The
struc-ture of the nervous system of the nematode caenorhabditis ele-gans: the mind of a worm,”Phil. Trans. R. Soc. Lond, vol. 314, pp. 1–340, 1986.
21S. Song, P. J. Sjstrm, M. Reigl, S. Nelson, and D. B. Chklovskii,
“Highly nonrandom features of synaptic connectivity in local cor-tical circuits,”PLoS Biol, vol. 3, p. e68, 03 2005.
22C. J. Honey, R. K¨otter, M. Breakspear, and O. Sporns,
“Net-work structure of cerebral cortex shapes functional connectivity on multiple time scales,” Proceedings of the National Academy
of Sciences, vol. 104, no. 24, pp. 10240–10245, 2007.
23S. Johnson, J. Marro, and J. J. Torres, “Evolving networks and
the development of neural systems,”Journal of Statistical
Me-chanics: Theory and Experiment, vol. 2010, no. 03, p. P03003,
2010.
24R. Perin, T. K. Berger, and H. Markram, “A synaptic
organiz-ing principle for cortical neuronal groups,” Proceedings of the
National Academy of Sciences, vol. 108, no. 13, pp. 5419–5424,
2011.
25R. Perin, M. Telefont, and H. Markram, “Computing the size
and number of neuronal clusters in local circuits,”Frontiers in
Neuroanatomy, vol. 7, no. 1, 2013.
26S. Johnson, V. Dom´ınguez-Garc´ıa, L. Donetti, and M. A. Mu˜noz,
“Trophic coherence determines food-web stability,” Proc. Natl.
Acad. Sci. USA, vol. 111, no. 50, pp. 17923–17928, 2014.
27R. M. May, “Will a large complex system be stable?,” Nature,
vol. 238, pp. 413–14, 1972.
28R. M. May,Stability and complexity in model ecosystems.
Prince-ton, USA: Princeton University Press, 1973.
29K. S. McCann, “The diversity-stability debate,”Nature, vol. 405,
pp. 228–33, 2000.
30M. M. Pires, P. L. Koch, R. A. Fari˜na, M. A. M. de Aguiar,
S. F. dos Reis, and P. R. Guimar˜aes, “Pleistocene megafaunal interaction networks became more vulnerable after human ar-rival,”Proceedings of the Royal Society of London B: Biological
Sciences, vol. 282, no. 1814, 2015.
31S. Johnson and N. S. Jones, “Spectra and cycle
32V. Dom´ınguez-Garc´ıa, S. Pigolotti, and M. A. Mu˜noz, “Inherent
directionality explains the lack of feedback loops in empirical networks,”Sci. Rep., vol. 4, p. 7497, 2014.
33V. Dom´ınguez-Garc´ıa, S. Johnson, and M. A. Mu˜noz,
“Inter-vality and coherence in complex networks,” Chaos, vol. 26, p. 065308, 2016.
34S.-I. Amari, “Characteristics of random nets of analog
neuron-like elements,”Systems, Man and Cybernetics, IEEE
Transac-tions on, no. 5, pp. 643–657, 1972.
35J. J. Hopfield, “Neural networks and physical systems with
emer-gent collective computational abilities,”Proceedings of the
na-tional academy of sciences, vol. 79, no. 8, pp. 2554–2558, 1982.
36D. J. Amit, Modeling brain function: The world of attractor
neural networks. Cambridge University Press, 1992.
37S. Levine, “Several measures of trophic structure applicable to
complex food webs,”J. Theor. Biol., vol. 83, pp. 195–207, 1980.
38M. E. J. Newman, “The structure and function of complex
net-works,”SIAM Review, vol. 45, pp. 167–256, 2003.
Princeton Univ. Press, 1978.
40D. B. Stouffer, J. Camacho, R. Guimer`a, C. A. Ng, and L. A. N.
Amaral, “Quantitative patterns in the structure of model and empirical food webs,”Ecology, vol. 86, p. 13011311, 2005.
41B. Bollobas and O. Riordan,Percolation. Cambridge University
Press, 2006.
42R. Cohen and S. Havlin, Complex networks: structure,
robust-ness and function. Cambridge University Press, 2010.
43B. Drossel and F. Schwabl, “Self-organized critical forest-fire
model,”Physical review letters, vol. 69, no. 11, p. 1629, 1992.
44M. E. Power, “Top-down and bottom-up forces in food webs: do
plants have primacy,”Ecology, vol. 73, no. 3, pp. 733–746, 1992.
45J. M. Beggs, “Neuronal avalanche,”Scholarpedia, vol. 2, no. 1,
p. 1344, 2007.
46L. Abbott and T. B. Kepler, “Model neurons: From