Forecasting promotional
demand volume
by
J.S. (Jelle) Kerkdijk
Master Thesis
Examination Committee
Supervisor Unilever: Drs. P.D.J. van Balkom
Supervisors UT: Dr. E. Topan
Dr. I. Seyran - Topan
26th of September 2019
Department of Industrial Engineering and Business Information Systems Master of Science in Industrial Engineering and Management
All models are wrong, but some are useful.
i
Preface
This master thesis is the result of the final part of my master study Industrial Engineering and Management at the University of Twente in Enschede. The master thesis was executed at Unilever Netherlands in Rotterdam from the beginning of April 2019 to the end of September 2019.
Finishing my master thesis marks the end of my student life and is the start of a new phase in my life in which I hope to keep challenging myself and to explore great opportunities.
I would like to grab the opportunity to express my gratitude towards the people who have helped me during my master thesis and my student life in general.
First, I would like the thank my first supervisor Engin Topan for his support during my master thesis. I am thankful for the time you took for me to give me your honest feedback and for the conversations we had on both academic and personal level. Besides, I would like to thank my second supervisor Ipek Seyran-Topan for your useful feedback, giving your perspective and providing me with the structure I needed in both the thesis and in our discussions.
Second, I would like to thank my company supervisor Patrick van Balkom for the insights he provided me during our discussions. His wisdom provided very useful insights and his guidance shed light on my path the moments I needed it. I am really gratful for the opportunity he gave me to execute my master thesis project at Unilever. I enjoyed working with him and experiencing the business perspective compared to the scientific perspective which was the main focus during my studies.
Third, I would like to thank my father, Henk, for all the time and effort he spend helping me and providing me with feedback.
Lastly, I would like to thank my family, close friends and my girlfriend for helping and supporting me throughout this project and during my entire student life.
Jelle Kerkdijk
ii
Management summary
This research for the master thesis is performed at Unilever Netherlands in Rotterdam. Unilever is a global company selling Fast Moving Consumer Goods (FMCGs). Characteristics of FMCG market are competitive, high volumes, fast turn over, multiple product innovations. In the FMCG market the effect of promotions on sales volume is substantial.
Achieving the highest product availability at the lowest costs in combination with high volumes and high inventory turnover is a big challenge. Because of this, Unilever strives to deliver the right amount of products at the right time to the right customer at the lowest cost, which is only possible with an accurate forecast of the demand volume.
This emphasises the importance of an accurate forecast. That is why Unilever wants to shift towards automating demand volume forecasts of promotions using predictive modelling. Unilever has co-developed a predictive modelling tool, based on a machine learning algorithm.
In the implementation phase the company encountered resistance from the employees responsible for the demand forecast, because the current predictive model does not perform well at their perspective at detailed item level. As consequence, these employees modify data, resulting in an incorrect use of the workflow, leading to lower performance on forecast accuracy in the operation. Low accuracy leads to high stock costs or low fill rate do to underforecasting or overforecasting. This results in the volume forecast for product promotions not being accepted by those employees and therefore not used, which is the main problem in this research.
This research is part of continious improvement programm within the company. The goal of this research is to answer the main research question: “How to improve the current forecasting method for product promotions to ensure it is accepted and internalized by the users?”
Initial analysis of the root cause indicated three main problem areas: data availability, data quality, and the forecast model. The largest improvement potential using the Analytical Hierarchy Process (Saaty, 1980) improving data availability. Besides, the focus is also on the acceptance of the forecast. Therefore, the aim is to get the highest outcome on forecast accuracy in business operation, using the equation in Figure 1.
iii
The users of forecasting model are interviewed: they feel information overloaded and they find the current forecasting model too complex. According to scientific research, amongst others by Van Loo (2006) and Makridakis, Spiliotis, & Assimakopoulus (2018), indicated that simpler models might be sufficient.
As result of this study:
➢ A simplified forecasting model for product promotions is built and validated.
It meets the requirement of at least equal performance to the user forecasts. This model uses less parameters and simpler relation formula’s which increases the understandability by users.
➢ An improved user interface is built.
With this only the most important variables are used which reduced the information overload of users.
➢ A monitoring dashboard
With this dashboard the data availability is monitered. This dashboard is already frequently used by the company.
The implementation of the simplified forecasting model has proven to have a substantial improvement in forecast accuracy in business practice for Unilever can be obtained by improving the data availability of promotions.
Therefore the following is recommended to Unilever:
➢ Implement the three improvements; simplified model, improved user interface and monitoring dashboard.
➢ Perform periodic evaluation with two perspectives: • Use and acceptance by users
• Effectiveness of the model
iv
Table of Contents
Preface ... i
Management summary ...ii
List of Figures ... vi
List of Tables ... vii
1. Introduction ... 8
1.1 Company introduction ... 8
1.2 Promotional demand forecasting at Unilever ... 10
1.3 Structure of this report ... 11
1.4 Research motivation ... 12
1.5 Problem definition and research questions ... 14
1.6 Scope limitation ... 16
2. Current system analysis ... 19
2.1 Product promotion at Unilever ... 20
2.2 Promotion planning process ... 21
2.3 Current forecasting method ... 23
2.4 Input data ... 24
2.5 Use and acceptance ... 25
2.6 Root Cause Analysis ... 26
3. Literature review ... 29
3.1 Literature on relevant topics ... 29
3.1.1 Promotional forecasting ... 29
3.1.2 Impact of an accurate forecast ... 30
3.1.3 Fast Moving Consumer Goods company characteristics ... 30
3.2 Literature for answering research questions ... 31
3.2.1 Forecasting methods ... 31
3.2.2 Selecting the forecasting methods for product promotions ... 34
3.2.3 Promotion forecasting models for FMCG: ... 36
3.3 Literature used for analysis ... 37
3.3.1 Dependent and independent variables ... 37
3.3.2 Previous research on independent variables ... 38
3.3.3 Dummy variables and minimum sample size ... 39
3.3.4 Forecasting performance measure ... 40
v
4. Methodology ... 43
4.1 Prioritizing the problems ... 44
4.2 Improving the data availability ... 50
4.3 Preparation of the input data ... 52
4.4 Variables selection... 59
4.5 The simplified forecast method ... 62
4.6 Summary of the applied steps ... 65
5. Results ... 66
5.1 Realization of the simplified model ... 66
5.2 Input variable reduction ... 68
5.3 Realized model versus the current model ... 70
5.4 Improved user interface ... 71
5.5 Introduced dashboard for monitoring data availability ... 71
5.6 Evaluation of the simplified model ... 73
6. Conclusion & Recommendations ... 74
7. Discussion ... 76
7.1 Limitations ... 78
7.2 Recommendations for further research ... 79
8. References ... 80
Appendices ... 85
Appendix A – Unilever Brands ... 85
Appendix B – Analytical Hierarchy Process ... 86
Appendix C – Interview with users ... 88
Appendix D – Comparison between simple and complex model ... 89
Appendix E – Dashboard snapshots ... 91
Appendix F – Flowchart of the realized forecasting method ... 93
Appendix G – LASSO data analysis ... 94
Appendix H – Linear Regression equation ... 97
Appendix I – List of independent variables in each model ... 98
Appendix J – Ordinary Least Square regression results ... 100
Appendix K – Model results of comparable research ... 101
Appendix L – Confidential... 102
vi
List of Figures
FIGURE 1: EQUATION TO MEASURE THE IMPACT OF FORECAST ACCURACY IN BUSINESS OPERATION. ... II FIGURE 2: ORGANIZATION MATRIX OF CUSTOMER TEAMS AND PRODUCT CATEGORIES AT UNILEVER
NETHERLANDS - VAN DER POEL (2010) ... 8
FIGURE 3: THE POSITION OF INTEGRATED OPERATIONS WITHIN UNILEVER... 9
FIGURE 4: AN OVERVIEW OF THE DEMAND FORECASTING PROCESS ... 10
FIGURE 5: STRUCTURE OF THIS REPORT, INSPIRED BY THE CONTINUOUS IMPROVEMENT CYCLE ... 11
FIGURE 6: PROMO PRESSURE IN % BY CLUSTER FOR 2018. ... 12
FIGURE 7: TRADE-OFF BETWEEN USEFULNESS AND ACCURACY BASED ON LEVEL OF DETAIL. ... 14
FIGURE 8: INTERACTION BETWEEN IN-MARKET AND EX-FACTORY DEMAND VOLUME – (SYNTETOS ET AL., 2016) ... 17
FIGURE 9: ILLUSTRATION OF THE PERCEPTION OF THE FORECASTING MODEL AT THE STARTING POINT OF THE THIS THESIS WITH THE POSSIBLE RELATIONS. ... 19
FIGURE 10: IMPACT OF A PROMOTION ON THE DEMAND VOLUME. SOURCE: WWW.EYEON.NL ... 21
FIGURE 11: PROCESS FLOW OF PRODUCT PROMOTIONS. SOURCE: VISUALFABRIQ TRADE PROMOTION MASTER™ ... 21
FIGURE 12: USER INTERFACE TO ENTER THE INPUT PARAMETERS FOR PROMOTIONS ... 25
FIGURE 13: ROOT CAUSE ANALYSIS OF THE CURRENT SYSTEM ... 28
FIGURE 14: DISTINCTION BETWEEN DEMAND FORECASTING MODELS BASED ON USE OF STATISTICAL DATA. MAKRIDAKIS (1979); VAN DEN HEUVEL (2009) ... 31
FIGURE 15: FORECASTING TECHNIQUES IN RELATION TO THE DEMAND HISTORY AND FORECAST HORIZON – (SYNTETOS ET AL., 2016) ... 34
FIGURE 16: THE PERFORMANCES OF THE DIFFERENT AREAS OF THE FORECASTING METHOD ARE MULTIPLIED, RESULTING IN THE FORECAST ACCURACY IN BUSINESS PRACTICE. ... 43
FIGURE 17: STRUCTURE OF THE METHODOLOGY ... 43
FIGURE 18: THE ANALYTIC HIERARCHY PROCESS (AHP) ... 44
FIGURE 19: PRIORITIZATION OF THE PROBLEM AREA'S ... 50
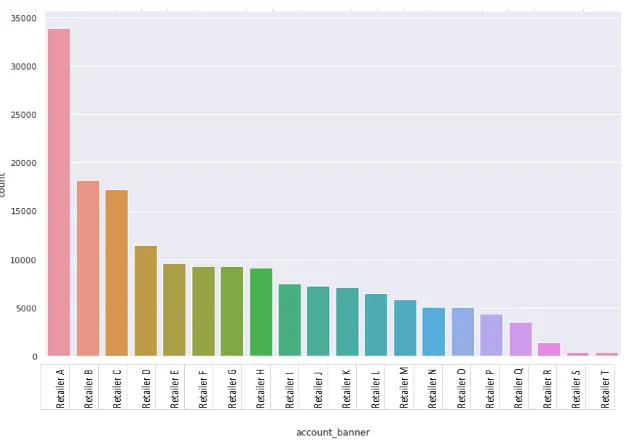
FIGURE 20: THE AMOUNT OF QUANTITY SOLD PER RETAILER, REFLECTING THE SIZE OF RETAILER* ... 53
FIGURE 21: DESCRIPTIVE STATITICS OF THE DEPENDENT VARIABLE TRANSFORMED TO 'LN_TOTAL_UNITS' ... 55
FIGURE 22: DESCRIPTIVE STATISTICS OF THE DEPENDENT VARIABLE 'TOTAL_UNITS' ... 55
FIGURE 23: THE KFOLD CROSS VALIDATION TECHNIQUE – SCIKIT-LEARN DEVELOPERS (2018) ... 57
FIGURE 24: TRADE-OFF BETWEEN UNDERFITTING AND OVERFITTING TO FIND THE SWEET SPOT FOR GENERALIZATION ... 57
FIGURE 25: AN OVERVIEW OF THE APPLIED STEPS IN METHODOLOGY. ... 65
FIGURE 26: COMPLEX(LASSO0.01) COMPARED WITH THE USER FORECASTS ON THE ABSOLUTE DIFFERENCE BETWEEN PREDICTED AND ACTUAL VOLUME... 67
FIGURE 27: SNAPSHOT OF THE OUTPUT RESULTS OF THE ORDINARY LEAST SQUARE METHOD TO EXPLAIN THE INSIGHTS THAT CAN BE GAINED FROM THESE RESULTS. ... 68
FIGURE 28: THE RELATIVE IMPORTANCE OF THE INPUT VARIABLES, WITH A 98% CONFIDENCE INTERVAL, INCLUDED IN THE MODEL. ... 69
FIGURE 29: SNAPSHOT OF THE DASHBOARD BUILD TO KEEP TRACK OF THE DATA AVAILABILITY PER VARIABLE* ... 71
FIGURE 30: RESULT OF THE IMPACT OF THE TOTAL FORECASTING METHOD ON THE FORECAST ACCURACY IN BUSINESS OPERATION. ... 73
FIGURE 31: OVERVIEW OF THE UNILEVER BRANDS AVAILABLE IN THE NETHERLANDS (WWW.UNILEVER.COM) 85 FIGURE 32: RESULT OF THE INTERVIEWS WITH MULTIPLE USERS REGARDING ISSUES WHEN USING THE CURRENT FORECASTING TOOL. ... 88
FIGURE 33: SNAPSHOT OF 'WORKLIST - CAM' FROM THE PARAMETER TRACKER DASHBOARD. ... 91
FIGURE 34: SNAPSHOT OF 'WORKLIST - MTP' FROM THE PARAMETER TRACKER DASHBOARD ... 92
FIGURE 35: FLOWCHART OF THE REALIZED FORECASTING METHOD ... 93
vii
FIGURE 37: PERFORMANCE OF THREE DIFFERENT FORECAST METHODS ON CLUSTER AND CATEGORICAL
LEVEL. ... 102
FIGURE 38: SNAPSHOT VIEW OF THE UPDATED USER INTERFACE ... 102
List of Tables
TABLE 1: PERFORMANCE FORECASTING TECHNIQUES ON SEVERAL CRITERIA (VAN LOO, 2006) ... 35TABLE 2: SCORES FOR PAIRWISE COMPARISONS BETWEEN CRITERIA AND ALTERNATIVES. - SAATY (1980) ... 45
TABLE 3: PAIRWISE COMPARISONS TO DETERMINE THE WEIGHTS FOR EACH CRITERIA ... 46
TABLE 4: ADJUSTED WEIGHT FACTOR SO THAT THE SUM WILL BE 100% ... 46
TABLE 5: COMPARISON OF FORECAST ACCURACY BETWEEN THREE MODELS**... 48
TABLE 6: COMPARISON OF THE FORECAST BIAS BETWEEN THREE MODELS** ... 48
TABLE 7: PAIRWISE COMPARISONS OF OPTIONS, SCORED WITH RESPECT TO THE FACTOR INFLUENCEABILITY 48 TABLE 8: PAIRWISE COMPARISONS OF OPTIONS, SCORED WITH RESPECT TO THE FACTOR IMPACT ON FC ACCURACY ... 49
TABLE 9: PRIORITIZATION OF THE OPTIONS BASED ON A COMBINATION OF THE CRITERIA WEIGHTS AND SCORES OF THE OPTIONS WITH RESPECT TO THOSE CRITERIA. ... 49
TABLE 10: PROMO PRESSURE FOR THE LARGEST RETAILERS IN 2018.* ... 52
TABLE 11: APPLIED FILTER STEPS TO THE DATASET, RESULTING IN THE DATASET USED FOR ANALYSIS ... 54
TABLE 12: OVERVIEW OF ALL INPUT PARAMETERS FOR PRODUCT PROMOTIONS ... 56
TABLE 13: NUMBER OF SKU'S USED IN THE DATASET, TRAINING SET, AND TEST SET ... 58
TABLE 14: ANALYSIS OF THE NUMBER OF FEATURES AND THE R-SQUARED FOR BOTH TRAINING AND TEST DATA FOR THE MODELS WITH DIFFERENT LEVELS OF LASSO’S HYPERPARAMETER ALPHA. ... 61
TABLE 15: THE RESULTS OF THE ANALYSIS ON MISSING VALUES FOR THE DIFFERENT LEVELS OF ALPHA. ... 61
TABLE 16: THE RESULT OF THE PERFORMANCE MEASURES FOR THE SIMPLIFIED MODELS WITH DIFFERENT LEVELS OF LASSO’S HYPERPARAMETER ALPHA. ... 63
TABLE 17: THE RESULTS OF THE DIFFERENT FORECASTING MODELS APPLIED IN THE METHODOLOGY (FOR EXPLANATION SEE SECTION 4.5). ... 66
TABLE 18: RESULT OF COMPARING THE PERFORMANCE MEASURES OF TWO COMPLEX MODELS TO THE USER FORECASTS ... 67
TABLE 19: THE MOST IMPORTANT INPUT VARIABLES AFTER HUMAN JUDGEMENT ON CORRELATION... 70
TABLE 20: THE RESULT OF COMPARING COMPLEX(LASSO0.01) AND USER FORECASTS RELATIVE TO THE COMPLEX(CURRENT) MODEL ON THE PERFORMANCE MEASURES. ... 70
TABLE 21: THE LIST OF INDEPENDENT VARIABLES INCLUDED IN EACH MODEL ... 98
8
1.
Introduction
This chapter gives an introduction to this master thesis. First, the research position within the company is described. Second, a general introduction of promotional demand forecasting at Unilever is given. Third, the structure of this research is described. Fourth, the research is motivated. Fifth, the research questions are formulated. Finally, the scope and practical requirements of the research are stated.
1.1
Company introduction
Unilever is a global company producing and selling fast moving consumer goods among others foods, beverages, cleaning agents and personal care products. Unilever makes some of the best-known brands in the world, and those brands are used by 2.5 billion people every day contributing to Unilever’s purpose to make sustainable living commonplace. The website from Unilever (w.d.) states that all these brands are responsible for a turnover of 51 billion euros in 2018.
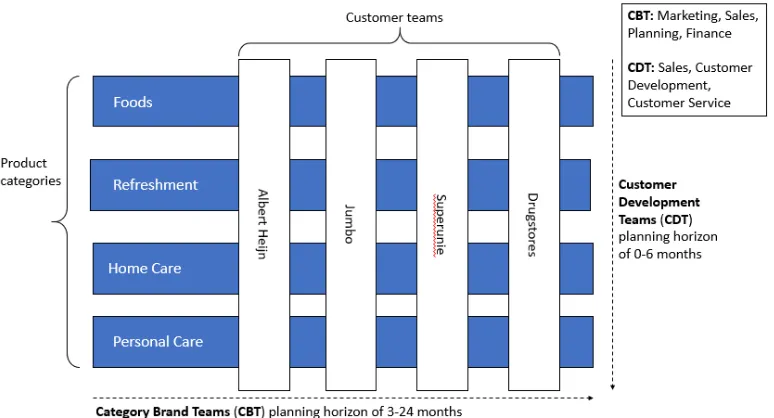
[image:10.595.106.493.360.569.2]This research is done for Unilever Benelux, which is the largest fast-moving consumer goods (FMCG) employer within the Benelux. In the Benelux Unilever sells around 40 well-known brands like Axe, Lipton, Conimex and Calvé (see Appendix A). The turnover of Unilever Benelux in 2018 is around 1.5 billion euros. The emphasis is placed on the Dutch market and thus the Dutch part of Unilever Benelux. Unilever is in the Netherlands split in 4 product categories and 4 customer teams (see Figure 2). This decision will be clarified in Section 1.6.
9 This research is conducted on behalf of the department Integrated Operations, see Figure 3 for the position within Unilever. Integrated Operations helps the business to run smoothly and involves all functions working together to create a strategic business plan which is then used to focus day-to-day actions. It identifies and drives demand, delivers customer service, optimizes Unilever’s supply chain and generates demand volume and financial forecasts. Integrated Operations would like to implement a predictive model to generate reliable and automated forecasts for the total demand volume planning as part of the continuous improvement of the Sales and Operations planning (S&OP).
Concluding, in this section the organization structure has been explained to enhance the understandability. The retailers, departments and product categories will be anonymized before they are used in the further research*. Hence, the reader is able to position this research within the Unilever organization.
*Values in this thesis are manipulated for confidentiality reasons
10
1.2
Promotional demand forecasting at Unilever
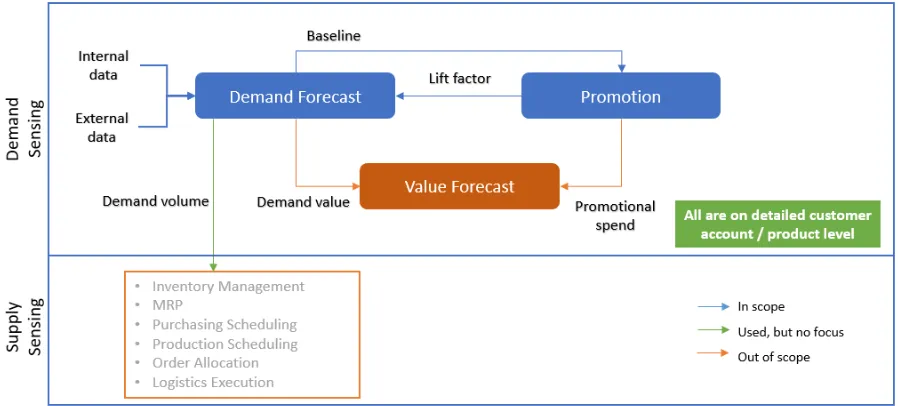
Before continuing to more detailed information about the research topic, a general overview of the total demand volume forecasting process is given, see Figure 4. The demand forecast is split into the demand volume forecast and the demand value forecast. The first one is used as input for the Supply Chain department. The latter, is used as input factor for the value forecast of the Finance department. The focus of this research is on the demand volume forecast. This decision will be clarified in Section 1.6. The demand volume forecast is the input driver for the upstream supply chain. The demand volume forecast consists of the baseline and a lift factor.
The baseline demand volume is the expected number of products to be sold in a regular period of time without promotions. This baseline is calculated using statistical methods based on both internal and external factors. These statistical methods are able to determine seasonality in demand. A lack of external data makes it possible to forecast, but only less accurate.
The impact of promotions is described in a lift factor. The lift factor is calculated using machine learning based on the characteristics of the promotion. Because the baseline demand and the lift factor are critical factors in order to forecast the volume demand, they will be described extensively in Section 2.1.
[image:12.595.71.520.204.407.2]All calculations and information within the demand forecast are on detailed customer account and product level. Therefore, when analyzing this information, the level of detail of the information can be adjusted to the reviewer’ desire. The reviewer can be from the Sales, Finance or Supply Chain department. For example, the reviewer is able to look at aggregated information of all products sold at a particular customer, e.g. all products sold at Retailer A, or at detailed information of a particular product category (e.g. Foods).
11
1.3
Structure of this report
[image:13.595.153.443.325.622.2]
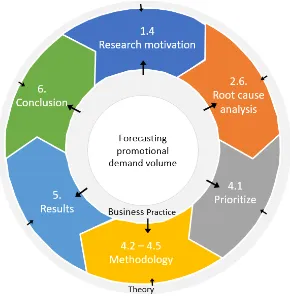
As stated in Section 1.1, this research is part of continuous improvement within the company. Inspired by The Lean Startup (Ries, 2011) fundamental build-measure-learn method, this section explains the structure of this report, which is illustrated in Figure 5. According to the theory by Ries (2011), the method consists of three parts: build, measure, and learn. In this research this theory is applied by combining both the current system (Chapter 2) and related literature to lay the groundwork of this research. Prior to this building step, the improvement cycle starts with motivating why these problems occurs now (Section 1.4), and clear problem definition is given (Section 1.5). Subsequently, these problems are analyzed (Section 2.6) to determine which problem will have the highest impact on improving the acceptance of the forecasted demand volume (Section 4.1). Thereafter, possible improvements regarding the problem with the largest improvement potential are drafted and analyzed (Section 4.2-4.5) to measure the impact on the performance of the forecast (Chapter 5). Lastly, the entire process is evaluated to learn whether or not to pivot or to persevere. The structure of this report is illustrated in Figure 5.
12
1.4
Research motivation
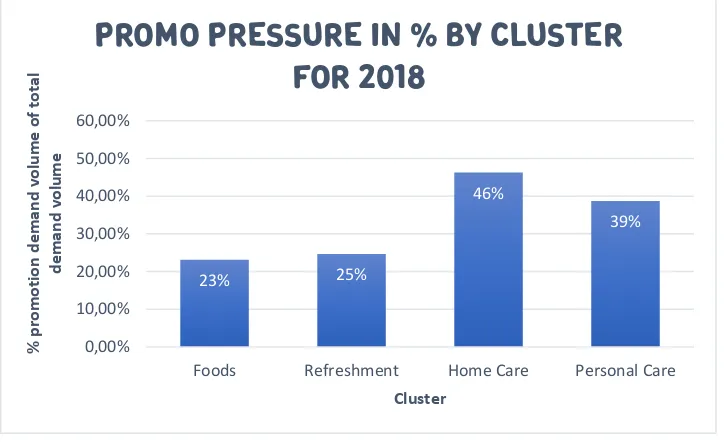
In the last decades, the promotional share of the total demand volume of products within the FMCG (Fast Moving Consumer Goods) market has barely increased, according to the external marketing database Nielsen (Nielsen ,w.d.). However, multiple price wars over the last couple of years increased the promotion pressure, to around 33 percent promotional volume of the total volume in 2018 (see Figure 5). Within the FMCG market competition is mainly focused on maximizing product availability at the lowest costs (Corsten & Gruen, 2003; van der Poel, 2010). In order to still be able to grow the business Unilever has to come up with a solution.
Therefore, Unilever wants to deliver the right amount of products at the right time to the right customer at the lowest cost possible. Prerequisite for this is an accurate forecast of the demand volume and value. The forecast accuracy has impact on the level of stock, stock costs and the service level, the factors that influence the product availability. On the one hand, a low service level because of under forecasting results in out of stocks in retailer stores and this affects the sales quantity and the relationship with the retailers. On the other hand, over forecasting results in extra stock, which leads to extra stock costs and potential obsoletes. Moreover, a high accuracy forecast leads to good business performance. Also due to the higher promotion pressure, the demand becomes instable. Because of this, Unilever noticed that their promotion forecasting became increasingly important.
The importance of product promotions for Unilever is endorsed by the promotion pressure (the percentage promotion demand volume of the total demand volume) of branded products in the different categories at the different retailers in the Dutch market (Derks, 2015). In Figure 6 the percentage promotions of the total volume demand is shown per cluster, as an average of all underlying retailers, to stress the importance of an accurate volume forecast for promotions for each cluster.
The importance of an accurate volume forecast for promotions has been the reason why Integrated Operations started in 2017 (Unilever) with the shift towards automating the demand volume forecast using a predictive modelling tool. Currently, in the implementation phase of the tool, Integrated Operations encounters resistance from employees against this tool to forecast the volume of promotions. Regardless whether the model might perform well on average at aggregated level (per
23% 25% 46% 39% 0,00% 10,00% 20,00% 30,00% 40,00% 50,00% 60,00%
Foods Refreshment Home Care Personal Care
% p ro mo ti o n d e man d v o lu me o f to tal d e man d v o lu me Cluster
[image:14.595.118.480.445.667.2]Promo pressure in % by cluster
for 2018
13 account / per year) users do not trust the outcome of the predictive model because it does not perform well at their perspective, the detailed item level. This detailed item level is referred to as stock keeping unit (SKU).
Problems are faced with the use of the predictive model because of the discrepancy between the aggregated and detailed level performance of the predictive model which leads to the tool not being used. This results in low performance on the supply chain Key Performance Indicators: forecast accuracy and forecast bias. Also, this results in high stock costs or low fill rate due to under or over forecasting. According to the management the problem is considered to be on detailed level, because on aggregated level the average performance is considered good. Therefore, this research aims to improve the Unilever’s current forecast performance at detailed level and focuses on model acceptance by the users.
14
1.5
Problem definition and research questions
This section identifies the problem given the distrust of users in the predictive modelling tool. The Managerial Problem-Solving Method (MPSM) by Heerkens & van Winden (2017) is used to address the problem. To start with this method, the problem is defined based on the research motivation.
Problem definition:
Volume forecast for product promotions are not accepted by users and therefore not used.
The perspective of the total demand forecast, both regular and promotions, performance is two-fold. The management is interested in a good overall aggregated, based on the highest product and retailer hierarchy level, performance. On the other hand, users focus on detailed level, looking at each individual stock keeping unit (hereinafter shortened as SKU) at the lowest product and retailer hierarchy level. This research focus is on forecasting promotional demand. Therefore, from this moment on all information about forecasting refers to promotional demand forecasting, unless stated otherwise. The promotion demand volume forecast can be divided in two levels: macro and micro. Macro level is the top-down perspective where the forecast performance is measured on average and aggregated over all underlying promotions per year, per retailer and at the highest product hierarchy level. By way of contrast, micro level is considered to be the bottom-up perspective where the performance is measured at detailed level for each individual SKU, product group and retailer at the lowest hierarchy level. The performance on macro level is said to be good, according to the management, based on internal research at Unilever. However, looking at the performance from a micro level perspective there is often a discrepancy between expected demand volume by the users and the demand volume forecast by the predictive model. When the accuracy of the demand volume forecast of these individual SKUs is low this frustrates users, since they are judged by the performance of the individual SKUs within their customer or product group. Typical users are the Mid Term Planner (hereinafter shortened as MTP) and the Commercial Assistant Manager (hereinafter shortened as CAM). Due to these frustrations, users do not trust the output of the entire model and use their own alternative working method (e.g. Excel files). These workarounds do not contribute to Integrated Operations’ desired situation of a data driven, one version of the truth and fully integrated volume demand forecast.
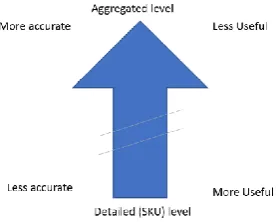
[image:16.595.228.368.622.733.2]Figure 7 illustrates the trade-off between the applicability and accuracy between the two different hierarchy levels; detailed at SKU level or aggregated on lower hierarchy (e.g. product groups). This trade-off implies the difference of interest between the more accurate, but perhaps less useful, aggregated business performance at macro level on one hand and the more useful, but less accurate, forecast on micro level in detail on the other hand. The focus of this research is on the tension field between the performance of the model on macro level and the acceptance on micro level.
15 Therefore, the main question of this research is:
Main question:
“How to improve the current forecasting method for product promotions to ensure it is accepted and internalized by the users?”
To help find the answer to the main question the following sub questions are drafted per area:
Forecasting method
The goal of this area is to obtain an excellent performing predictive model for the forecast of promotions.
Research questions:
Section 3.2: (A) What is the best forecasting method to forecast product promotions for a
company like Unilever1?
Section 2.6: (B) Which factors impact the forecast method?;
Section 4.2: (C) How can these factors be enhanced to improve forecasts?
Sub question:
Section 3.3.4: (D) How to measure the performance of the forecast model?
Use and acceptance
The goal of this area is to increase the user’s trust on the model, increase reliability of the results and get users to use the forecasting model. All this has a beneficial impact on the model performance. Acceptance by the users is requisite for using the model. Creating this acceptance is a continuous loop between increasing the model applicability and gain users trust to ensure the model is used correctly.
Research question:
Section 4.2: (E) How to increase the model applicability and acceptance by the users?
Sub questions:
Section 5.5: (F) How to ensure that the tool is used and internalized?
Data input
The goal of this area is to obtain reliable and relevant data input for the forecasting model.
Research question:
Section 5.2: (G) What are the most important input factors for the model?
16
1.6
Scope limitation
This section clarifies the decisions made in this thesis in order to maintain a structured and well defined research.
Country selection
Unilever Benelux consists of Unilever Belgium and Unilever Netherlands. In order to check whether these two markets can be aggregated to generate more data points a brief analysis is conducted on the comparability between the Dutch and Belgium markets. Unfortunately, the Belgium market differs too much from the Dutch market based on several aspects. A substantial part of the Belgium promotion market comprises of coupon promotions, while this type of promotion is rare in the Dutch market. Next to this, most promotions within the Belgium market are promoted on special displays and multiple items of a SKU are bundled together in a repack, sometimes even different SKU’s are bundled together in one repack. These factors are likely to cause a difference in promotions mechanism within the Belgium and Dutch market. Because of this difference the model will not benefit from a larger set of data points. Since the research is conducted from the office in Rotterdam, the Dutch market is chosen for this research to make data collection easier.
Retailer selection
Incorporation of all retailers in the research will lead to extensive data gathering and might decrease the quality of the analysis. Therefore, four retailers are selected based on the following criteria: promotion pressure, size of the retailer and the data availability (see Section 4.3). Promotion pressure is the percentage of the total demand volume of a retailer that arises from promotions. The size of the retailer based on the total demand volume is compared to the other retailers to indicate the importance of a retailer. The criteria promotion pressure and size of the retailer are important also because the larger they are, the more you can say about the promotions in absolute terms, since it will reflect a larger portion of the total promotional demand. In order to use the predictive model data is needed. The data availability differs for each retailers, therefore this is also one on the selection criteria.
Forecast Perspective
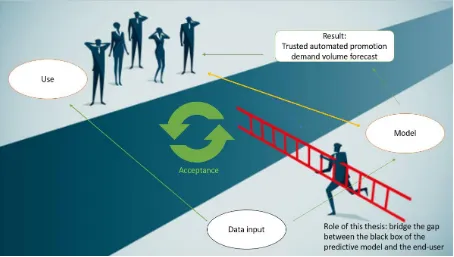
The aim of this study is to bridge the gap between the functionalities of the predictive model, what users define as black box, and the usability by users. Building on an existing model, the aim is to increase the forecast performance on micro level in order to convince users to use and internalize the model, thereby accepting the promotion forecasts.
The responsibility for the financial forecast is not within the Integrated Operations nor the Supply Chain department. Therefore, the focus of this research is on the demand volume rather than the demand value. The financial data and parameters, that define the profitability of product promotions, are assumed to be correct and used in the way they are. This research takes a supply chain point of view by focusing on demand volume. Therefore, the performance of the forecast is measured based on the key performance indicators (KPIs), forecast bias and forecast accuracy, which are used globally within each supply chain department of Unilever.
Business perspective
17 behave as shoppers at the different retailers, which is in this thesis also referred to as In-Market quantity. To illustrate, when forecasting the expected demand quantity in a promotion we look at the expected amount of products bought by consumers at the retailer. Next to this In-Market perspective there is the Ex-Factory and the Phasing perspective (see Figure 8) which are both not in scope for this research. The Ex-Factory perspective comprises the relation between Unilever as a manufacturer and the retailers. The Ex-Factory quantity is related to the predicted retailer behavior, the amount of products that are ordered by the retailer in order to supply their stores with products to sell to the consumers. The Phasing perspective covers the logistics part of the process, meaning to predict what amount of products needs to be delivered at which retailer at what exact week in time in order to have sufficient stock at the start but also during a promotion. Whereas in the In-Market perspective the focus is on forecasting the demand volume for an entire promotion. Promotions might last longer than one week.
Figure 8: Interaction between In-Market and Ex-Factory demand volume – (Syntetos et al., 2016)
Organizational perspective
The demand volume forecast for product promotions impacts the whole supply chain. However, from an organizational perspective the primary focus of this research is on the users working with the tool: CAMs, MTP, and the external company (VisualFabriq™). These users, CAM and MTP, are easy to approach, use the tool daily and have the most interest in a well-applicable model. However, the perspective in this research is from the users that are directly connected to using the predictive modelling tool for the volume forecast of product promotions. Secondary stakeholder is the Management. Management in this case is used as a collective term of all people involved with running the business on a strategic level. This is why from an organizational perspective the focus is on the users. Although the management will eventually also benefit from this research.
Data analysis and software usage
18 select performance measurement and to find the right forecasting model that fit the companies requirements.
Data input is briefly explained because it is a requirement for a well-performing model. The master data quality is out of scope, because it cannot be influenced in the limited amount of time available for this research. To support this research the software Python, JupyterLab, Minitab, Microsoft Excel and PowerBI will be used.
Practical requirements
Besides the scientific nature of this research, practical goals should be defined as well. The goals is to improve the applicability of a good performing forecasting model for Unilever Netherlands. Two sub goals are given to reach this goal.
➢ Ease of use
The forecasting model should be simple to use. Thus, a Unilever employee should not have to put much effort in using the model. This means that the improved interface of the tool should be clear and simple. Also, the output of the model should be easy to interpret. Semi-structured interviews within Unilever indicated that the results generated by the model should be understandable as well as the model itself, in order to increase the acceptance of the forecast of the model.
➢ Building on existing models
19
2.
Current system analysis
The aim of this chapter is to describe the current prediction process, the model and tool to forecast the promotion demand volume. It explains what a product promotion at Unilever comprises. The way of working at the start of this research is described as the initial situation in order to make a comparison with findings of this research described in Chapter 5.
[image:21.595.71.525.302.559.2]First, an overview of the relations between the forecasting model, data input and the user and its acceptance is given to enhance the readers understandability (see Figure 9). Essential for a good model is reliable data as input. In this case the data is partly entered by the user and partly loaded from multiple databases. Proper use and reliable data are key for the performance of the model. If the performance of the model matches their expectation users will accept the output of the model and thus use the model to predict the demand volume of promotions. Decent use of the model leads to more reliable data and more reliable model output. This loop of acceptance by the users will eventually result in an applicable and well performing model. These relations are illustrated in Figure 9.
20
2.1
Product promotion at Unilever
Unilever uses different types of promotions. E.g. the well-known buy one get one free (‘1+1 gratis’) during the ‘special promotion weeks’ at Retailer A or other retailers. Almost all promotions are price promotions; the consumer gets a reduced price in one or another form. But besides price promotions occasionally a promotion is in the form of a coupon or with a premiate or free product (e.g. discount for a theme park, free sample of a (new) product). The success of the different type of promotions is influenced by numerous variables (Van der Poel, 2010). Because of the high dependency on external factors only price promotions are taken into account in the model. These price promotions are described by Unilever as ‘Regular and Category promotions’ and include the mechanisms % discount, buy one get one free, single price discount, and buy X for Y. In a desired situation all of these variables are taken into account in the predictive model to forecast the promotional demand volume
The promotion mechanism is one of the characteristics of a promotion. Next to this, the CAM fills out several other parameters (see Figure 13 in Section 2.4) like number of SKU’s to include, whether the promotion will be displayed in the folder or gets extra space in the retailer store (2nd placement), in order to define a promotion. Based on these parameters and the available historical data the predictive model calculates the lift factor. Basically, the promotional demand volume is determined by the baseline demand multiplied by the lift factor, see formula 2-1.
𝐷𝑒𝑚𝑎𝑛𝑑 𝑣𝑜𝑙𝑢𝑚𝑒 = 𝐵𝑎𝑠𝑒𝑙𝑖𝑛𝑒 𝑣𝑜𝑙𝑢𝑚𝑒 ∗ 𝑙𝑖𝑓𝑡 𝑓𝑎𝑐𝑡𝑜𝑟 Formula 2-1
The baseline is the amount of products that are expected to be sold in a regular period of time without promotions. This baseline is forecasted based on statistics and actual demand in the past, the responsibility to check whether this amount of baseline makes sense is at the MTP. For example, when a product is seasonal (e.g. Unox, which has a high sale in the winter) the MTP has to check whether the model determines a corresponding seasonal pattern is the forecast (relative low baseline in the summer period and high in the winter). In this research the method of forecasting the baseline with regular demand is assumed to be good and not further investigated.
The lift factor can be seen as the expected increase in sales when a product is promoted. Theoretically this lift factor can be negative, but in practice this will never be the case. Because when the expected sales promoted product would be lower than in regular sales, the company simply decides not to promote that product.
21 Figure 10: Impact of a promotion on the demand volume. Source: www.eyeon.nl
2.2
Promotion planning process
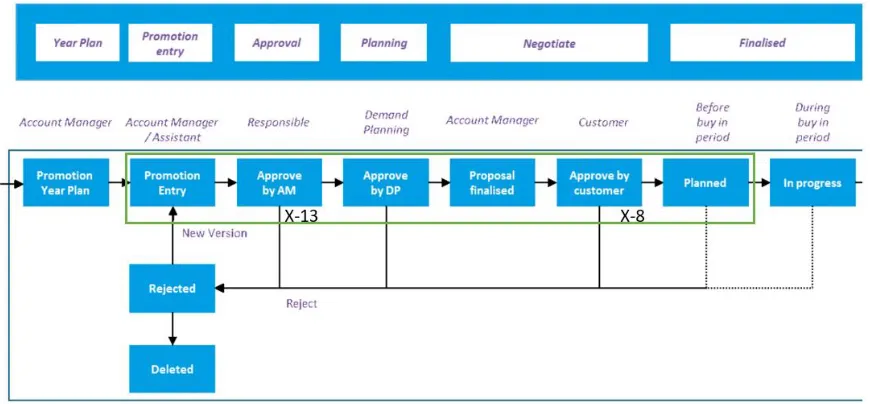
The promotion planning process steps are described in this section and is defined by the processes steps shown in Figure 11. Starting point is the promotion year plan which contains the promotion frequency for each product category, the year plan is determined at the end of the previous year. Within this interval pattern the account manager can determine the content of the promotions. The content of the promotion is characterized by its parameters, these parameters will be explained in Section 4.3.
Figure 11: Process flow of product promotions. Source: Visualfabriq Trade Promotion Master™
23
2.3
Current forecasting method
In cooperation with an external IT company the construction of the model was started in 2017 and is currently in the implementation phase. In this thesis the words ‘tool’ and ‘predictive model’ will be used for the model. This section briefly explains the current forecasting method in order to enhance the readers understandability.
The word tool is typically referring to the software environment and interface, developed by the external company in collaboration with Unilever, used by the users to for example fill out the parameters to describe a promotions characteristics. The model is able to forecast the demand volume based on several features using machine learning. The model is used to forecast the demand volume of promotions that will occur in the future, therefore it is called the predictive model. In this research the words predictive model and forecast model are interchangeable. Both the management and the users of the tool, define the operations of the model as a black box. Hence, a brief and elementary explanation of the predictive model is given for the ease of understanding.
The model is developed to predict the promo types that occur the most and show the most regular pattern. These promo types are ‘Regular’ and ‘Category’. The characteristics of these two promo types have the best fit with the predictive model. Because of their low variability in demand pattern and sufficient data availability. Other types are not eligible to forecast with the predictive model at the moment. Therefore only the promo types ‘Regular’ and ‘Category’ are selected at this stage. Users enter the data of these promotion types in the tool using a user interface. Based on this input data the predictive model makes it calculations and forecasts the demand volume of future promotions. The user is able to make adjustments to this forecasted volume based on experience and personal judgement. When the volumes are confirmed by the retailer they will be communicated to the factories upstream the supply chain. Ideally, after the actual volumes, based on scanning data, are received from an external company, the promotion should be reviewed by the users to check whether the planned promotion variables (e.g. volume or promotion mechanism) corresponded with the actual promotion variables. However, according to the S&OP Lead Manager, the extent to which a review is actually carried out is limited. The reason for reviewing the promotions is the learn from the adjustments and to eliminate undesired situations, like stock outs or incidents at a factory, from the data in order to train the model on proper data instead of those occurrences.
24
2.3.1 Performance measures at Unilever
The performance of the model output is measured using the Key Performance Indicators (KPIs) of the Supply Chain department within Unilever. These KPIs are forecast accuracy and forecast bias: The forecast accuracy is calculated by dividing the absolute difference at product level between the actual sales quantity and the forecast demand quantity by the actual sales quantity multiplied by hundred percent and subsequently subtracting all this from 1, see formula 2-2. The second part of this equation is in research referred to as the mean absolute percentage error (MAPE). The formula is as follows:
𝐹𝑜𝑟𝑒𝑐𝑎𝑠𝑡 𝐴𝑐𝑐𝑢𝑟𝑎𝑐𝑦 % = 1 – (𝐴𝐵𝑆(𝐴𝑐𝑡𝑢𝑎𝑙 𝑆𝑎𝑙𝑒𝑠 𝑞𝑢𝑎𝑛𝑡𝑖𝑡𝑦−𝐹𝑜𝑟𝑒𝑐𝑎𝑠𝑡 𝑑𝑒𝑚𝑎𝑛𝑑 𝑞𝑢𝑎𝑛𝑡𝑖𝑡𝑦)
𝐴𝑐𝑡𝑢𝑎𝑙 𝑆𝑎𝑙𝑒𝑠 𝑞𝑢𝑎𝑛𝑡𝑖𝑡𝑦 ∗ 100%
Formula-2-2
The Forecast Bias is calculated (formula 2-3) by subtracting the forecast demand quantity from the actual sales quantity and dividing this by the forecast demand quantity and multiply this all by hundred percent. The formula is as follows:
𝐹𝑜𝑟𝑒𝑐𝑎𝑠𝑡 𝐵𝑖𝑎𝑠 % = (𝐴𝑐𝑡𝑢𝑎𝑙 𝑆𝑎𝑙𝑒𝑠 𝑞𝑢𝑎𝑛𝑡𝑖𝑡𝑦−𝐹𝑜𝑟𝑒𝑐𝑎𝑠𝑡 𝑑𝑒𝑚𝑎𝑛𝑑 𝑞𝑢𝑎𝑛𝑡𝑖𝑡𝑦)
𝐹𝑜𝑟𝑒𝑐𝑎𝑠𝑡 𝑑𝑒𝑚𝑎𝑛𝑑 𝑞𝑢𝑎𝑛𝑡𝑖𝑡𝑦 ∗ 100% Formula 2-3
The forecast bias could be either positive, negative or zero. To calculate the forecast bias of a promotion the forecast bias of all underlying products is summed. In this way it might occur that a large positive bias and a large negative bias cancel each other out. A negative bias corresponds to the an over forecast, when the forecast demand quantity is larger than the actual sales quantity. A positive bias corresponds with an under forecast, when the forecast demand quantity is lower than the actual sales quantity.
2.4
Input data
The input data for the predictive model consist of two parts. First part is the internal and external data that are used by the model. The second part of input data is all the information provided by the users.
The first part, internal- and external data(bases) are used to be able to compare promotions with historical data and actuals. For example, scanning data from shopping behavior from consumers is bought from the external marketing database Nielsen to see what is actually sold by the retailers. Based on these actuals the performance of the predictive model is measured. In the current model, there is no automatic control whether a file is loaded or not. At the moment, one employee might have substantive knowledge about these data loads and performs these uploads manually. Absence of this employee or wrong timing affects the performance of the model. In that case it might occur that the comparison between the number of products predicted and the actuals are based on different timings. These dependencies create a need for automation of these data loads to ensure reliability.
The second part is a result of the information that the users filling parameters in the tool, see Figure 13 in Section 2.5. An example is the promo type, for example two products for the price of one. However, users lack knowledge regarding the impact of such parameters on the output of the predictive model. This lack of knowledge contributes to the perception that users see the model as a black box of which they have no understanding how it actually works. To take a step forward from this point three years of historical data is cleaned during this study, meaning checked to make sure all parameters are filled in correctly, in order to provide training data for the predictive model.
25 of a product to the correct product hierarchy level in order to be able to connect comparable historical sales patterns to the forecast of this new product. A product with a small change, for example a package change for washing powder, is assumed to have the same sales pattern as the same product in the previous package. Currently, these frequent changes in master data cause many errors in the forecast output. If a product history is not correctly connected the model considers this period as a stock out period, resulting in a large deviation from actual demand.
Together the section 2.3 Current forecasting method and 2.4 Input data form the basis of the predictive modelling tool. In Section 2.5 describes the users and the way they interact with this tool.
2.5 Use and acceptance
Three types of users are defined in this research. The Mid Term Planner (hereinafter shortened as MTP), the Commercial Assistant Manager (hereinafter shortened as CAM) and the ‘experts on the predictive model from Unilever’ (hereinafter referred to as super-users). The super-users are within the Integrated Operations department and have an admin role. The MTP is responsible for a correct baseline demand planning. The CAM is responsible for the promotion proposals and fills out the parameters (e.g. promo mechanism or number of products) that identify a promotion in the tool, see Figure 13.
When one encounters an issue it escalates it to the super-user without much effort in trying to find the cause of the issue. Super-users try to solve the issues that are raised by the users and focus on continuously improving the tool.
The CAM focuses on the output of the forecast model. In a way that the output is compared with historical data. This comparison is often done in a personal Excel file, personal expectations of the CAM, and retailers expectation. When the model output is obviously wrong, according to the CAM judgement, they will override this suggested output. When the CAM often has the feeling they should
26 override the suggested output they will start to distrust the capabilities of the model. Therefore, a CAM will rather use his/her personal way of working (e.g. separate Excel files).
Besides this, it is not only the output of the model that causes distrust also technical- and user issues cause distrust in using the model. Technical issues occur because the tool is still in the implementation phase and further developments are made continuously. CAM lack knowledge regarding the impact of parameters on the predictive model. Both MTP and CAM lack time and knowledge to be able to find the cause of the issues they raise towards super-users. Often, super-users have to spend a lot of time solving each individual issue because the CAM or MTP provides them with little guiding information. When encountering issues the CAM and MTP escalate this to the super-users. Therefore, super-users are busy trying to fix these issues reactively. While, the super-users should rather spend their time on fixing root causes and further improving the tool. These issues by the users can be divided into two groups. The first group are issues that are reported by the user to the super-users. The second group of issues are not reported by the user to the super-users, however users use a work-around for the process because they encounter some kind of issues with using the tool. For example, when the assortment of products in the tool is incomplete or when users have a bug while filling out the parameters.
At the moment, the predictive model is not fully incorporated in the way of working because users encounter errors working with the tool and the performance is low on micro level. As a consequence users work with their own workaround (e.g. Microsoft Excel). There is a mismatch in what the user expects the model to deliver and what it actually delivers is because there are a lot of exceptions which do not fit the model, yet. What these exceptions exactly are and how often they occur is not yet fully documented at this moment. It is also not known how to deal with these exceptions.
To conclude, as a result of the distrust of users in the model output they make manual adjustments based on their experience and knowledge. However, in order for the management to make the right decisions to achieve their targets the forecast needs to be true and free of biased behaviors and assumptions. Therefore, only by being truthful and honest in the forecasting practices can we really steer the business and achieve all our targets. The business must start to demand the best forecast no matter the provenance. In Chapter 3 we try to find the answers in literature to the sub questions from Section 1.5 given the current situation at the areas Model and Use explained in Chapter 2. In order to test alternative forecasting models in Chapter 5.
2.6 Root Cause Analysis
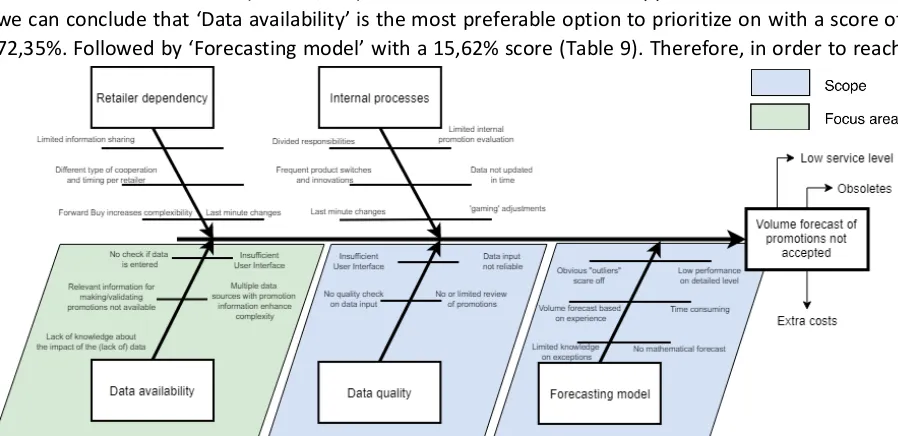
The goal of this analysis is to investigate the problem areas that have an impact on the promotional demand volume forecast and to define the focus of this research. Users distrust the volume forecast for promotions. Therefore, users do not accept the volume forecast of the predictive model. If users do not trust the outcome they will use a work-around which leads to a decrease in reliability of the input data for the model. Reliable data input and good use of the tool are essential for a good forecast accuracy. The forecast accuracy impacts the level of obsoletes, stock costs and service level. To give an example, if the volume forecast is too low, products will run out of stock, which affect the service level. And, if the volume forecast is too high, the surplus of products in stock will be higher which leads to higher stock costs and potential obsoletes. This stresses the importance of an accurate forecast.
27 the remainder of this research, the missing data and non-standard representation of the same data is represented by data availability, and wrong (noisy) data is interpreted as data quality. The research topic use and acceptance is clarified into business context by terms recognizable to the company: retailer dependency and internal processes.
Retailer dependency
It is up to the retailers how much and which information they share and in practice it is common that not all information (e.g. stock levels) is shared, mainly because of data sensitivity. Also, promotions at other retailers can result in last minute changes to the retailers promotions when the discount percentage at the competitor is higher.
Forward buy of retailers, the factor of additional products compared to actual sales in the promotion period, retailers order against promotional price, increases the complexity of the forecast. Because it leads to extra costs and less efficient promotions as the discount is given to retailer and not to the shopper. This makes the forecast harder for interpretation. This is one of the reasons that the focus of this research is on the In-Market perspective, looking at the actual scanning data of consumers.
Internal processes
Multiple teams are divided over the customers and are all working on forecast product promotions of their customer. There is no standard way of working and since information sharing between the customer teams is limited it evolves in multiple ways of working. The process flow (see Figure 11) is not always followed resulting in the right data is not available because it was not updated at the right time. Sometimes a CAM makes adjustments to the parameters of a promotion to reach a volume target or in consultation with the retailer. These adjustments affect the quality of the input data of the forecast model because it adds one-off information that you do not want to take into account in future promotion forecasts. Also, the timing of these judgmental adjustments are crucial to the model performance. Promotion volume forecasting is only one of the tasks of a CAM. This results in the fact that, when facing an issue, immediate escalating an issue without taking time to tackle the issue self. In a FMCG environment frequent changes of products occur, thus code and products-ids switched and not yet processed. These switches often lead to issues in the current prediction system.
Data availability
In order input a promotion multiple data sources need to be consulted for each promotion. This is a time consuming and user unfriendly process, which does not contribute to the use of the tool and therefore the forecast accuracy is affected. When entering a promotion in the tool many information has to be filled in, for which the user does not know what the impact will be of those particular part of information or the lack of information on the forecast accuracy. Users encounter many issues while working with the tool, both technical and user related issues. Alongside, users lack knowledge about the use and the output of the predictive model.
Data quality
28
Forecasting method
Until recently the forecasts are made by users based on experience without support from a mathematical model. With the implementation of the forecasting model and tool this forecasting process should become more automated. However, at the moment almost all promotions are still forecasted manually since the forecast generated by the model is not accepted by the users. The volume forecast is based on experience of the users rather than substantiated by data or statistics. This is why the current forecasting process is time consuming.
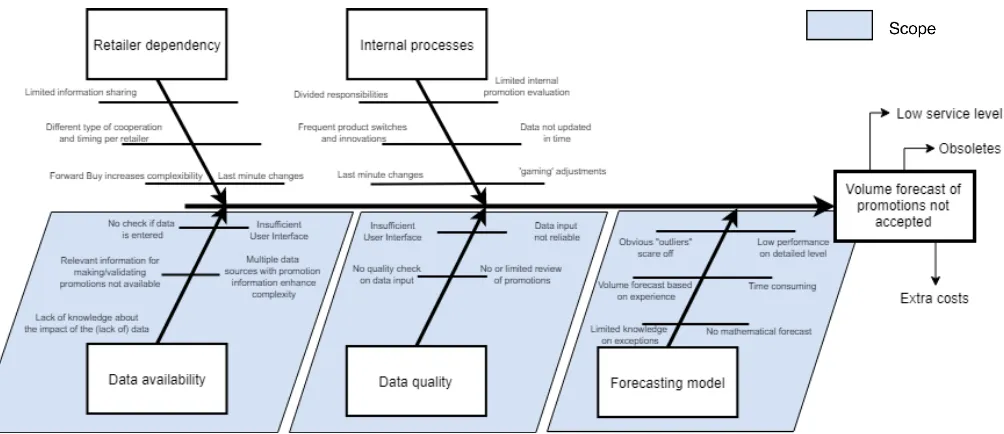
Conclusion of the root cause analysis
[image:30.595.55.557.406.623.2]To conclude this section, the areas ‘data availability’, ‘data quality’, and ‘forecasting model’ indicated in Figure 14 by the color blue are in scope for this research. Nevertheless, the other areas might also be improved by the outcome of this research but these problems are about organizational change which is hard to influence given the limited amount of time. It can be concluded that the current forecasting process is result oriented rather than process oriented, taking the time to find the cause and try to learn from it. If the predictive model tool is fully and correctly used througout the organization it would result in a data driven, one-version of the truth, regarding the volume forecast, which leaves less space for objective influence by the organization but saves a lot of time in the forecasting process. The next section will give a scientific background to this research by providing literature related to the problems. However, the time and the influence of this research is limited, Section 4.1 will therefore discuss the prioritization of these problems in order to determine which problem to solve first in order to gain the largest improvement on the forecast accuracy.
29
3.
Literature review
In this chapter, relevant scientific literature is discussed. The goal of this chapter is to get answers to the research questions from a scientific literature perspective. Therefore, Section 3.1 will give an introduction to the subject, where Section 3.2 will help to answer research question A: ‘what is the best forecasting method to forecast product promotions for a company like Unilever?’. Section 3.3 describes relevant scientific research that will be used in the methodology and analysis part of this study.
In more detail, this chapter starts with the definition of promotional forecasting in Section 3.1.1 Followed by the impact of accurate forecasts on the supply chain in Section 3.1.2. Section 3.1.3 describes the characteristics of a fast moving consumer goods company to give an idea about the environment of this study. Subsequently, Section 3.2.1 describes and elaborates the different type of forecasting methods relevant for this study. Based on related scientific research in Section 3.2.2 the forecast method for product promotions is selected. Section 3.2.3 gives more information on forecasting methods used by different fast moving consumer goods companies to answer research question A. Section 3.3.1 explains about the dependent and independent variables used in different studies. Section 3.3.2 explains two factors that need to be addressed when forecasting based on explanatory variables. Lastly, Section 3.3.3 describes which performance measures are commonly used in forecasting.
3.1 Literature on relevant topics
This section introduces the topics related to forecasting product promotions.
3.1.1 Promotional forecasting
Promotions, also referred to as trade promotions, include special pricing and sales incentives, discounted or free display fixtures, trade shows, demonstrations, and no-obligation gifts such as tickets to sporting events or novelties (pens, paperweights, calculators). Forecasting these trade promotions is called Trade Promotion Forecast (TPF) and refers to the process that seeks to discover correlations between trade promotion characteristics and historical demand, in order to arrive at an accurate demand forecasting for future promotion campaigns. Key to modelling promotion behavior is the ability to distinguish the increase in demand due to the impact of the trade promotion in contrast to the baseline demand without any promotions. The increase in demand due to the impact of trade promotions is called the lift factor.
Furthermore the lift factor as dependent variable can be transformed in multiple ways. There is no conclusive research on the performance of the different forms of the dependent variable (van der Poel, 2010). In this research lift factor represents the promotional demand volume divided by the baseline demand volume of a SKU. The advantage of using the lift factor as dependent variable in the model the promotional demand volume is standardized against the baseline volume. As a results, the absolute demand quantity height of a promotion has been removed from the predictive model equation.
30 Woensel, Broekmeulen, & Fransoo (2006) state that one of the success factors of a promotion is determined by the substitution effects (consumers switching between different products of the same category).
Besides evaluation of individual promotions, it is important to be aware of the fact that a higher number of promotions of a product positively affects the lift factor. Derks (2015) recommends to take the expected cannibalization of base demand into account and investigate the optimum number of promotions in order to maximize company profit.
Until the emergence of automated promotion planning methods, it was common practice for retail store managers to use the “last like” rule when ordering inventory for upcoming promotions. This means that they ordered the same quantity of products that was sold during a similar promotion in the past (Cooper, Baron, Levy, Swisher, & Gogs, 1999). Now, progress in technology offers better ways to handle the volume planning. Therefore, the reliance on the simple “last like” rule became inefficient (Trusov and Cooper, 2006)
3.1.2 Impact of an accurate forecast
This section describes the impact of an accurate forecast on the supply chain. Forecast accuracy can be described as the relative difference between a the forecasted number and the actual number. An increase in forecast accuracy will lead to a reduction in variability. A reduction of variability in consumer demand downstream the supply chain will decrease the bullwhip effect (Lee, Padmanabhan, & Whang, 1997). Therefore, lower safety stocks are necessary, resulting in less stock costs, less obsoletes, while maintaining a certain fill rate and customer relationship. The goal is to maximize the forecast accuracy while minimizing the total costs of amongst others executing the forecasting process. Kerkkanen (2008) states that knowing the role of forecasting and the impact of forecast errors create a basis for defining a realistic target for forecast accuracy, identifying the most important customers and products to be forecasted, and finding a suitable way to measure the forecasting performance. Next, including external information (e.g. market intelligence) can improve the demand forecast performance (Currie and Rowley, 2010) especially in fast changing environment. Like this research, most forecasting techniques and promotion models focus on forecasting future consumer demand. However, in his research Kerkkanen (2008) warns that there is a risk that unrealistic accuracy targets and fraudulent error measures are adopted if the environment is different. That is the reason why in the next section the forecasting environment of Fast Moving Consumer Goods is described.
3.1.3 Fast Moving Consumer Goods company characteristics
This section describes the characteristics of a Fast Moving Consumer Goods company from a supply chain perspective by focusing on the demand volume. Fast Moving Consumer Goods (FMCGs) are defined as products which are sold rapidly at relatively low costs. These products are necessities which a consumer buys within a short interval of time, without spending little of no effort on the purchase decision. According to Singh (2014), advertising and suggestions of friends and neighbors usually play a major role for trial of new FMCG products. In his research Adefulu (2015) states that, the heart of the FMCG business is the competition to attract consumers’ attention towards products or services. The prominent tool for attracting consumers’ attention towards products is product promotion (Chaharsoughi & Yasory, 2012). Therefore, the performance of promotion have major impact on the company’s market share.
31 at the lowest costs which is of great importance during promotions. Achieving the highest product availability at the lowest costs in combination with high volumes and high inventory turnover is a big challenge. Because of this, Unilever strives to deliver the right amount of products at the right time to the right customer at the lowest cost, which is only possible with an accurate forecast of the demand volume.
The FMCG segment is highly dynamic and innovative. The FMCG companies are under pressure to keep innovating their products, either the changing content or the package, in order to keep being attractive to customers. For the company these rapid pace of innovations and product changes have a large impact on the product life-cycle management. All product switches and changes must be recorded in order to keep track of the product development over time. Only if product development over time is recorded properly its data will be useful for forecasting the product demand in future promotions. For instance, when forecasting the demand of product A, the demand of similar products is compared in order to come up with a decent forecast for product A. When the package of that product A is slightly changed you might still rather want to forecast its demand based on comparable products to product A instead of forecasting the demand of this ‘new’ product, without any historical data. The latter will be much harder to forecast, because there is no prior data to base the forecast on.
Consumer demand patterns of FMCG at different channels are driven by different factors (Shankar, Inman, Mantrala, Kelley, & Rizley, 2011). Therefore, it is important to develop separate demand forecasts by channel. Accurate demand forecasting in each channel is also critical to managing the business and expectations of managers (Shankar et al., 2011).
3.2 Literature for answering research questions
This section describes the literature that helps to the research questions.
3.2.1 Forecasting methods
Given the high inventory turnover, frequent product changes within a FMCG company and the desire to forecast the promotional product demand volume this section describes forecasting methods that might be applicable.
Before making the connection between forecasting methods and the FMCG characteristics a general overview of the different forecasting methods is given, see Figure 15. A common distinction for forecasting models is subjective or objective. At which a subjective forecasting methods is made qualitatively based on human judgement, objective forecasting methods are made quantitatively based on data analysis (Fildes, Goodwin, Lawrence, & Nikolopoulos, 2009; McCarthy, Tsinopoulos, Allen, & Rose-Anderssen, 2006).