A framework to select and assign a CODP and
corresponding inventory control policy to the different end
products in food processing industry
The framework consists of two models: a multi-criteria inventory classification and a 0-1 integer linear programming (ILP) model. Both models assign a CODP
and corresponding inventory control policy to the different end products by considering perishability, service levels, and inventory capacity. A (r, Q)
inventory control model is used to consider inventory capacity. The results of both models are compared. Moreover, a tool is made from the framework,
so the company can reuse the framework easily.
Lieke Ebrecht
Master Thesis
MSc Industrial Engineering & Management Production & Logistics Management
University of Twente
A framework to select and assign a CODP and corresponding
inventory control policy to the different end products in food
processing industry
Master Thesis
Industrial Engineering & Management Production & Logistics Management
Name: Lieke Ebrecht Student Number: S1490796 Phone number: +316-10324669
July 23, 2019
Supervisors of University of Twente:
Dr. E. Topan Faculty of Behavioral Management and Social Science Phone number: +31 53 489 3143
Dr. I. Seyran Topan Faculty of Behavioral Management and Social Science
Information of food processing company:
Management summary
This research is conducted at the supply chain department of a food processing company. The company, located in the Netherlands, is a production company that produces food. The companies producing food have to consider the enormous growth and changes in the market. The food processing company has to meet a service level of 99% to satisfy her customers, while cost have to be reduced. Therefore, to be able to be competitive, striving for an optimal supply chain is required for the food processing company. However, the supply chain of the food processing company is not optimal; the service levels are below target and the costs can be reduced by one third by balancing the inventory. To fulfill this aim, the food processing industry started with the implementation of the forecasting and inventory management system called Slimstock. The basis for a well-functioning system is having the correct values of all inputs, which is missing at the moment. Since the inventory management part of the system is new, the inputs related to the inventory management, which includes the CODP determination and the inventory control policy for each item, are the important ones. We focus on the end products, since starting from the customer viewpoint, the demand of end products is most important, and therefore the start point. Moreover, in food processing industry, perishability of items is most challenging. Therefore, this research focuses on the fresh end products from the food processing industry. Therefore, this research answers the following main research question:
How can a framework that selects and assigns a CODP and corresponding inven-tory control policy to different end products in food processing industry be created and implemented?
stock is built. This results in suboptimal service and inventory levels. Moreover, the make-to-order/make-to-stock decision is only based on demand and best before date, while in a food processing company other criteria can also be important as well, like the limited inventory capacity. The CODP partition is crucial as input for Slimstock, since Slimstock does calculations based on these inputs to decide how much and when production will take place to fulfill the customer demand in time. Moreover, an optimal partition of the make-to-order/make-to-stock items provides cost reduction in inventory while the delivery reliability will be met (van Donk, 2001). Concluding, an optimal determination of the CODP and corresponding inventory control policy adds value in implementing Slimstock to improve the service levels and reduce the cost.
To be able to answer the research question, we review literature on CODP decision in food processing industries, multi-criteria inventory classification, and inventory control models that consider perishability. Reviewing inventory control models is needed to be able to consider the limited inventory capacity. By using an inventory control model, the inventory space needed for all items can be calculated by finding the optimal parameter values. Note that the sum of the inventory space needed for all make-to-stock items has to be lower than the maximum inventory capacity. The inventory control model has to match the inventory control model that uses Slimstock to get equivalent policies.
In order to select and assign a CODP and corresponding inventory control policy
to different end products, a framework is designed. The flow diagram of the
The framework contributes to the literature, since the literature lacks a user-friendly quantitative model to decide the CODP of item in the food processing industry. The framework contains a ranking method and an inventory model that come from the literature. To take into account meeting a service level, we add a service level constraint to the inventory model. The 0-1 ILP model is made by ourselves.
Due to the constantly changing environment the framework is implemented in Excel by using Visual Basic for Applications (VBA) to be able to reuse the frame-work easily. The results from both models can be produced by using this tool. Employees only have to insert the needed data and press the button to get the solution. Therefore, the tool is user-friendly.
To check whether the framework meets the requirements and specifications, we verify the proposed tool by running analyses on the limited inventory capacity, ranking method, and the normal distribution approximation used in the inventory model. In all cases, the proposed tool meets the requirements and specifications. Moreover, to check whether the model fulfills its intended purpose, we validate on the policy parameters and classifications. We validate by asking expert opin-ion and putting the current situatopin-ion in the 0-1 ILP model. Finally, although we use indications for all cost parameters, since details are too confidential, the average space needed per item seem not far from reality and the classifications make sense. Unfortunately, another validation method is not possible, since the project about implementing new supply chain systems is behind schedule, which means that Slimstock is not implemented yet. Moreover, unfortunately, Slimstock does not have a test environment, and the current planning system does not have the required data.
When comparing the ranking model to the 0-1 ILP model, we can conclude that, even though the 0-1 ILP model is not entirely exact, the 0-1 ILP model is still better than the heuristic approach, which refers to the ranking model. In case of the 0-1 ILP model, the total cost per year and overall service level is equal to
e17,785,066 and 94%, respectively. In case of the ranking model, the total cost
per year and the overall service level are, respectively, e4,132,879 higher and 8%
lower. Note that the cost and service levels are based on the framework and not based on the real world. In addition, based on the classification, the 0-1 ILP model classifies better. Moreover, the total computation time from the 0-1 ILP model is equal to 5 minutes and is, thereby, twice as fast as the ranking model.
cases. Therefore, it is crucial to consider the criteria selection and make good assumptions.
We compare the results of the proposed tool to the current situation by putting the current situation in the 0-1 ILP model. Note that, unfortunately, putting our suggestions in Slimstock is not possible. The results of both models are better than the current situation. The total costs per year in case of the ranking model and the 0-1 ILP model are, respectively, 24% and 29% lower than in the current situation. The overall average service level in case of the ranking model and the 0-1 ILP model are, respectively, 2.4% and 13.3% higher than in case of the current situation.
Concluding, the results of the proposed tool have a positive impact on the service level and total cost per year. By feeding Slimstock with the suggested CODP and corresponding inventory control policy for each end product, the service level will be improved and the cost will be reduced by balancing the inventory. By using the 0-1 ILP model, the target values of the supply chain key performance indicators will be reached; the make-to-stock items will have a service level of 99% and the cost will reduced by 29%, which is equal to one third. In addition, the overall average service level is equal to 94%. Note that the overall average service level can never reach the 99% in the proposed framework and may be higher in real case, since we use a standard deviation of the lead time of the make-to-order items of one day to cover some uncertainties, which means that the service levels of the make-to-order items may be higher in real case. Note also that the accuracy of the values of the input is a strict requirement of the 0-1 ILP model. In case of doubt about the accuracy of the values of the input, we recommend to run both the ranking model and the 0-1 ILP model and compare and evaluate the results.
Acknowledgements
This thesis is the final result for completion of the Production & Logistics
Man-agement specialization of the Industrial Engineering and Management Master’s
degree at University of Twente. I am glad to get the opportunity to conduct my research at the food processing company. Therefore, I would like to thank the food processing company for this opportunity. Especially, I would like to thank my supervisor for his guidance and the great collaboration. In addition, I would like to thank all my colleagues for the great time and their helpfulness.
Moreover, I would like to thank my first supervisor from University of Twente Engin Topan for the helpful meetings, valuable feedback, and support. I would also like to thank my second supervisor Ipek Topan for her feedback and support in the last stages of the project.
I wish you a lot of pleasure in reading my Master Thesis.
Lieke Ebrecht
Contents
Management summary i
Acknowledgements vi
List of figures vii
List of tables viii
List of Abbreviations x
1 Introduction 1
1.1 The food processing company . . . 1
1.2 Research motivation . . . 2
1.3 Problem statement . . . 2
1.4 Scope and limitations . . . 6
1.5 Research objective . . . 7
1.6 Research questions . . . 8
1.7 Deliverables . . . 10
2 Context analysis 11 2.1 Supply chain of food processing company . . . 11
2.2 The supply chain planning tool (systems) . . . 12
2.3 Make-to-stock and make-to-order items . . . 13
3 Literature review 15
3.1 Determination of CODP in food processing industry . . . 15
3.2 Multi-criteria inventory classification . . . 19
3.3 Parameter setting of inventory control policies in food processing industry . . . 22
4 Solution design 25 4.1 Step 1: Ranking end products . . . 26
4.2 Step 2: Match existing CODP’s with inventory control policies . . . 30
4.2.1 Existing CODP’s . . . 30
4.2.2 Match existing CODP’s with inventory control policies . . . 31
4.3 Step 3: Finding parameter values of the (r, Q) inventory control model . . . 32
4.4 Step 4: CODP and inventory control policy assignment . . . 36
4.4.1 Step 4a: Solving by using the ranking model . . . 36
4.4.2 Step 4b: Solving by using the 0-1 ILP model . . . 37
5 Solution test 40 5.1 Model test . . . 40
5.1.1 Data used . . . 40
5.1.2 Verification and validation . . . 41
5.1.3 Results . . . 49
5.1.4 Sensitivity analysis . . . 52
5.1.5 Comparison of proposed framework to current situation . . . 58
5.2 Evaluation . . . 59
6 Conclusions and recommendations 62
6.1 Conclusion . . . 62
6.2 Recommendations . . . 64
6.2.1 Implementation Plan . . . 66
6.3 Further research . . . 67
References 68
Appendices 70
A Comparison of ranking model to ABC classification
B Results
B.1 Results of ranking model . . . .
B.2 Results of 0-1 ILP model . . . .
C The tool
D Sensitivity analysis: criteria selection of ranking model
List of Figures
1.1 The ideal balance of coverage . . . 3
1.2 The balance of coverage of the food processing company . . . 4
1.3 Problem cluster . . . 6
2.1 Schematic supply chain of the food processing company . . . 11
4.1 Flow diagram of proposed framework . . . 25
4.2 Rough process of food processing companies . . . 31
4.3 CODP’s at the food processing company . . . 31
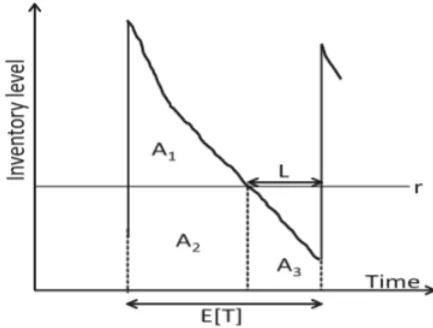
4.4 The expected inventory level . . . 35
4.5 Pdf of lead time of make-to-order items . . . 39
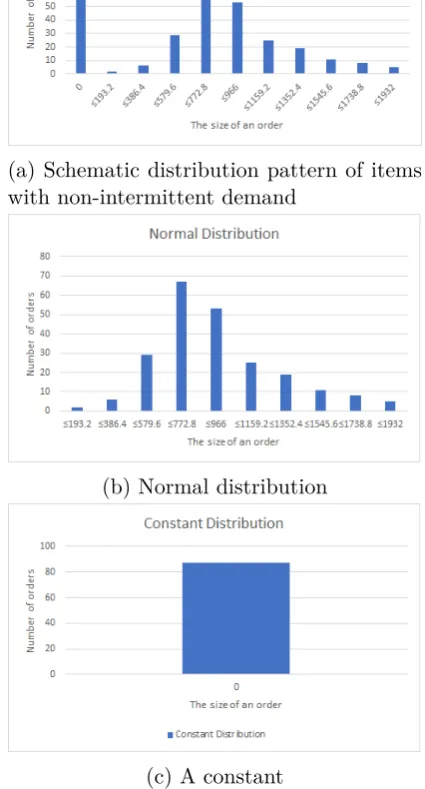
5.1 Demand distribution . . . 44
5.2 Manual of the tool . . . 50
5.3 Sensitivity analysis: Criteria selection . . . 53
5.4 Sensitivity analysis: lost sales cost . . . 55
List of Tables
1.1 Average service level . . . 3
2.1 Make-to-order/make-to-stock matrix . . . 13
2.2 The number of make-to-order and make-to-stock end items at the food processing company . . . 13
3.1 Important criteria affecting make-to-stock/make-to-order decision . 17 3.2 Comparative study from Douissa and Jabeur (2016) . . . 22
3.3 Existing inventory control policies . . . 23
4.1 Selected CODP’s and matching inventory control policies . . . 31
4.2 Visualization of results by using step 4a . . . 36
4.3 Visualization of results by using step 4b . . . 39
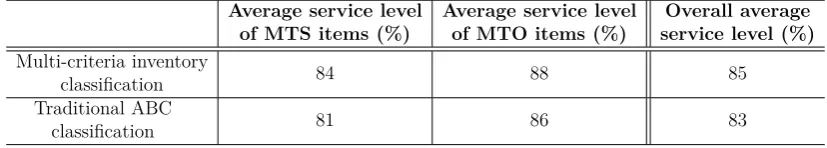
5.1 Service levels in case of multi-criteria inventory classification and traditional ABC classification . . . 43
5.2 Validation: the average inventory per item from the current situa-tion and the proposed model . . . 45
5.3 Summary of results of ranking model . . . 47
5.4 Summary of results of 0-1 ILP model . . . 47
5.5 Total cost per year and average number of pallets in stock in case of the ranking model and the 0-1 ILP model . . . 50
5.8 Sensitivity analysis: lost sales cost- number of make-to-stock and make-to-order items . . . 54
5.9 Sensitivity analysis: standard deviation - number of make-to-stock
and make-to-order items . . . 56
5.10 Total cost per year and average number of pallets in stock of both models and current situation . . . 58
List of abbreviations
Integer linear programming ILP
Analytic Hierarchy Process AHP
Lot for Lot L4L
Make-to-order MTO
Make-to-stock MTS
Stock Keeping Unit SKU
Chapter 1
Introduction
The market in which the food processing company acts, is growing rapidly. In the Netherlands, over the last five years the market has grown by 12% and the expected growth is 6% and 8% in 2018 and 2019, respectively. Besides, due to a change in customer demands over the last decade, food processing industries have to deliver a greater variety of products and have to meet higher logistical demands, while keeping costs as low as possible (van Donk, 2001). Therefore, the companies producing food have to consider the enormous growth and changes in the market to be able to be competitive.
To be able to be competitive, striving for an optimal supply chain is required for the food processing company. However, the food processing company observes inefficiencies in the supply chain. Therefore, this research is about improving the supply chain. In more detail, the research is about setting the right values for the input parameters needed for the inventory management planning systems. According to Nagib (2016), inventory management is vital in the food and beverage processing industry as it involves the perishability of the items despite the costs.
This chapter introduces the research subject and elaborates the research plan. Section 1.1 introduces the food processing company. Section 1.2 and section 1.3 describe the research motivation and the problem description, respectively. In section 1.4 the scope and limitations of this research will be described, followed by the objective of this research in section 1.5. Finally, section 1.6 and 1.7 represent the research questions and the research plan, and the deliverables of this research.
1.1
The food processing company
1.2
Research motivation
Starting from 2017, the supply chain manager observed an inefficient supply chain. The service levels are lower than the target service levels due mainly to missing end products. According to him, the performance of the supply chain can be
improved. Therefore, in 2017, the food processing company started with the
optimization of the supply chain. Especially, the food processing company focused on the development of the supply chain planning tool. In the end of 2018, some new supply chain systems, i.e. the forecasting and inventory management system (Slim4) and the planning system, were introduced to improve the supply chain performance. Working with these systems provides for further automation of the supply chain. Determining, filling and maintaining the input of these supply chain systems are essential for functioning properly. At the moment, the food processing industry is in the middle of the transition. The next step is to give the systems the right input.
To date, the database used for the systems contains several inputs per semi-finished products and end products. The database is not up to date and unclear with regards to the necessary inputs. Besides, the supply chain manager knows for sure that many inputs are based on common sense rather than data. What the supply chain manager actually wonders is: which semi-finished products and end products need which inputs and how can these inputs be determined to get well-functioning systems?
Because of the supply chain performance improvement project with regards to the supply chain systems, determining, filling and maintaining the input is essential for a well-functioning system. Well-functioning systems will lead to a stronger supply chain and a stronger supply chain influences the companies success indirectly. Therefore, determining the needed inputs is essential to let the project succeed.
1.3
Problem statement
Table 1.1 represents the average service level in 2018 and 2019, respectively. Due to the market requirements, the food processing company has to meet a service level of 99% per item to be able to be competitive. In all situations, the average service level is below the 99%. Note that these service levels are based on all kind of sales items, i.e. bulk, frozen, and fresh items.
Table 1.1: Average service level
2018 2019
Service level 93% 95%
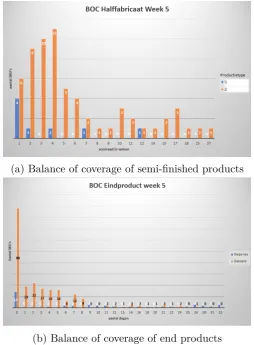
The food processing company measures the inventory on hand by using the bal-ance of coverage. Figure 1.1 represents the ideal balbal-ance of coverage, with the number of items on the y-axis and the number of weeks in inventory on the x-axis. The number of weeks in inventory represents the on hand inventory expressed in weeks. There exists an ideal number of weeks in inventory for each item. For the food processing company, the ideal number of weeks in inventory of the semi-finished and the end-products is equal to three weeks and two days, respectively. When the number of weeks in inventory is lower or higher than the ideal, the food processing company will face backorders or the shelf-life of the items will be exceeded. Naturally, there are always several items that deviate from the ideal number of weeks in inventory for several reasons. Keep in mind that this is an average measure rather than an exact measure. When the balance of coverage follows a normal distribution with a mean equal to the ideal number of weeks in inventory, the total inventory of the food processing company is balanced.
Optimal
Number of weeks in inventory
Num
b
er
of
SKU’s
Figure 1.1: The ideal balance of coverage
[image:19.595.171.425.455.596.2]quantities on stock. Most notably, the balance of coverage of the semi-finished products shows a peak at four weeks and a reasonable number of SKU’s are in stock for longer than ten weeks, and the balance of coverage of the end-products shows a peak at zero days. The reason for the last observation have many reason, e.g. the optimal quantity for certain items are not in stock. In summary, the number of semi-finished products and end-products in stock can be balanced and reduced.
(a) Balance of coverage of semi-finished products
(b) Balance of coverage of end products
Figure 1.2: The balance of coverage of the food processing company
Concluding, both performances can be improved. The current average service level is below 99% and the total cost can be reduced by balancing the inventory. Imple-menting the new planning systems have to improve this performance. However, the new planning systems have to function properly to support increased service level and reduce the costs.
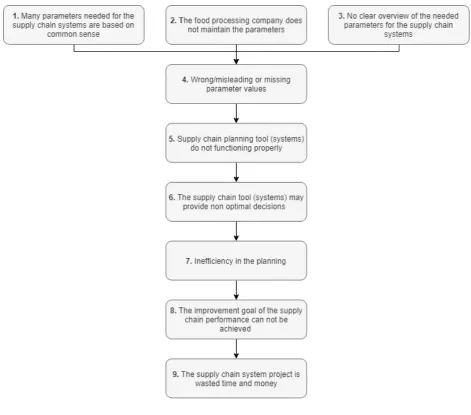
[image:20.595.170.425.193.539.2]this case the forecasting and inventory control system (Slim4) and the planning system, are based on common sense [1]. The make-to-order/make-to-stock decision is an example of a common sense-based input. Determining the inputs based on calculations gives much more certainty and will improve the performance of the supply chain, since the right ones will be on stock with the optimal quantity, which ensures that the service levels will be met and the cost will be reduced. In addition, at the moment, the food processing company does not maintain the inputs [2], while elements in the supply chain are constantly changing due to the growth impact. Therefore, once the inputs are determined, maintaining the inputs is essential to keep the correct values of the inputs. Moreover, there is no clear overview of the needed inputs [3]. These three problems result in wrong/misleading
or missing inputs [4]. The basis for a well-functioning supply chain planning
system is missing, which leads to a system that is functioning improperly [5]. And therefore, the supply chain planning systems may not provide the right optimal decisions but rather suboptimal decisions, which create inefficiency in the planning [6]. Because of inefficiency in the planning, the supply chain performance goal, which is explained above, can not be achieved [7]. Moreover, the implementation of the new systems risk to be wasted time and money [8].
Figure 1.3: Problem cluster
1.4
Scope and limitations
[image:22.595.87.559.79.494.2]Donk, 2001), which results in an improvement of the supply chain.
To be able to conduct this research within the restricted time, this research is only limited to the inputs mentioned above.
In addition, the food processing company has multiple levels on which inventory can be held. These are the raw material level, intermediate level, and the finished product level. Starting from the customer viewpoint, the demand of end products is most important and therefore the start point. The decisions on the finished product level will then influence the other levels. Therefore, this research is limited to the products on the finished product level, from now called the end products. Note that there are also products at the intermediate level that are directly sold to the customer. These products are the purchase products and products that are sold in bulk. These products are out of this scope of this research.
Furthermore, an important aspect of this research is the perishability of products in food processing industries, which makes this research unique and challenging. We define a perishable item as one that has constant utility up until an expiration date (which may be known or uncertain), at which point the utility drops to zero (Nahmias, 2011). The end products of the food processing company can be divided in fresh and frozen products. This research is limited to the fresh products, since frozen products have nothing to do with perishability of products, and therefore frozen products have to be treated differently. So from now on, when we talk about end products or items, we mean the fresh end products at the finished product level.
1.5
Research objective
Concluding from the above sections, the main objective of this research is to im-prove the supply chain by implementing a new framework to select and assign a CODP and corresponding inventory control policy to the different end products in food processing industry. These will be inputs for the forecasting and inventory control system Slimstock. The supply chain system will then have the correct inventory management inputs, which will lead to an improvement in the produc-tion and packaging planning. Because of the fact that the planning is responsible for the balanced inventory level and the customer service level, an improvement in the planning provides an improvement in the supply chain performance. By selecting and assigning CODP’s and corresponding inventory control policies, we have to consider the perishability of items and the limited inventory capacity in food processing industries, which are the challenging aspects of this research.
We define the research objective as:
in food processing industry to improve the supply chain performance by increasing the customer service level, and reducing the cost by balancing the inventory indirectly.
Note that the framework will not increase the service level and reduce cost di-rectly, since the result of the framework is input for the inventory control and planning system Slimstock, and Slimstock will improve the supply chain perfor-mance. Many other aspects than just the result of our framework will ensure for a well-functioning system, and the well-functioning system ensures for an improve-ment in the supply chain.
1.6
Research questions
To reach our research objective, we will define the main research questions followed by sub research questions.
We define the main research question as:
How can a framework that selects and assigns a CODP and corre-sponding inventory control policy to different end products in food processing company be created and implemented?
To answer the main research questions, the following sub research questions are defined.
1. What is the current forecasting and planning system at the food processing
company?
a. How is the supply chain organized and how does the supply chain
per-form?
b. What end products are produced according to a to-order,
make-to-assembly or make-to-stock strategy, and how is this determined?
c. Which inventory control policy is used?
Chapter 2 elaborates the current situation at the food processing company. In order to gain insight in the current situation, the supply chain and the forecasting and planning systems used will be explained first. Thereafter, we discuss the current selection of to-order, to-assembly, and make-to-stock products at the food processing company. Finally, the inventory control policy used is discussed.
2. Which methods are available in the literature to select and assign a CODP
a. Which methods are available in the literature for CODP determination in the food processing industry?
b. Which methods are available in the literature for multi-criteria
inven-tory classification in the food processing industry?
c. Which methods are available in the literature for parameter setting of
the inventory control policies considering perishability?
Chapter 3 represents several literature reviews. Firstly, a literature review on the CODP decision in food processing industry is performed to be able to select and assign inventory control policies. This literature review pro-vides a useful framework to select and assign both the CODP and inventory control policy to the products. To use this framework in the food processing industry, some adjustments have to be done. Therefore, a literature review on multi-criteria inventory classification is performed to consider perishabil-ity of products, followed by a literature review on parameter setting of the inventory control policies considering perishability of products to be able to deal with limited inventory capacity in food processing industries.
3. How can a framework be built to select and assign a CODP and corresponding
inventory control policy to different end products in food processing industry?
a. How can the multi-criteria inventory classification to rank the products
be applied in food processing industry?
b. How can inventory control policies be matched with the existing CODP’s
in food processing industry?
c. How can the parameter values of the given inventory control policies be
determined considering the perishability of products?
d. How can the CODP’s and the corresponding replenishment policies
as-signed to the end products considering limited inventory capacity in food processing industry?
Chapter 4 describes the proposed framework to assign a CODP and cor-responding inventory policy to different end products in food processing industry. The framework consists of two different approaches: one approach by using multi-criteria inventory classification and the other by using an 0-1 ILP model. The framework will be implemented with both approaches and then the models will be compared.
4. How can the proposed framework be applied to the food processing company?
5. What is the effect of implementing the proposed framework on the
perfor-mance of the supply chain of the food processing company?
model, sensitivity analysis, and model comparison to the current situation. Moreover, we evaluate the model. In the end, a conclusion is drawn.
Finally, chapter 6 provides conclusions and recommendations for the food processing company.
1.7
Deliverables
Chapter 2
Context analysis
This chapter elaborates the current situation at the food processing company, and
answers therefore the first sub question: "What is the current forecasting and
plan-ning system at the food processing company?". Section 2.1 represents the supply chain of the food processing company. Section 2.2 describes the systems used by the food processing company to make their production and packaging planning. Finally, section 2.3 elaborates which product is either produced according to a make-to-order or make-to-stock strategy.
2.1
Supply chain of food processing company
Section 1.3 already described the performance of the supply chain. In this section the supply chain of the food processing company will be explained. Since the detailed supply chain of the food processing company is confidential, a compre-hensive supply chain is represented. Figure 2.1 represents the supply chain of the food processing company.
Figure 2.1: Schematic supply chain of the food processing company
First, the raw materials go into production. The produced products will be stocked at the intermediate stock point. These products will be packaged and stocked
at the finished stock point. As can be seen, food processing companies have
[image:27.595.112.489.555.603.2]The food processing company has a low inventory capacity of the end products compared to the production capacity of packaging. Therefore, the inventory ca-pacity of the end product is a bottleneck.
In summary, making decisions in end products inventory influences the decision making in all other inventory points. In addition, in contrast to the other outgoing products, the flow of the end products is complex, i.e. the perishability of products play a role. Moreover, end products provide by far the largest part of the total sales. Concluding, end products inventory is the most critical one, and therefore this research is limited to the end products.
2.2
The supply chain planning tool (systems)
The supply chain planning tool allows the food processing company to make an effective and efficient production and packaging planning. The food processing company uses three different systems to make their production and packaging planning. These systems are the ERP system, Slim4, and a custom made planning tool. The ERP system is the database of the food processing company. This system contains all information about the several products, suppliers, customers, etcetera. Slim4 software is a system designed by the company Slimstock. Slim4 provides input, like forecasting of the demand, for the custom made planning tool. The custom made planning tool is the planning system designed by the food processing company herself. At the moment, based on the forecast from Slimstock and inventory position from the ERP system, the planners decide how much and when products have to be produced and packaged with help of the custom made planning tool. The decisions are based on common sense, which leads to ineffectiveness and inefficiency. Therefore, the food processing company has decided to choose for an updated Slimstock system and switch to another planning system to prevent (human) error. Slim4 will be updated to be able to calculate how much and when should be produced and packaged, and the planning system will be a more user-friendly, effective, and efficient planning system. At the moment, the food processing company is in the middle of the transition.
inputs are the subjects of this research.
2.3
Make-to-stock and make-to-order items
The custom made planning tool represents whether an item is produced according to a make-to-order or make-to-stock strategy. The make-to-order/make-to-stock decision is based on the demand and the best before date of an item. Figure 2.1 represents the matrix of the make-to-order/make-to-stock decision at the food processing company. Finally, this decision is based on common sense, since an item with a high demand and short best before date (and vice versa) the food processing company has to made the CODP decision on common sense.
Table 2.1: Make-to-order/make-to-stock matrix
Best before date
Short Long
Demand
Low MTO MTO/MTS
High MTO/MTS MTS
Table 2.2 represents the number of make-to-order and make-to-stock end items at the food processing company. 201 and 23 end products are make-to-stock and make-to-order items, respectively.
Table 2.2: The number of make-to-order and make-to-stock end items at the food processing company
Item Make-to-stock Make-to-order Total
End products 201 23 224
However, some data does not match with the strategy of the item. Having make-to-stock items not in inventory is an example of a mismatch. The food processing company has many stock items not in inventory, while a few make-to-order items are in inventory. The reason for this is that due to creating a planning on common sense, the planners use a hybrid make-to-order/make-to-stock system per item. Based on forecast, inventory position, and real order of the upcoming weeks, planners decide how much and when will be produced or packaged. In this way, an item is never entirely a make-to-order or a make-to-stock item.
the best-before date. Moreover, the make-to-order/make-to-stock decision is only based on demand and best-before date, while in a food processing company other criteria can also be important as well. Therefore, the make-to-order/make-to-stock partition can be improved. An optimal partition of the make-to-order/make-to-stock items provides cost reduction in inventory while the delivery reliability will be met (van Donk, 2001), which is exactly the purpose of this research.
2.4
Inventory control policy used
Chapter 3
Literature review
This chapter represents several literature reviews, and answers therefore the second
sub question: "Which methods are available in the literature to select and assign a
CODP and corresponding inventory control policy to different end products in the food processing industry?". Section 3.1 provides a literature review on the CODP determination in food processing industry in order to select and assign inventory control policies to the different end products. This literature review provides a useful framework to select and assign both CODP’s and replenishment policies. To use this framework in food processing industries, the framework needs some adjustments. Therefore, section 3.2 represents a literature review on multi-criteria inventory classification, followed by a literature review on parameter setting of the inventory control policies considering perishability of products to be able to deal with limited inventory capacity in food processing industries.
3.1
Determination of CODP in food processing
industry
Before getting into the CODP determination, the main characteristics of a food processing industry have to be considered (Soman et al., 2002). The characteristics are described below.
1. Plant characteristics
- Extensive capacity of the shop floor with oriented flow design
- Extensive cleaning times and sequence dependent setup times differ
among products
2. Product characteristics
- Variety of quality as well as supply for raw materials
- Limited shelf life for its raw material, semi-finished product, and
fin-ished product
- Using either volume or weight as the unit of measure
3. Production process characteristics
- A variable yield and processing time for its processes
- A divergent flow structure
- Multiple recipes for a single product
- Labour intensive at the packaging stage and not at the processing stage
- The capacity determines the production rate
of the M/G/1 queuing model. Using numerical experiments, a cost analysis is performed. Soman et al. (2002) review the state-of-the-art in the area of com-bined make-to-order/make-to-stock production and introduce a general framework to decide on the main problems in managing a combined make-to-order/make-to-stock system in food processing. Sun (2008) provides a mathematical model which decides whether a product has to be make-to-order or make-to-stock. The objec-tive function is the minimization of the supply chain network cost subject to the required customer delivery time. However, this model does not consider the per-ishability and demand volumes. Perona et al. (2009) presented a new, easy-to-use and sufficiently straightforward decisional framework to propose a rational and quantitative inventory planning approach which retains its usability in practical environments. Although the framework does not optimize any explicit objective function, the framework supports a large amount of decision-making with quan-titative and rational methods and bridges the theory-practice gap. However, the framework does not consider the perishability and available capacity.
Next to all models discussed in the papers, all papers mention characteristics which influence the CODP determination. A summary is represented in table 3.1. Based on these criteria a CODP determination can be made.
Table 3.1: Important criteria affecting make-to-stock/make-to-order decision
Product-related criteria Firm and process-related criteria
Cost of each item Demand variability
Risk of obsolescence and perishability Volume of demand
Holding and backordering cost Predictability of demand
Controllability Delivery lead time (and variance)
Specificity (Customized) Customer commitment
BOM Supplier commitment
Unit price Set-up times
Order size requirements Production capacity Human resource flexibility Equipment flexibility
Integration the function of production and marketing
Shop floor Information flow Strict regulations
Rewards, recognition and pay system Customer feedback
Return of investment
level is considered either in the objective function or as an external constraint. However, these mathematical models are not easily applicable in practice due to the complexity of companies. Besides, these mathematical models are often too difficult to understand, which makes the model not user-friendly for the managers and users. Also, these models do not consider the perishability of products, which is crucial in food processing companies. On the other hand, some papers propose a framework, which is easy to understand by managers, but these frameworks provide suggestions and qualitative decisions rather than detailed procedures and quantitative decision goals, except from one paper. Perona et al. (2009) provide a framework that bridges the theoretical-practice gap.
Concluding, the literature lacks a user-friendly quantitative model to decide the CODP of products in the food processing industry. However, although the model described by Perona et al. (2009) do not consider perishability of products and limited inventory capacity, the model can be used as a basis framework to se-lect and assign a CODP and corresponding inventory control policy to different end products in food processing industries. The framework of Perona consist of four steps; segmentation into homogeneous product groups, CODP determination per product group, inventory control policy assignment per product group, and parameter setting for each item based on its inventory control policy.
This research will provide a new framework to select and assign a CODP and cor-responding inventory control policy to different end products in food processing industry by adjusting Perona’s framework. We will adjust the sequence of steps and the content of some steps of the framework to include the perishability of the products, the limited inventory capacity and the service level. To be able to con-sider these factors we have to do further research. Below, we briefly describe our proposed framework to explain the subjects of further research. To fully under-stand the proposed framework, a detailed description of the proposed framework is described in chapter 4.
In addition to the ranking method, we will also perform a mathematical model, since these models are accurate. In contrast to the multi-criteria classification, a literature review on the 0-1 ILP model is no longer necessary, since such types of models have already been discussed above. The 0-1 ILP model is not as complex as the mathematical models explained above, i.e. the model will be easily applicable and user-friendly. Note that a less complex model can lead to a less precise model. The 0-1 ILP model does consider limited inventory capacity and required service levels. We will set up this model by ourselves.
Finally, step 4 assigns a CODP and corresponding inventory control policy to different end products by using either the ranking method or the 0-1 ILP model.
In the next sections, a literature review on both multi-criteria classification and parameter setting of inventory control policy in food processing industry is per-formed.
3.2
Multi-criteria inventory classification
ABC inventory classifications are widely used in practice, where the items are classified based on one criteria, the annual use value, which is the product of an-nual demand and average unit price (Teunter et al., 2009) (Ramanathan, 2006). The framework of Perona et al. (2009), which is used as basis framework in this research, uses this traditional ABC inventory classification. However, for many items there may be other criteria that represent important considerations for man-agement (Flores & Whybark, 1987). The rate of obsolescence in food processing industry is an example of such considerations. Therefore, a literature review is conducted to find an ABC inventory classification model where the items are clas-sified based on multi-criteria. Note that we use an ABC inventory classification to be able to only rank the end products rather than classify them, since the limited inventory capacity will probably determine the classification.
In general, the ABC inventory classification method classifies items in a class (A, B or C) based on a criterion or criteria. Class A indicates to the most important items and need the most attention, where on the other hand class C indicates to the less important items (Teunter et al., 2009). The most common rule is that class A, class B, and class C consists of 20%, 30%, and 50% of the total items, respectively (Silver et al., 2017). Class A consists of 20%, since in many cases 20% of all items ensures for 80% of the total revenue. This is also called the 80/20 rule. The most important reason to classify items is that many companies have to deal with thousands of items, and therefore implementing a item-specific inventory control method is infeasible.
disadvantage of these methods is the subjectivity involved when making pair-wise comparisons. VED, AHP and distance modeling are examples of such methods (van Kampen et al., 2012). In contrast to many papers, Ramanathan (2006) provides an advanced statistical approach. Ramanathan (2006) proposes a simple classification scheme using weighted linear optimization, from now called R-model. The model is closely similar to the concept of data envelopment analysis. This model can automatically generate a set of criterion weights for each item and as-sign a normalized score to this item for further ABC analysis (Zhou & Fan, 2007). The model is simple and easy to understand for managers. Also, the model can easily integrate additional information. By solving the R-model repeatedly for each item, we obtain a set of aggregated performance scores, which can be used to classify the M inventory items. However, if an item has a value dominating other items in terms of a certain criterion, this item would always obtain an aggregated performance score of 1 even if it has added values with respect to other criteria (Zhou & Fan, 2007). Therefore, Zhou and Fan (2007) have made an extension to the model from now called ZF-model. Zhou and Fan (2007) propose an extended version of the model by incorporating some balancing features for multi-criteria ABC inventory classification. The extended version could be viewed as providing a more reasonable and encompassing index since it uses two sets of weights that are most favorable and less favorable for each item, while keeping the simplicity of the R-model (Zhou & Fan, 2007). The total aggregated performance score of an item is the combination of the normalized aggregated performance score of an item of the R-model and the ZF-model, which is expressed in equation 1.
nIi(λ) = λ× gIi−gI
−
gI∗−gI− + (1−λ)×
bIi−bI−
bI∗−bI−, (1)
where nIi(λ) denotes the total aggregated performance score of an item, gI∗
= max(gIi, i = 1,2, ..., M), gI−= min(gIi, i = 1,2, ..., M), bI∗ = max(bIi, i =
1,2, ..., M), bI− = min(bIi, i = 1,2, ..., M) and 0 ≤ λ ≤ 1 is a control parameter
which may reflect the preference of decision maker on the good and bad indexes.
Despite the advantages of the R-model and the ZF-model, it should be noted that under these models each item uses a set of weights either most or least fa-vorable to itself for performance self-estimation. In other words, the weights for self-estimation may differ from one item to another. This actually implies that the resulting performance scores of all items obtained from either model are less com-parable (Chen, 2011). Therefore, Chen (2011) proposes an improved approach to the ZF-model by which all items are peer-estimated. Chen (2011) extended
the ZF-model by peer estimation and replaces the employed λ in equation (1)
by a maximizing deviation method due to the subjectivity of the λ. Hereby, the
performance index provided by the proposed approach could be viewed as more reasonable and comprehensive for multi-criteria inventory classification, which re-sult in a more appropriate ranking (Chen, 2011).
inventory (Ng, 2007). Therefore, Ng (2007) proposes an alternative weight linear optimization model (model (2)). Ng (2007) makes some adjustments to the R-model. Namely, Ng (2007) transforms all measures to comparable base and the decision maker has to rank the importance of the criteria. Although this involves certain degree of subjectivity, this is a far weaker requirement than that in AHP (Ng, 2007), where only ranking is required.
maxSi =
N X
n=1
winyin (2)
s.t.
N X
n=1
win = 1,
win−wi(n+1) ≥0, n = 1,2, ...,(N −1),
win≥0, n= 1,2, ..., N,
where maxSi, yin and win denote the aggregated performance score of an item,
the performance score of theith item in terms of thenth criterion, and the weight
of the ith item terms of thenth criterion, respectively. The model automatically
calculates the weights of each criterion with such each item can achieve the max-imal score (Ng, 2007). However, the processing time can be very long as well. Therefore, Ng (2007) adopts a transformation to simplify the model (model (3)). This model can be easily solved without a linear optimizer.
maxSi =
N X
n=1
uinxin (3)
s.t.
N X
n=1
juin = 1,
uin≥0, n= 1,2, ..., N,
where uin = win−wi(n+1),
and uiN = wiJ,
and xin = win
Although this model can be easily solved without a linear optimizer, the model has some limitations. One of the limitations is the number of criteria. When the number of criteria is large, it is not an easy task for decision makers to rank all criteria (Ng, 2007). Moreover, the model can handle only continuous measures and the normalization scaling requires the extreme values of measures. And thus, all normalized measures will be affected if the extreme changes. Hadi presented an extended version of the Ng-model. Hadi (2010) provides a model for ABC classification that not only incorporates multiple criteria, but also maintains the effects of weights in the final solution (Hadi-Vencheh, 2010).
the most existing ABC classification models. The PROAFTN method is used to classify inventory items into ABC categories and the Chebyshevs theorem is used to estimate the PROAFTN parameters (Douissa & Jabeur, 2016). A comparative study is conducted to test the performance of PROAFTIN with respect to some other existing classification. The performance is defined as the inventory costs and the service level. This comparative study is represented in table 3.2. The NG model provides the highest fill rate, while the PROAFTN model provides the lowest inventory cost.
Classification model Total inventory cost Fill rate
NG model 1011.007 0.991
Hadi model 999.892 0.990
Peer model 958.14 0.988
ZF model 945.357 0.984
R model 927.517 0.986
PROAFTN 897.31 0.983
Table 3.2: Comparative study from Douissa and Jabeur (2016)
There are many SKU classification models available in the literature, which have
their own advantages and disadvantages. In food processing industry,
multi-criteria ABC inventory classification is useful, since food processing companies have to deal with perishability of products while in need to meet a relative high service level. However, in many multi-criteria ABC classification methods is ei-ther subjectivity involved or the method can not be easily implemented due to the complexity of the company. In contrast to these models, the six models described above can be easily implemented and subjectivity is limited. Since we prefer a model with limited subjectivity that provides a high service level, we will use the peer model. However, due to the peer estimation involved, the processing time will be very long. The difference between the ZF model and the peer model is the peer estimation and the maximization deviation method used in the peer model. That is why the peer model gives a small improvement in the ABC classification over the ZF model. Since we classify products in two classes, namely make-to-stock and make-to-order, rather than three classes, the peer estimation will add even less value. Therefore, due to the trade-off that we have made we will use the peer model, by removing the peer estimation and retaining the maximization deviation method, to rank the end products.
3.3
Parameter setting of inventory control
poli-cies in food processing industry
meet future demands. However, this is not the case in food processing industries. In food processing industries, the impact of perishability on inventory manage-ment can not be disregarded. Perishable inventory models is an attractive topic to researchers, since the importance of perishable inventories in food, chemical and pharmaceutical industries. Inventory models that describe perishability are different from the general inventory models and are generally quite complex due to the extra dimension (Nahmias & Olsen, 2015). In addition, in most food pro-cessing industries the demand is uncertain. Demand uncertainty and fixed life perishability combined to result in challenging and complex problems (Nahmias, 2011).
Academic literature of inventory control (for perishables) with deterministic life-time can be categorized into various classes depending on (i) whether the inventory is reviewed periodically or continuously, (ii) whether replenishment orders arrive instantaneously or after a positive lead time, (iii) the cost components considered (Kouki et al., 2015).
In general, there are four inventory control policies (Silver et al., 2017). These control policies are represented in table 3.3. An explanation of the inventory control policies is explained below the table.
Table 3.3: Existing inventory control policies
Continuous review Periodic review
Fixed lot size (r, Q) (R, s, Q)
Variable lot size (r, S) (R, s, S)
(r, Q) policy: an order of size Q (> 0) is placed whenever the inventory position
IP (on hand inventory plus on order) drops to the reorder point r.
(r, S) policy: a variable order lot size S - IP is placed whenever the inventory
position drops to the reorder point r.
(R, s, Q) policy: we review IP every R periods and an order of size Q (> 0) is
placed whenever the inventory position drops to the reorder point s at review.
(R, s, S) policy: we review IP every R periods and a variable lot size S-IP is
placed whenever the inventory position drops to the reorder point s at review.
In case the items can be stored indefinitely, the reorder point r (and s) refers to the expected lead time demand plus safety stock. The safety stock should cover uncertainty in demand during the lead time. Therefore, the reorder point is equal
tor(ors) =µL+saf etyf actor∗σL. (Silver et al., 2017) The Q can be approached
by the EOQ. Calculating parameter S is much more complex, and is not important for this literature review, so we leave it at that.
to find a suitable inventory control model. The literature review focuses on in-ventory models for perishables with fixed lifetimes, a continuous review period, stochastic demand, and replenishment orders with positive lead times. This is be-cause these models cover the real-case at most. In all models from the literature that cover these requirements, the optimal inventory control policy parameters are determined based on minimizing the total cost, which includes ordering, inventory holding, outdating and shortage costs.
Nahmias and Wang (1979) developed a heuristic (Q, r) perishable model under the assumption of at most one order outstanding. Chiu (1995) re-examines the (Q, r) model of Nahmias and Wang (1979) and improves his own approximation of the (Q, r) model in Chiu (1999) by replacing the extremely rough approximation by a good approximation. Tekin et al (2001) consider a continuous review perishable inventory system operating under a modified lotsize-reorder control policy which also takes into account the remaining lifetime of the items in stock and the required service level. They develop a (Q, r, T) policy, where a replenishment order Q is placed either when the inventory drops to r, or when T units of time have elapsed since the last instance at which the inventory level hit Q. The model included a service level constraint that requires the fraction of unmet demand not to exceed a prespecified value (Tekin et al., 2001). Their findings indicate that the age-based policy is superior to the stock level policy for slow moving perishable
inventory systems with high service levels. Berk and GÃ14rler (2008) compared
their model to Chiu (1995) with lost sales and Poisson demand and showed that the model of Chiu (1995) performs worse than the traditional (r, Q) policy. Kouki et al. (2015) also improved the model of Chiu (1995); their approach is based on determining upper bounds rather than average values. The model differs from existing models by considering an (r, Q) inventory system with continuous demand distribution, constant lifetime and constant lead time. Kouki et al. (2015) give also a detailed literature review for perishable inventory systems and show that compared to similar existing studies, including the above models discussed, the proposed model performs very well. However, the model does not consider the required service level.
There is one model that does not meet our inventory models characteristics, but still can be a good model to use in our case. Purohit and Rathore (2012) developed a multi-item inventory control model for perishable items in which production (or supply) is instantaneous with no lead time. Even though the model considers deterministic demand and no lead time, the model can be a good approximation to use on for decisions on strategic level.
Chapter 4
Solution design
This chapter describes the proposed framework, and answers therefore the third
sub question: "How can a framework be built to select and assign a CODP and
corresponding inventory control policy in food processing industry?". The goal of the proposed framework is to assign a CODP and the corresponding inventory control policy to each end product in the food processing industry, which will be input for the inventory control and planning system Slimstock to create a well-functioning Slimstock that will lead to an improvement in service level and a reduction in cost by balancing the inventory. The framework considers the perishability of the items, the limited inventory capacity, and the required service level. Figure 4.1 represents the flow diagram of the proposed framework. An arrow is defined as input for the next step. As can be seen, the framework consists of four steps: ranking the end products, match CODP’s with inventory control policies, finding parameter values of the given inventory control policies, and assigning of a CODP and corresponding inventory control policy to the end products.
[image:41.595.82.530.525.684.2]Assigning of a CODP and corresponding inventory control policy to the end prod-ucts can be done by both using the ranking (step 4a) and the 0-1 ILP model (step 4b). As can be seen, step 1 is only needed for step 4a. Both models will be implemented and compared in chapter 5.
Ranking the end products (step 1) will be carried out by a linear optimization multi-criteria inventory classification method. The higher the overall performance of an item, the more likely that the item will be produced according to the make-to-stock strategy. Therefore, step 1 provides a list, where the items are ranked from high to low. To be able to deal with the limited inventory capacity, the average inventory space needed per item is needed. This requires step 2 and 3. Note that only the make-to-stock items need inventory space. However, we do not know which item becomes a make-to-stock item in advance. Therefore, we have to calculate the average inventory space needed for all items. In step 2 we define the existing CODP’s and match the CODP’s with inventory control policies. Finding the parameter values of the inventory control policy that corresponds to make-to-stock decoupling point ensures that we can define the required inventory space needed for each item, which will be done in step 3. In this case, the parameter values of the given inventory control policy will be found by an (r, Q) inventory control model. To be able to calculate these parameter values, the service level of each item is needed as input. The inventory control model gives the parameter values (r, Q) and the expected average inventory space needed per item as result. The expected average inventory space for each item is an input for step 4. Finally, in step 4 a CODP and corresponding inventory control policy can be assigned to each end product by using either step 4a and 4b. In step 4a, the assigning to each end product is done by using the ranking (step 1), the average inventory space needed per item (step 3), and the total inventory capacity. In step 4b, the assigning to each end product is done by a 0-1 ILP model, the average inventory space needed per item (step 3), and the total inventory capacity. The 0-1 ILP model has as objective minimizing the total cost subject to the limited inventory capacity. 0 and 1 refers to a make-to-order and make-to-stock item, respectively.
In the end, the CODP and the corresponding inventory control policy of each item is input for the inventory control and planning system Slimstock. The steps of the framework are elaborated in detail below.
4.1
Step 1: Ranking end products
Below, the criteria selection is explained first, followed by the explanation of the model. For a detailed explanation and proofs we refer you to the paper of Chen (2011).
Criteria selection
In order to get a ranking of the end products, criteria selection is a crucial de-cision, since this decision will influence the ranking. Each company is different and is changing constantly, so criteria selection is company and time dependent. Therefore, before ranking the end products, the criteria selection has to be recon-sidered. The criteria selection for the food processing company will be elaborated below. This criteria selection is based on table 3.1 from section 3.1.
For the food processing company, the following criteria will be included in the model:
• Annual usage (Sales Volumes * Cost per unit)
• Demand variability
• Best-before date
• Order lead time (customer commitment)
• Ratio of best-before date and average time between orders
According to section 3.1, annual usage is the most common criteria used in ABC classification, and should also be an important criterion for ranking end products of the food processing company. In this case, we will use the average weekly usage, since each product is introduced at a different time, which means that some products have been produced since a year and other since one month. Besides, demand variability is included because it says something about how fluctuations in demand influence the optimal amount of stock at a particular moment. Items with high variability for which an average amount of stock is held at all times can result in both high cost and low service levels; when demand is low, items might expire after costs have been made already for storage and production. When demand peaks, there is likely not enough stock for the upcoming, resulting in dissatisfied customers. Moreover, the best-before date is the critical aspect in food processing industry and should therefore be included. The commitment order lead time per customer also has to be included, since the food processing company has customer commitment about the delivery lead time and the food processing company has to meet a service level of 99%. Furthermore, we included a ratio; the ratio of best-before date and average time between orders. Since there are many items that are not sold every day, which creates risk of perishability of products, the ratio of best-before date and average time between orders is another included criterion.
Model explanation
Briefly, the order of the ranking method is as follows: self-estimation in most and least favorable sense, normalization in most and least favorable sense, de-termination of weight coefficients for the most and least favorable sense using the maximization deviation method, normalization of the weight coefficients, and aggregation of the two normalized performance scores to calculate the overall per-formance score of an item.
The first step is solving the self-estimation models by using the R-model (most favorable sense) and the ZF-model (least favorable sense) as mentioned in section 3.2. The R-model and the ZF-model are represented in model (4) and (5),
respec-tively. The following parameters and decision variables are used in the models: ρo
andδo,wio, andyio(yim), and means the aggregated performance score, the weight
of the oth item in terms of the ith criterion, and the performance score of the oth
(mth) item in terms of the ith criterion, respectively.
R-model:
max ρo =
N X
i=1
yiowio (4)
s.t.
N X
i=1
yimwio ≤1, m = 1,2,...,M,
wio ≥0, i = 1,2,...,N,
ZF-model:
min δo =
N X
i=1
yiowio (5)
s.t.
N X
i=1
yimwio ≥1, m = 1,2,...,M,
wio ≥0, i = 1,2,...,N,
By solving these models repeatedly for each item, we obtain a set of aggregated performance scores in most and least favorable sense, which can be used to classify the M inventory items.
Since ρo and δo have different definitions in that ρo is in the most favorable sense
and δo in the least favorable sense, these averaged performance scores have to be
normalized. For normalization, the following variables are used: ρ+∗ = max(ρ+
m,
i = 1,2,...,M), ρ+
−= min(ρ+m, i = 1,2,...,M), δ
−∗ = max(δ−
m, i = 1,2,...,M), δ
− − =
min(δm−, i = 1,2,...,M). The averaged performance scores can then be normalized
Θ+
o = ((ρ+o −ρ+−)/((ρ+∗−ρ+−)), (6)
Θ−o = ((δo−−δ−−)/((δ−∗−δ−−)), (7)
For aggregation of the two averaged performance scores Θ+
o and Θ
−
o, the
maximiz-ing deviations method is used to identify a unique set of weight coefficients. The maximizing deviations method is explained below.
Let t1 and t2 be the weights of the most favorable sense and least favorables sense,
respectively. And assume that t1and t2 satisfy the unitization constraint condition
t2
1 + t22 = 1
Then the maximizing deviations method can be defined as follows:
maxD =
M X
i=1 M X
j=1
|Θ+i −Θ+j | ∗t1+
M X
i=1 M X
j=1
|Θ−i −Θ−j | ∗t2 (8)
s.t. t2
1+ t22 = 1,
t1,t2 ≥0.
The result of the maximizing deviations method are the weights t∗1 and t∗2. These
weights have to be normalized as follows:
T∗1 = t∗1/(t∗1+ t∗2) (9)
T∗2 = t∗2/(t∗1+ t∗2) (10)
The weights T∗1 and T∗2 ensure that the two averaged performance scores of an
item can be aggregated. So, finally, the overall performance of an item can be calculated by equation (14) in order to rank the end products:
φo = T∗1∗Θo++ T∗2∗Θ−o (11)
Concluding, this step provides a ranking of the end products based on their
perfor-mance (φo). The higher the overall performance, the more likely the end product
based on assigning the different groups to the different points, e.g. the most im-portant groups are assigned to make-to-stock. However, like many papers about make-to-order/make-to-stock decision, they do not consider limited inventory ca-pacity. The number of make-to-stock products could ensure that the inventory capacity will be exceeded. Therefore, we have to consider this constraint, which makes the classification not that simple. Therefore, the classification can only be done in the last step.
4.2
Step 2: Match existing CODP’s with
inven-tory control policies
Food processing companies have to deal with inventory and production capac-ity constraints. To be able to meet the required service level, food processing companies want to produce many items according to the make-to-stock strategy. However, the inventory capacity is limited, which makes that the food process-ing company is forced to switch to make-to-assembly or even to make-to-order. On the other hand, food processing companies have to deal with perishability of items. Some items have a very short best-before date, which ensures that the food processing company is forced to produce a item according to the make-to-order strategy. However, the production capacity is limited, which can ensure that all orders of the make-to-order items can not be produced within the time limit. Therefore, a balance in the number of make-to-stock and make-to-order items is needed.
To deal with the inventory capacity constraint, which is the bottleneck in our case, the required inventory space per item has to be considered. The required inventory space is based on the inventory control policy of the make-to-stock items. Therefore, in this step we already have to match inventory control policies to the several decoupling points to be able to consider the inventory capacity constraint.
First, the existing CODP’s in the company are explained followed by the matching inventory control policies.