http://wrap.warwick.ac.uk
Original citation:
Haworth, Claire M. A., Davis, Oliver S. P., Hanscombe, Ken B, Kovas, Yulia, Dale, Philip
S. and Plomin, Robert. (2013) Understanding the science-learning environment : a
genetically sensitive approach. Learning and Individual Differences, Volume 23 (Number
100). pp. 145-150. ISSN 1041-6080
Permanent WRAP url:
http://wrap.warwick.ac.uk/65867
Copyright and reuse:
The Warwick Research Archive Portal (WRAP) makes this work of researchers of the
University of Warwick available open access under the following conditions.
This article is made available under the Creative Commons Attribution 3.0 (CC BY 3.0)
license and may be reused according to the conditions of the license. For more details
see:
http://creativecommons.org/licenses/by/3.0/
A note on versions:
The version presented in WRAP is the published version, or, version of record, and may
be cited as it appears here.
Understanding the science-learning environment: A genetically sensitive approach
Claire M.A. Haworth
a,⁎
, Oliver S.P. Davis
a, Ken B. Hanscombe
a, Yulia Kovas
b,
Philip S. Dale
c, Robert Plomin
aa
King's College London, Social Genetic and Developmental Psychiatry Centre, United Kingdom
b
Department of Psychology, Goldsmiths, University of London, United Kingdom
c
Department of Speech and Hearing Sciences, University of New Mexico, United States
a b s t r a c t
a r t i c l e i n f o
Article history:
Received 23 February 2012 Received in revised form 8 May 2012 Accepted 24 July 2012
Keywords: Behavioural genetics Learning environments Science ability Twins
Gene–environment correlation
Previous studies have shown that environmental influences on school science performance increase in im-portance from primary to secondary school. Here we assess for thefirst time the relationship between the science-learning environment and science performance using a genetically sensitive approach to investigate the aetiology of this link. 3000 pairs of 14-year-old twins from the UK Twins Early Development Study reported on their experiences of the science-learning environment and were assessed for their performance in science using a web-based test of scientific enquiry. Multivariate twin analyses were used to investigate the genetic and environmental links between environment and outcome. The most surprising result was that the science-learning environment was almost as heritable (43%) as performance on the science test (50%), and showed negligible shared environmental influence (3%). Genetic links explained most (56%) of the association between learning environment and science outcome, indicating gene–environment correlation.
© 2012 Elsevier Inc.
1. Introduction
An understanding of gene–environment interplay will be central in translating behavioural geneticfindings into educational implica-tions and in providing evidence for changes to educational policy and practice (Bates, 2008; Grigorenko, 2007; Haworth & Plomin, 2011; Sternberg & Grigorenko, 1999). The strongest evidence for the role of environmental factors comes from genetically sensitive studies that tease apart the effects of nature and nurture and allow the inves-tigation of correlations and interactionsbetweennature and nurture (Plomin & Bergeman, 1991; Rutter, Pickles, Murray, & Eaves, 2001). We are not aware of any research that has used this strategy to exam-ine environmental influences on science performance.
Twin analyses allow the investigation ofwhatinfluences the envi-ronmental experience and how this experience is related to out-comes. The ‘environment’ can be treated as a dependent variable and its variance decomposed into genetic and environmental sources using the differential correlation between identical and fraternal twin pairs. Many ostensible measures of the environment are in fact moder-ately genetically influenced (Hanscombe, Haworth, Davis, Jaffee, & Plomin, 2010; Kendler & Baker, 2007; Plomin & Bergeman, 1991), indicating gene–environment correlation, that is, a correlation between genetic influences and environmental exposures and experiences
(Plomin, DeFries & Loehlin, 1977; Scarr & McCartney, 1983). This arises because individuals influence their environments, for example, by eliciting responses from others or by actively seeking out experiences.
Using the twin design it is also possible to decompose the covariance between an outcome and the environment into genetic and environmental sources. Doing so elucidates the mechanisms by which the environment is related to the outcome. Research in non-genetically sensitive samples typically assumes that environ-ments affect outcomes via environmental pathways. Embedding environmental research within a genetically sensitive study allows us to formally test whether the environment–outcome relation-ship is in fact environmentally mediated (Rutter et al., 2001).
1.1. Environmental influences on school science performance
Previous research has shown that environmental influences are more important for individual differences in science performance than for other academic abilities (Haworth, Kovas, Dale, & Plomin, 2008). The importance of the environment also appears to increase with age (Haworth, Dale, & Plomin, 2009), making science perfor-mance in adolescence a pertinent target for the identification of the specific environmental influences that are involved. School science performance is influenced by both shared and non-shared environ-mental factors; at age 12 shared environenviron-mental influences accounted for 32% of the variance in performance, and non-shared environments accounted for a further 21% (Haworth et al., 2009).
⁎Corresponding author at: Institute of Psychiatry P080, De Crespigny Park, London, SE5 8AF, United Kingdom. Tel.: +44 207 848 5433; fax: +44 207 848 0866.
E-mail address:[email protected](C.M.A. Haworth).
1041-6080 © 2012 Elsevier Inc.
http://dx.doi.org/10.1016/j.lindif.2012.07.018
Contents lists available atSciVerse ScienceDirect
Learning and Individual Differences
j o u r n a l h o m e p a g e : w w w . e l s e v i e r . c o m / l o c a t e / l i n d i f
Open access under CC BY license.
1.2. School learning environments
The role of the teacher and the classroom environment on edu-cational achievement has been an important topic in eduedu-cational research (Fraser, 1998; Fraser & Walberg, 1981), and more recently the peer and home learning environments have been a focus of research (Fraser & Kahle, 2007). Reports consistently demonstrate an influence of the classroom on achievement, particularly in anal-yses that focus on average effects across classrooms. Analanal-yses of individual-level effects have also demonstrated the role of the classroom environment on achievement, albeit with smaller corre-lations. For example, individual-level associations between class-room environment and science achievement were found to be 0.13 in a sample of more than 3000 students (Fraser & Kahle, 2007), while the peer environment correlated even less with science achievement. The current analyses considered these classroom and peer measures within a genetically sensitive design to understand the genetic and environmental aetiology of learning environments and their links to science performance. Given the interest in sex dif-ferences in science that typically emerge in adolescence (Halpern et al., 2007), we were also interested to assess any sex-specific envi-ronmental effects.
2. Methods
2.1. Sample
The Twins Early Development Study (TEDS) is a study of twins born in England and Wales between 1994 and 1996 (Oliver & Plomin, 2007). TEDS is reasonably representative of the general population in terms of parental education, ethnicity and employment status (Kovas, Haworth, Dale, & Plomin, 2007). Zygosity was assessed through a parent questionnaire of physical similarity (Price et al., 2000). For cases where zygosity was unclear, DNA testing was conducted.
TEDS families were invited to participate in the 14-year study, which included a web-based battery of cognitive tests, and postal questionnaires. Parents provided informed consent for each assess-ment. The mean age at assessment was 14.03 (sd = 0.60) for the web-based tests; and 14.07 (sd = 0.56) for the questionnaire. Not all families provided data for both assessments; see Table 1 for the number of complete twin pairs for each measure.
2.2. Measures
2.2.1. The learning environment
To assess the science-learning environment we used items from the Classroom, Home and Peer Environment Influences Scale (Fraser & Kahle, 2007). We included items from the classroom and the peer domains to assess the support given by both teachers and peers in the science-learning environment. The questionnaire included 10 of the original 12 items scored on a five-point scale from ‘almost never’ to ‘very often’. To assess the classroom environment there were 6 items primarily focused on interactions between the students and the teacher while in the classroom. The role of peers in the learn-ing environment was assessed uslearn-ing 4 items concernlearn-ing interactions with peers in relation to science primarily outside of the classroom. SeeAppendix Afor a list of the items. Item scoring was reversed where necessary so that a higher score denoted a more favourable environment. The scales were calculated as a mean of the relevant items (requiring 50% of the items to be non-missing), and demon-strated good internal consistency reliability in TEDS (alpha = 0.79 for the total; 0.71 for classroom; and 0.83 for peers). These alphas are comparable with those from the original Fraser and Kahle (2007)analysis (0.73 for classroom; and 0.79 for peers).
2.2.2. Science enquiry test scores
Scientific enquiry skills, the skills needed to design and evaluate sci-entific evidence, are a key component in the UK National Curriculum. Our online test of scientific enquiry skills consisted of 39 items drawn from publicly available measures of science performance before being piloted and converted to web-based format. The test takes 23 min to complete on average, and has good internal consistency reliability (alpha = 0.75). A total score was calculated by taking a sum of the items. Further details about the design and piloting of our science test can be found inHaworth, Dale, and Plomin (2010). We have previously assessed the reliability and validity of our web-based tests in general by comparing web-based scores with more traditional paper-and-pencil tests. Results indicate correlations on average of 0.76 between web and paper versions (Haworth et al., 2007).
2.3. Analyses
2.3.1. Data preparation
[image:3.595.36.554.544.727.2]All of the measures were slightly skewed: the classroom environ-ment measure had a skew of−0.471, the peer environment 0.581,
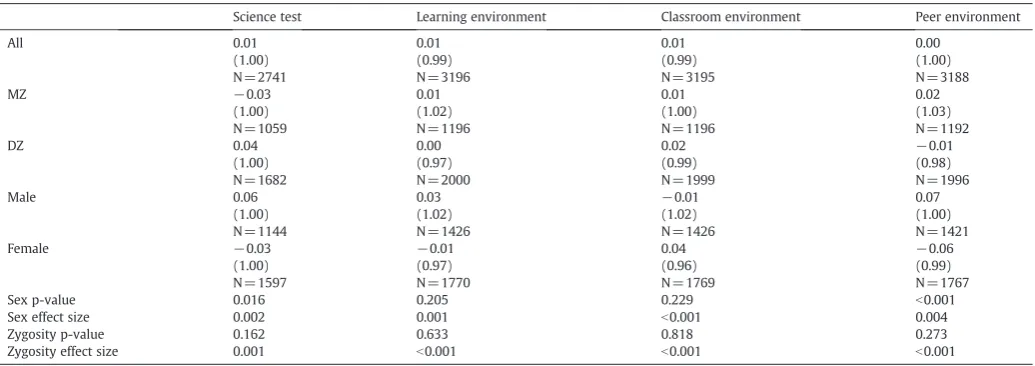
Table 1
Means (standard deviations) and ANOVA results.
Science test Learning environment Classroom environment Peer environment
All 0.01 0.01 0.01 0.00
(1.00) (0.99) (0.99) (1.00)
N = 2741 N= 3196 N= 3195 N = 3188
MZ −0.03 0.01 0.01 0.02
(1.00) (1.02) (1.00) (1.03)
N = 1059 N= 1196 N= 1196 N = 1192
DZ 0.04 0.00 0.02 −0.01
(1.00) (0.97) (0.99) (0.98)
N = 1682 N= 2000 N= 1999 N = 1996
Male 0.06 0.03 −0.01 0.07
(1.00) (1.02) (1.02) (1.00)
N = 1144 N= 1426 N= 1426 N = 1421
Female −0.03 −0.01 0.04 −0.06
(1.00) (0.97) (0.96) (0.99)
N = 1597 N= 1770 N= 1769 N = 1767
Sex p-value 0.016 0.205 0.229 b0.001
Sex effect size 0.002 0.001 b0.001 0.004
Zygosity p-value 0.162 0.633 0.818 0.273
Zygosity effect size 0.001 b0.001 b0.001 b0.001
and the science test score−0.868. A van der Waerden rank transfor-mation (Lehmann, 1975) was applied to all of the measures. In addi-tion, as is standard in twin analyses, all measures were corrected for the mean effects of age and sex using a regression procedure (McGue & Bouchard, 1984).
2.3.2. Twin analyses
Twin analyses allow the estimation of the relative contributions of genes and environments to individual differences in measured traits (Plomin, DeFries, Knopik, & Neiderhiser, 2012). Twin intraclass corre-lations were calculated (Shrout & Fleiss, 1979), providing an initial in-dication of the relative contributions of additive genetic (A), shared environmental (C), and non-shared environmental (E) factors. Addi-tive genetic influence, also commonly known as heritability, is esti-mated as twice the difference between the identical and fraternal twin correlations. The contribution of the shared environment, which makes members of a family similar, is estimated as the difference between the identical twin correlation and heritability. Non-shared environments, (environments specific to individuals), are estimated by the difference between the identical twin correla-tion and 1 because they are the only source of variance making iden-tical twins different. Estimates of the non-shared environment also include measurement error.
Structural equation model-fitting analyses allow more complex analyses and formal tests of significance (Rijsdijk & Sham, 2002). Standard twin model-fitting analyses were conducted using Mx (Neale, Boker, Xie, & Maes, 2006). Sex differences in the genetic and en-vironmental influences were examined using standard sex-limitation analyses (Neale & Maes, 2001). These models allow the formal investi-gation of both quantitative sex differences (i.e. different levels of effect in males and females) and qualitative sex differences (i.e. different kinds of effects in males and females).
To investigate the links between the learning environment and science performance, we conducted bivariate twin model-fitting. Bi-variate model-fitting decomposes the covariance between traits, pro-viding estimates of the genetic and environmental correlations between traits. In addition the proportion of the phenotypic correla-tion between the two traits that is explained by genetic and environ-mental factors can be computed.
3. Results
3.1. Descriptive statistics
The means and standard deviations for all of the measures are presented inTable 1. ANOVA was used to assess the effects of sex and zygosity, prior to the age and sex regression. The main effect of sex on science performance just reached significance, with boys performing better than girls, but explained only 0.2% of the variance. There was no significant effect of sex on the overall science-learning environment, but there was a significant sex difference on the peer environment scale. Males had a more favourable peer environment than females, but this effect explained only 0.4% of the variance. There were no significant main effects of zygosity. All measures were corrected for sex before the model-fitting analyses to control for these mean differences.
The phenotypic correlation between the environmental subscales was moderate (0.37), and the correlations between the environmen-tal measures and the science test scores were modest, 0.18 for the classroom, 0.19 for the peers, and 0.23 for the overall learning envi-ronment composite (pb0.01 for all correlations).
3.2. Twin correlations
The twin intraclass correlations are shown inTable 2. In all cases identical (monozygotic, MZ) twin correlations were greater than fraternal (dizygotic, DZ) twin correlations, indicating genetic infl u-ence on the measures, including the measures of the learning envi-ronment. Twin correlations split by sex, indicate that genetic and environmental estimates are similar for males and females; this question is tested formally in model-fitting analyses below.
3.3. Model-fitting analyses
[image:4.595.42.567.545.701.2]Results from the sex-limitation analyses are shown inTable 3. For all measures the model-fitting analyses confirmed that there were no significant quantitative or qualitative sex differences. Estimates for the genetic and environmental influences from the best-fitting null model (i.e. not modelling sex differences) are shown in Table 4, along with their corresponding 95% confidence intervals. Moderate
Table 2
Intraclass twin correlations by sex and zygosity.
Science test Learning environment Classroom environment Peer environment
MZ 0.67 0.47 0.40 0.45
N = 943 N = 1149 N = 1149 N = 1146
DZss 0.45 0.21 0.19 0.25
N = 729 N = 992 N = 991 N = 989
DZos 0.42 0.26 0.22 0.23
N = 653 N = 873 N = 873 N = 868
DZall 0.44 0.24 0.20 0.24
N = 1382 N = 1865 N = 1864 N = 1857
MZM 0.65 0.52 0.46 0.45
N = 366 N = 490 N = 490 N = 487
MZF 0.68 0.43 0.35 0.45
N = 577 N = 659 N = 659 N = 659
DZM 0.43 0.14 0.13 0.19
N = 310 N = 446 N = 446 N = 444
DZF 0.47 0.27 0.24 0.29
N = 419 N = 546 N = 545 N = 545
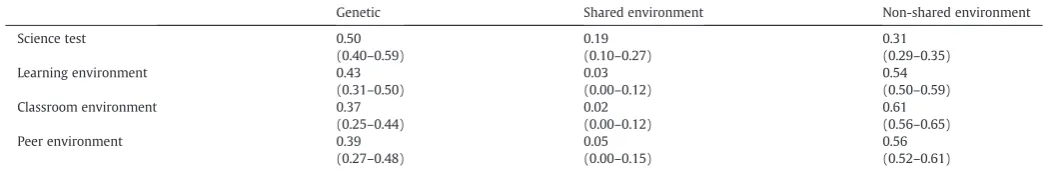
heritability was found for both scientific enquiry test scores (50%) and the science-learning environment (43%). Of note, there were negligible shared environmental influences on the science-learning environment, with the majority of the remaining variance being explained by non-shared environmental influences (54%).
Separate analyses for the classroom environment and the peer environment are also shown inTables 3 and 4. The results for these subscales are highly similar, and multivariate analyses indicated almost complete genetic overlap between the peer and classroom scales (genetic correlation 0.98, 95% CI: 0.84–1.00; full details avail-able from thefirst author). For this reason, the multivariate analyses on the relationship between science performance and the environ-ment are presented only for the overall science-learning environenviron-ment composite, but analyses using the separate environmental measures are available from thefirst author upon request.
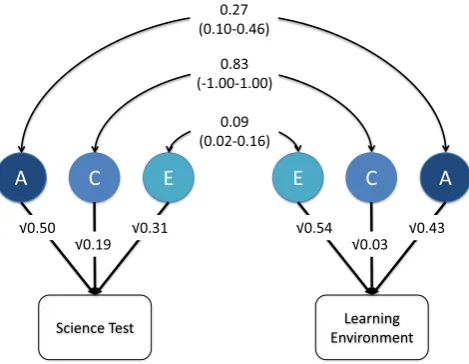
Results from the bivariate analyses are shown inFig. 1, which also includes the 95% confidence intervals. We found a moderate genetic correlation (0.27), indicating that to some extent the genetic influences on the learning environment also influence test performance. Of note, there was almost no overlap in non-shared environmental influences (non-shared environmental correlation = 0.09). There was strong overlap in the shared environmental influences (0.83), however, this should be interpreted in light of the minimal impact of the shared environment on the science-learning environment measure.
It is possible to calculate the contribution of genetic and environmen-tal influences to the phenotypic correlation from the estimates inFig. 1.
The phenotypic correlation is calculated as the sum of the paths linking the two phenotypes: (√0.50 × 0.27 ×√0.43) + (√0.19 × 0.83 × √0.03) + (√0.31×0.09×√0.54)=0.225. The genetic contribution to the phenotypic correlation can then be calculated: (√0.50×0.27× √0.43)/0.225=0.56. Thus 56% of the phenotypic correlation of 0.225 is explained by genetic influences. Similar calculations for the shared and non-shared environmental links indicate that shared environments ex-plain 28% of the 0.225 correlation and non-shared environments exex-plain the remaining 16%.
4. Discussion
Thefinding that the science-learning environment is modestly associated with science achievement replicates previous results (Fraser & Kahle, 2007). However, in contrast to previousfindings, wefind that the peer environment is just as important as the class-room environment, with both class and peer measures showing a similar level of overlap with science performance. Our main focus, however, is to extend previous research by conducting genetically sensitive analyses of the overlap between environment and outcome.
4.1. Twin analyses
[image:5.595.35.557.76.231.2]Univariate analyses indicated that the science-learning environment was significantly heritable (43%), with minimal shared environmental influence (3%) and moderate non-shared environmental influence Table 3
Sex limitationfit statistics for test and environment.
Measure Model −2LL df AIC LRT Δdf p
Test 1. Full (rG/rCfree) 14,640.183 5452 3736.183 25.395 12 0.013a
2. Common effects 14,640.410 5453 3734.410 0.226 1 0.634
3. Scalar 14,641.197 5455 3731.197 1.013 3 0.798
4. Null model 14,647.013 5456 3735.013 6.829 4 0.145 Learning environment 1. Full (rG/rCfree) 17,723.810 6377 4969.810 19.685 12 0.073a
2. Common effects 17,723.810 6378 4967.810 0.000 1 1.00
3. Scalar 17,728.228 6380 4968.228 4.418 3 0.220
4. Null model 17,730.689 6381 4968.689 6.879 4 0.142 Classroom environment 1. Full (rG/rCfree) 17,828.416 6375 5078.416 14.086 12 0.295a
2. Common effects 17,828.416 6376 5076.416 0.000 1 1.00
3. Scalar 17,833.424 6378 5077.424 5.008 3 0.171
4. Null model 17,836.205 6379 5078.205 7.789 4 0.100 Peer environment 1. Full (rG/rCfree) 17,706.947 6362 4982.947 13.118 12 0.361a
2. Common effects 17,706.947 6363 4980.947 0.000 1 1.00
3. Scalar 17,709.923 6365 4979.923 2.976 3 0.395
4. Null model 17,710.762 6366 4978.762 3.814 4 0.432 Note. Full model = this model allows quantitative and qualitative sex differences as well as different variances for males and females; common effects model = this model allows quantitative sex differences and different variances for males and females; scalar model = this model only allows different variances for males and females; null model = this model allows no sex differences.
Common effects, scalar and null models are compared to thefit of the full model. The full model is compared to thefit of the saturated model (a
= compared to the saturated model with MZ = DZ mean and twin 1 = twin 2 means).
−2LL = minus twice the log likelihood;df= degrees of freedom; AIC = Akaike's information criterion (lower values indicate betterfit); LRT = likelihood ratio test (change in likelihood between two models distributed as chi-squared);Δdf= change in degrees of freedom between comparison models; p = p-value for LRT.
Table 4
Univariate estimates (and 95% confidence intervals) for genetic, shared environment and non-shared environment.
Genetic Shared environment Non-shared environment
Science test 0.50 0.19 0.31
(0.40–0.59) (0.10–0.27) (0.29–0.35)
Learning environment 0.43 0.03 0.54
(0.31–0.50) (0.00–0.12) (0.50–0.59)
Classroom environment 0.37 0.02 0.61
(0.25–0.44) (0.00–0.12) (0.56–0.65)
Peer environment 0.39 0.05 0.56
[image:5.595.31.558.649.734.2](54%). Results were strikingly similar for the separate subscales of the classroom environment and the peer environment. For test perfor-mance, genetic influences explained 50% of the variance and shared and non-shared environments explained 19% and 31%, respectively. These results for test data confirm previous analyses of science perfor-mance as rated by teachers (Haworth et al., 2009). No significant sex differences were detected for genetic and environmental influences on the environmental measures or the test, indicating that the same genes and environments impact males and females and that genetic and environmental effect sizes are the same for males and females.
Bivariate twin analyses indicated that 56% of the phenotypic correlation between the science-learning environment and science performance was explained by genetic influences. Environmental in-fluences explain the remaining overlap, with shared environments explaining more of the relationship (28%), than non-shared environ-ments (16%). However, note that because the phenotypic correlation is only 0.225, this means that overlapping genetic factors explain just a small proportion (2.8%) of thetotalvariance in science performance. The main reason why there is a correlation between environment and outcome is shared genetic influences. This gene–environment corre-lation is characteristic of other analyses between environments and outcomes (Walker & Plomin, 2006), and indicates that genetically influenced behaviours have an impact on our experience of the environment.
4.2. Limitations
Although the phenotypic correlation (0.23) is in line with previous studies that found an average correlation of 0.13 for individual analy-ses, it is still only modest, indicating that the science-learning environment explains only a small proportion of the variance in
science performance. This low correlation warrants some caution in interpreting the multivariate analyses. There are at least two (not mutually exclusive) explanations for the low correlation: that the quality of the science-learning environment is not a good predic-tor of science performance, or that an individual's perception of their learning environment is not a good indicator of the quality of the environment. We cannot unequivocally rule out either of these possi-bilities, however the learning environment questionnaire is well validated (Fraser & Kahle, 2007), and the questionnaire demonstrates good internal consistency reliability in TEDS. The learning environ-ment measure also shows relatively high heritability for an‘ environ-mental’measure —and heritability is capped by the reliability of the measure.
The modest overlap between the learning environment, and in particular the classroom environment, and science performance is consistent with other studies that have attempted to quantify the effect that teachers have on student outcomes (e.g., Byrne et al., 2010). These empiricalfindings are often at odds with the popular press stories about bad teachers and the detrimental effects of poor teaching quality. Although our results do not speak directly to the issue of teacher effects on performance, they do highlight the fact that interactions between students and teachers (and students and peers) may create highly individualised experiences of these learning environments. This means that there are likely to be as many different classroom environments as there are students in the class. Educational researchers must now acknowledge that classroom (and peer) effects should be studied at the individual level as well as at the aggregate classroom level to fully understand the dynamic learning environments created by person–situation and person–
person interactions.
More generally, ourfindings highlight the difficulties in identify-ing environments that matter, especially at the level of the individual. Future studies should consider multiple measures of the environment that individually explain a small proportion of the variance, but when combined into an environmental index, can explain larger propor-tions of the variance.
A further potential limitation is the use of perceptions of the envi-ronment rather than observer ratings. We are not aware of any genet-ically sensitive investigations of observer ratings in the classroom, but genetic influences have been found for observer ratings of the home environment (O'Connor, Hetherington, Reiss, & Plomin, 1995), suggesting that the genetic influence is not simply a by-product of using self-ratings of experience. Finally, although members of each twin pair were in the same school, we do not have information about whether the twins were in the same or different science class-rooms at age 14. However, we do know that similar proportions of MZ and DZ twins are in the same classroom at earlier ages in TEDS (Kovas et al., 2007), suggesting that differences in classroom sharing are unlikely to explain the differences in the twin correlations for MZ and DZ twins.
4.3. Conclusions
[image:6.595.51.286.56.238.2]The science-learning environment shows genetic influence, indic-ative of gene–environment correlation, whereby individuals create, seek out or perceive environments that are correlated with their genetic propensities (Haworth, Asbury, Dale, & Plomin, 2011; Haworth, Wright, et al., 2010). Educational policy needs to acknowl-edge that the school environment is not something that just passively happens — rather humans create their own environments to a large extent, and evoke reactions from their environments (Plomin & Bergeman, 1991; Scarr & McCartney, 1983). Children bring both their genetic and environmental backgrounds to the classroom. They elicit responses from their teachers and peers, and select partic-ular peers in part because of genetic propensities, shaping their educational experience, and impacting their school performance. Fig. 1.Bivariate model between test and environment. Note. A = additive genetic;
C = shared environment; E = non-shared environment; 95% confidence intervals in parentheses for the genetic and environmental correlations between the test and environment. 95% confidence intervals for the ACE estimates can be found in
Acknowledgments
We gratefully acknowledge the on-going contribution of the parents and children in the Twins Early Development Study (TEDS). TEDS is supported by a programme grant (G0901245; previously G0500079) from the UK Medical Research Council; our work on environments and academic achievement is also supported by grants from the US Na-tional Institutes of Health (HD44454, HD46167 and HD059215), and the Government of the Russian Federation (grant 11.G34.31.003). CMAH is supported by a research fellowship from the British Academy; OSPD is supported by a Sir Henry Wellcome Fellowship (WT088984).
Appendix A. Items included in the science-learning environment scales
A) Science classroom
In my Science classes…
B) Peer environment
In relation to Science…
Note: the original questionnaire (Fraser & Kahle, 2007) included 7 and 5 items respectively for the class and peer environments. We dropped the item‘I repeat experiments to check results’from the class scale, and the item‘my friends work on science projects’from the peer scale. This was primarily to ensure consistency in the items we included for assessing the learning environment in other subjects (e.g. English and Mathematics).
References
Bates, T. C. (2008). Current genetic discoveries and education: Strengths, opportunities, and limitations. Mind Brain and Education, 2, 74–79.http: //dx.doi.org/10.1111/j.1751-228X.2008.00035.x.
Byrne, B., Coventry, W. L., Olson, R. K., Wadsworth, S. J., Samuelsson, S., Petrill, S. A., et al. (2010).“Teacher effects”in early literacy development: Evidence from a study of twins.Journal of Educational Psychology, 102(1), 32–42.http://dx.doi.org/10.1037/ a0017288.
Fraser, B. J. (1998). Classroom environment instruments: Development, validity and ap-plications.Learning Environments Research,1(1), 7–34.http://dx.doi.org/10.1023/A: 1009932514731.
Fraser, B. J., & Kahle, J. B. (2007). Classroom, home and peer environment infl u-ences on student outcomes in science and mathematics: An analysis of systemic reform data. International Journal of Science Education, 29(15), 1891–1909.http://dx.doi.org/10.1080/09500690601167178.
Fraser, B. J., & Walberg, H. J. (1981). Psychosocial learning environment in science classrooms: A review of research.Studies in Science Education, 8(1), 67–92.
http://dx.doi.org/10.1080/03057268108559887.
Grigorenko, E. L. (2007). How can genomics inform education?Mind Brain and Education, 1, 20–27.http://dx.doi.org/10.1111/j.1751-228X.2007.00001.x.
Halpern, D. F., Benbow, C. P., Geary, D. C., Gur, R. C., Hyde, J. S., & Gernsbacher, M. A. (2007). The science of sex differences in science and mathematics.Psychological Science in the Public Interest,8, 1–51.http://dx.doi.org/10.1111/j.1529-1006.2007.00032.x. Hanscombe, K. B., Haworth, C. M. A., Davis, O. S. P., Jaffee, S. R., & Plomin, R. (2010). The
nature (and nurture) of children's perceptions of family chaos.Learning and Individual Differences,20(5), 549–553.http://dx.doi.org/10.1016/j.lindif.2010.06.005.
Haworth, C. M. A., Asbury, K., Dale, P. S., & Plomin, R. (2011). Added value measures in education show genetic as well as environmental influence. PLoS One, 6(2), e16006.http://dx.doi.org/10.1371/journal.pone.0016006.
Haworth, C. M. A., Dale, P. S., & Plomin, R. (2009). The etiology of science performance: Decreasing heritability and increasing importance of the shared environment from 9 to 12 years of age.Child Development,80, 662–673.http://dx.doi.org/10.1111/j. 1467-8624.2009.01289.x.
Haworth, C. M. A., Dale, P. S., & Plomin, R. (2010). Sex differences in school science performance from middle childhood to early adolescence.International Journal of Educational Research,49, 92–101.http://dx.doi.org/10.1016/j.ijer.2010.09.003. Haworth, C. M. A., Harlaar, N., Kovas, Y., Davis, O. S. P., Oliver, B. R.,
Hayiou-Thomas, M. E., et al. (2007). Internet cognitive testing of large samples needed in genetic research. Twin Research and Human Genetics, 10(4), 554–563.http://dx.doi.org/10.1375/twin.10.4.554.
Haworth, C. M. A., Kovas, Y., Dale, P. S., & Plomin, R. (2008). Science in elementary school: Generalist genes and school environments.Intelligence, 36, 694–701.
http://dx.doi.org/10.1016/j.intell.2008.04.002.
Haworth, C. M. A., & Plomin, R. (2011). Genetics and education: Toward a genetically sensitive classroom. In K. R. Harris, S. Graham, & T. Urdan (Eds.),APA educational psychology handbook. Theories, constructs, and critical issues,Vol. 1, Washington, DC, US: American Psychological Association.http://dx.doi.org/10.1037/13273-018. Haworth, C. M. A., Wright, M. J., Luciano, M., Martin, N. G., De Geus, E. J. C., Van Beijsterveldt, C. E. M., et al. (2010). The heritability of general cognitive ability increases linearly from childhood to young adulthood.Molecular Psychiatry,15, 1112–1120.http://dx.doi.org/10.1038/mp.2009.55.
Kendler, K. S., & Baker, J. H. (2007). Genetic influences on measures of the environment: A systematic review.Psychological Medicine,37, 615–626.http://dx.doi.org/10.1017/ S0033291706009524.
Kovas, Y., Haworth, C. M. A., Dale, P. S., & Plomin, R. (2007). The genetic and envi-ronmental origins of learning abilities and disabilities in the early school years.Monographs of the Society for Research in Child Development,72(3).
http://dx.doi.org/10.1111/j.1540-5834.2007.00439.x(vii-160).
Lehmann, E. L. (1975).Nonparametrics: Statistical methods based on ranks.San Francisco, CA: Holden-Day.
McGue, M., & Bouchard, T. J. (1984). Adjustment of twin data for the effects of age and sex.Behavior Genetics,14, 325–343.http://dx.doi.org/10.1007/BF01080045. Neale, M. C., Boker, S. M., Xie, G., & Maes, H. (2006).Mx: Statistical modeling VCU Box
900126, Richmond, VA 23298. (7th edn). Department of Psychiatry.
Neale, M. C., & Maes, H. M. (2001).Methodology for genetic studies of twins and families. Dordrecht, Nether- lands: Kluwer Academic.
O'Connor, T. G., Hetherington, E. M., Reiss, D., & Plomin, R. (1995). A twin-sibling study of observed parent–adolescent interactions. Child Development, 66, 812–829.http://dx.doi.org/10.2307/1131952.
Oliver, B. R., & Plomin, R. (2007). Twins' Early Development Study (TEDS): A multivar-iate, longitudinal genetic investigation of language, cognition and behavior prob-lems from childhood through adolescence.Twin Research and Human Genetics, 10, 96–105.http://dx.doi.org/10.1375/twin.10.1.96.
Plomin, R., & Bergeman, C. S. (1991). The nature of nurture: Genetic influences on
“environmental”measures.Behavioral and Brain Sciences,14, 373–427. Plomin, R., DeFries, J. C., Knopik, V. S., & Neiderhiser, J. M. (2012).Behavioral Genetics
(6th edition). New York: Worth.
Plomin, R., DeFries, J. C., & Loehlin, J. C. (1977). Genotype–environment interaction and correlation in the analysis of human behaviour.Psychological Bulletin,85, 309–322.
http://dx.doi.org/10.1037/0033-2909.84.2.309.
Price, T. S., Freeman, B., Craig, I., Petrill, S. A., Ebersole, L., & Plomin, R. (2000). Infant zygosity can be assigned by parental report questionnaire data.Twin Research,3, 129–133.http://dx.doi.org/10.1375/136905200320565391.
Rijsdijk, F. V., & Sham, P. (2002). Analytic approaches to twin data using structural equation models.Briefings in Bioinformatics,3, 119–133.http://dx.doi.org/10.1093/bib/3.2.119. Rutter, M., Pickles, A., Murray, R., & Eaves, L. (2001). Testing hypotheses on specific
environmental causal effects on behavior.Psychological Bulletin,127(3), 291–324.
http://dx.doi.org/10.1037/0033-2909.127.3.291.
Scarr, S., & McCartney, K. (1983). How people make their own environments: A theory of genotype→environmental effects.Child Development,54, 424–435. Shrout, P. E., & Fleiss, J. (1979). Intraclass correlations: Uses in assessing rater reliability.
Psychological Bulletin,86, 420–428.http://dx.doi.org/10.1037//0033-2909.86.2.420. Sternberg, R. J., & Grigorenko, E. L. (1999). Myths in psychology and education
regard-ing the gene–environment debate.Teachers College Record,100, 536–553. Walker, S. O., & Plomin, R. (2006). Nature, nurture, and perceptions of the classroom
environment as they relate to teacher assessed academic achievement: A twin study of 9-year-olds. Educational Psychology, 26, 541–561. http://dx.doi.org/10.1080/ 01443410500342500.
Answer options: almost never; seldom; sometimes; often; very often
1. My friends talk about Science outside of class. 2. My friends discuss things they have learned in Science. 3. My friends enjoy doing Science-related activities outside of class. 4. My friends are interested in Science.
Answer options: almost never; seldom; sometimes; often; very often
1. My teacher asks questions that have more than one answer. 2. My teacher asks me to give reasons for my answers. 3. My teacher encourages me to ask questions. 4. I learn from my classmates.
5. I use information to support my answers.