JHEP06(2015)100
Published for SISSA by SpringerReceived: February 23, 2015 Revised: May 6, 2015 Accepted: May 27, 2015 Published: June 16, 2015
Differential top-antitop cross-section measurements as
a function of observables constructed from final-state
particles using pp collisions at
√
s
= 7
TeV in the
ATLAS detector
The ATLAS collaboration
E-mail: [email protected]
Abstract: Various differential cross-sections are measured in top-quark pair (t¯t) events produced in proton-proton collisions at a centre-of-mass energy of√s= 7 TeV at the LHC with the ATLAS detector. These differential cross-sections are presented in a data set corresponding to an integrated luminosity of 4.6 fb−1. The differential cross-sections are presented in terms of kinematic variables, such as momentum, rapidity and invariant mass, of a top-quark proxy referred to as the pseudo-top-quark as well as the pseudo-top-quark pair system. The dependence of the measurement on theoretical models is minimal.
The measurements are performed on t¯t events in the lepton+jets channel, requiring exactly one charged lepton and at least four jets with at least two of them tagged as originating from a b-quark. The hadronic and leptonic pseudo-top-quarks are defined via the leptonic or hadronic decay mode of the W boson produced by the top-quark decay in events with a single charged lepton. Differential cross-section measurements of the pseudo-top-quark variables are compared with several Monte Carlo models that implement next-to-leading order or leading-order multi-leg matrix-element calculations.
Keywords: Hadron-Hadron Scattering, Top physics
JHEP06(2015)100
Contents
1 Introduction 2
2 Measurement definition 3
2.1 Particle objects 4
2.2 Kinematic range of objects 4
2.3 Hadronic and leptonic pseudo-top-quark definition 5
2.4 Kinematic comparison of the parton-level top-quark with the pseudo-top-quark 6
3 ATLAS detector 7
4 Monte Carlo simulation 8
5 Data sample and event selection 11
5.1 Object reconstruction 11
5.2 Event selection 13
5.3 Estimation of backgrounds 13
6 Systematic uncertainties 15
6.1 Signal modelling 15
6.2 Background modelling 16
6.3 Experimental uncertainties 16
7 Reconstructed yields and distributions 18
8 Corrections for detector effects and channel combinations 21
8.1 Correction procedure 21
8.2 Propagation of uncertainties 24
8.3 Combination of lepton channels 25
9 Results 25
10 Conclusions 30
JHEP06(2015)100
1 Introduction
The large number of top-quark pair (tt¯) events produced at the Large Hadron Collider (LHC) has allowed the ATLAS [1] and CMS [2] experiments to perform precise inclusive and differential top-quark related cross-section measurements. Both experiments have recently published measurements of the inclusivett¯production cross-section in proton-proton (pp) collisions at centre-of-mass energies,√s, of 7 and 8 TeV [3–14] as well as differential cross-section measurements as functions of the top-quark transverse momentum (pT) and rapidity (y), and of the mass (mt¯t) andyof thett¯system [15–17]. These cross-section measurements
triggered recent work on Quantum Chromodynamics (QCD) calculations of heavy quark production [18–23].
Precision measurements of tt¯production provide the opportunity to conduct tests of predictions based on perturbative QCD and gain direct information on the gluon parton distribution function (PDF) at large momentum fractions (xBj) of about 0.1–0.5 [24]. Dif-ferentialtt¯measurements are particularly sensitive to thet¯tproduction mechanism in QCD in a region of parton momentum fractions at large momentum transfers. Such studies can lead to improvements in background predictions for Higgs measurements and searches for physics beyond the Standard Model (SM).
In the SM, a top-quark decays to a W boson and a b-quark with a branching fraction close to unity. Hence there are threet¯tsignatures that correspond to different decay modes of theW bosons. The signal for this study is in the single-lepton channel. It corresponds to the case where oneW boson decays directly, or via an intermediateτ decay, into an electron or muon and at least one neutrino, and the other into a pair of quarks. The neutrino(s) will escape the detector unseen, leading to missing transverse momentum whose magnitude is denoted by Emiss
T .
The model dependencett¯differential cross section measurements presented at the level of top quarks, i.e. corrected for parton shower effects and hadronisation, has been an ongo-ing concern. This paper presents differentialt¯t cross-section measurements using a defini-tion where the variables are constructed from an object that is directly related to detector-level observables. This top-quark proxy object is referred to as the pseudo-top-quark (ˆt). The goal of presenting measurements using a definition where the variables are constructed from reconstructed charged lepton, jet and missing transverse momentum objects, is to allow precision tests of QCD in final states with top-quarks, using reconstructed objects that avoid large model-dependent extrapolation corrections to the parton-level top-quark but remain well correlated with corresponding objects reconstructed from the partons.
JHEP06(2015)100
The ˆt object can be evaluated for hadronic or leptonic decays of the top-quark from the detector information or analogously from the stable final-state particles generated by MC simulations. The differential cross-sections are measured as functions of the transverse momentum pT(ˆt) and rapidity y(ˆt) of the leptonic (ˆtl) and the hadronic (ˆth) pseudo-top-quark as well as the transverse momentum pT(ˆtlˆth), rapidity y(ˆtlˆth) and invariant mass m(ˆtlˆth) of the reconstructedt¯tsystem (ˆtlˆth).
This paper is structured as follows. The definition of ˆttogether with the detector-level or particle-level objects used to construct ˆtare presented in section2. The correlation in MC simulation between reconstructed ˆt observables and corresponding top-quark observables at the parton level is also discussed in this section. Section 3 provides a short overview of the ATLAS detector. A description of the different MC samples in the study is found in section 4. The data and MC event selection is described in section 5 together with the reconstruction of final-state objects. Section 6 covers the treatment and evaluation of systematic uncertainties. Comparisons between data and MC simulation, for the yields and pseudo-top-quark distributions before unfolding, are presented in section 7. A description of the unfolding, the results obtained for data and various MC models and concluding remarks are found in sections 8,9and 10, respectively.
2 Measurement definition
The model dependence of parton-level t¯tcross section measurements has been an ongoing concern for QCD studies in particular in events with top quarks. The use of particle-based definitions in cross-section measurements is a standard methodology in high-energy physics [25, 26] to reduce the model dependence. Standardised tools exist to compare theory predictions for such measurements [27–29]. In t¯t events, such measurements were published for the inclusive cross-section [3, 4] and for differential cross-section measure-ments as a function of the transverse momentum and the rapidity of the final-state leptons and jets [17,30–32]. In this paper the concept of the particle-based cross-section definition is extended to the kinematic properties of the top-quark decay products that when correctly combined are closely related to the kinematic properties of the top-quark. An operational definition ˆt that is defined from measured observables as described below has been intro-duced to reduce the model dependence of the measurements.1 This operational definition should result in a good correlation between the ˆt object and the top parton for a given Monte Carlo generator. However, it is not necessary that the algorithms lead to the best possible correlation to the parton-level kinematics or the best signal to background ratio.
The differential cross-section measurements in this paper are presented in terms of the kinematics of the ˆt object, introduced in section 1. The identification of reconstructed charged lepton, jet andEmiss
T objects from actual or simulated detector signals is discussed in section 5.1. The identification of particle-level objects for MC events is discussed in section 2.1. The kinematic fiducial region for both the reconstructed and particle-level objects is defined in section 2.2. The algorithm used to construct leptonic or hadronic
1Discussions related to an operational definition have occurred between experimentalists and theorists
JHEP06(2015)100
ˆ
t objects from either reconstructed detector-level objects or from particle-level objects is described in section2.3.
The measurements presented in this paper can be directly compared to MC simulations using matrix-element calculations for the hard scattering, interfaced with parton shower and hadronisation models. These are referred to as particle-level predictions. For comparisons to fixed-order QCD calculations, corrections for the transition from partons to hadrons need to be applied.
2.1 Particle objects
In the case of MC simulation, objects can be identified at the particle level. Leptons and jets are defined using particles with a mean lifetimeτ >3×10⁻¹¹s that are directly produced in pp interactions or from subsequent decays of particles with a shorter lifetime. The lepton definition only includes prompt electrons, muons and neutrinos not originating from hadron decays as well as electrons, muons and neutrinos from tau decays. The electron and muon four-momenta are calculated after the addition of any photon four-momenta, not originating from hadron decay. The electron and muon four-momenta are defined to include any photons not originating from hadron decays that are found within ∆R = p
(∆φ)2+ (∆η)2<0.1 with respect to the lepton direction. The direction of the photons is required to be within ∆R =p(∆φ)2+ (∆η)2 = 0.1 with respect to the lepton direction.2
The missing transverse momentum vector and its associated azimuthal angle are evaluated from the sum of the neutrino four-momenta, where all neutrinos from W boson and τ
decays are included. Jets are defined by the anti-ktalgorithm [33] with a radius parameter of 0.4. The jets include all stable particles except for the selected electrons, muons and neutrinos, and the photons associated with these electrons or muons. The presence of one or moreb-hadrons withpT>5 GeV associated to a jet defines it as ab-jet. To perform the matching between b-hadrons and jets, the b-hadron energy is scaled to a negligible value and included in the jet clustering (ghost-matching) [34].
2.2 Kinematic range of objects
The cross-section measurement is defined in a kinematic region where the reconstructed physics objects have a high reconstruction efficiency (fiducial region). The kinematic region is chosen such that the kinematic selections of the physics objects reconstructed in the detector and of the particle objects are as close as possible. The fiducial region is defined in the same way for reconstructed physics and particle objects. However, on detector-level some additional selections can be applied.
Electrons, muons and jets are required to satisfy pT > 25 GeV and |η| < 2.5. The fiducial volume is defined by requiring exactly one muon or electron, four or more jets of which at least two are b-jets, Emiss
T > 30 GeV and a W boson transverse mass mT(W) >
2ATLAS uses a right-handed coordinate system with its origin at the nominal interaction point (IP) in
JHEP06(2015)100
35 GeV.3 Events are discarded if the electron or muon is within ∆R= 0.4 of a jet, or two jets are within ∆R= 0.5 of each other.
2.3 Hadronic and leptonic pseudo-top-quark definition
The definition of ˆt as a hadronic or leptonic object is determined by the decay of the W
boson. In the cross-section definition used in this paper, the two highest pT b-jets are assumed to be theb-jets from the top-quark decay.
• In the case of ˆtl, the leptonically decayingW boson is constructed from the electron or muon and the Emiss
T . The b-jet with the smallest angular separation (∆R) from the electron or muon is then assigned as a decay product of ˆtl. Using the measured W boson mass,mW = 80.399 GeV [35], and the components of the missing transverse momentum vector (denoted aspx,ν, py,ν) associated with theW boson decay neutrino, thepz,ν of the neutrino can be constrained:
(Eℓ+Eν)2−(px,ℓ+px,ν)2−(py,ℓ+py,ν)2−(pz,ℓ+pz,ν)2 =m2W,
where the subscript ℓrefers to the electron or muon. Neglecting the neutrino mass, thepz,ν of the neutrino is taken from the solution of the resulting quadratic equation:
pz,ν = −
b±√b2−4ac
2a ,
where
a=Eℓ2−p2z,ℓ b=−2kpz,ℓ c=Eℓ2p2T,ν−k2
and
k= m
2 W −m2ℓ
2 + (px,ℓpx,ν+py,ℓpy,ν).
If both solutions are real, the solution with the smaller|pz,ν|is chosen. In cases where (b2−4ac) is less than zero, p
z,ν is taken as:
pz,ν =− b
2a.
Given the value of pz,ν, ˆtl is formed from the combination of the charged lepton, neutrino and assigned b-jet.
• In the case of ˆth, the hadronically decayingW boson is constructed from the remaining two highest-pT jets. The ˆth is then defined from the hadronically decayingW boson candidate and the remaining b-jet.
Once the leptonic and hadronic ˆt are defined, their four-momenta can be evaluated, and used in the measurement to define, for example the transverse momentum (pT(ˆtl) or pT(ˆth)), the rapidity (y(ˆtl) or y(ˆth)) and the transverse momentum (pT(ˆtltˆh)), rapidity (y(ˆtlˆth)) and invariant mass (m(ˆtlˆth)) of the reconstructed t¯tsystem.
In summary, three different definitions are used in the following sections:
3TheW boson transverse mass m
T(W) is defined as
p
2pℓ
TpνT(1−cos(φℓ−φν)), where ℓand ν refer
to the charged lepton (eor µ) and the missing transverse momentum vector, respectively. The symbol φ
JHEP06(2015)100
• Aparton-level top-quark is the MC generator-level top-quark selected before it decays
but after any radiative emissions;4
• A particle-level pseudo-top-quark (hadronic and leptonic) is defined by stable
generator-level particles within the described acceptance;
• Adetector-level pseudo-top-quark (hadronic and leptonic)is evaluated with the use of
physics objects reconstructed from detector measurements as discussed in section5.1.
Detector-level distributions of ˆtvariables are corrected for detector efficiency and reso-lution effects to allow comparison with distributions of equivalent particle-level ˆt variables (see section 8). Therefore any MC model that simulates the final-state particles from pp
collisions can be compared to these data. This makes existing or future MC model compar-isons possible, independent of the presence of top-quark partons in the MC event record. For comparisons of data to simulation it is not necessary to use the tt¯kinematic recon-struction method with the best performance, but it is important that the method is well defined and the same definition is applied to data and simulation.
2.4 Kinematic comparison of the parton-level top-quark with the pseudo-top-quark
The pseudo-top-quark definition is chosen such that it is closely related to the top-quark parton provided by QCD calculations.
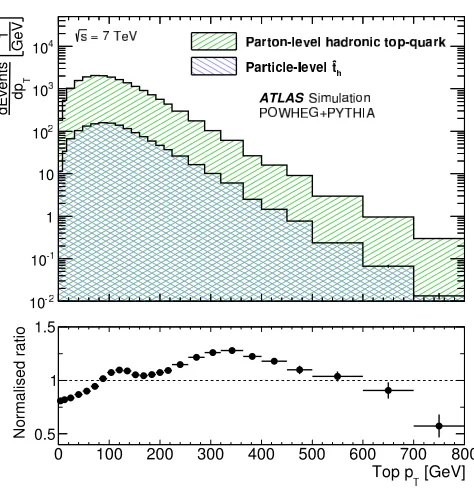
Figure 1compares the parton-level pT distribution of the top-quark with the particle-levelpTdistribution of the pseudo-top-quark. The two distributions are shown for the same integrated luminosity, using the powheg+pythiaMonte Carlo generator (see section 4). The number of events with a reconstructed ˆt is much smaller than the total number of generated t¯t events. This is primarily due to the requirement of a single lepton, four jets and the pseudo-top construction efficiency.
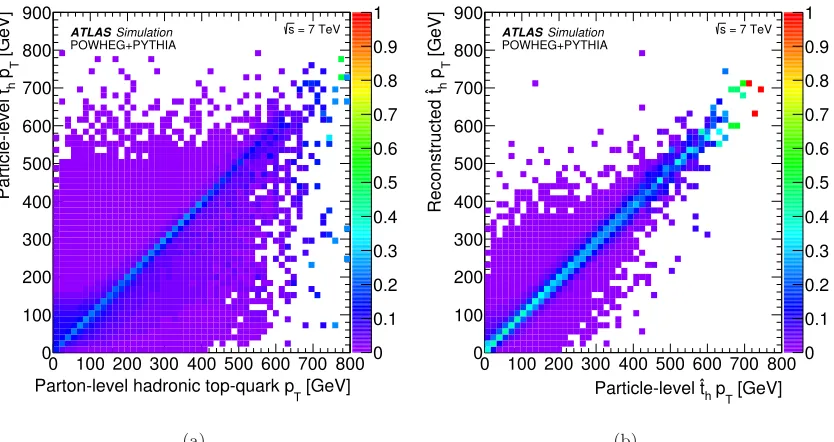
The ratio of the normalised distributions illustrates the shape difference. The larger phase space of the parton-level distribution results in a softer pT distribution when com-pared with the pseudo-top-quark distribution where fiducial cuts are applied. In addition, with increasingpT, the decay products tend to be more collimated due to their large boost resulting in a reduced pseudo-top reconstruction efficiency. Using the same Monte Carlo sample, figure 2(a) shows the correlation between the generated parton-level pT distribu-tion and the particle-level hadronic pseudo-top-quark pT. About 50% of the events show a strong correlation between the top quark parton and the particle-level ˆth. These are the cases where the correct combination of the final state object was found to reconstruct the particle-level ˆth. Despite the good correlation, there remains a significant bin migration in the region populated by the majority of top-quarks. These migrations can be affected by a change in the modelling oft¯tproduction. This makes any measurement extrapolated to the
4The four-momenta of the top-quarks produced in the hard scattering 2→2 process are modified after
JHEP06(2015)100
Figure 1. Simulated event distribution of the parton-level top-quark pT distribution for all
events (green), and the particle-level pseudo-top-quarkpT(ˆth) for events within the fiducial region
(blue). In both cases the top-quark that decays hadronically is chosen. The distributions are evaluated for the same event sample based onpowheg+pythiaat√s= 7 TeV. The upper figure is made for an arbitrary integrated luminosity. The lower figure shows the ratio of the particle-level ˆ
th over the parton-level top-quark normalised distributions to emphasise the difference in shape
between the two.
parton level model-dependent. However, there is a much stronger correlation between the the hadronic particle-level and detector-level pseudo-top-quark pT distributions as shown in figure2(b). Hadronic pseudo-top-quark measurements that are presented at the particle level are therefore less affected by model-dependent corrections.
3 ATLAS detector
JHEP06(2015)100
[image:9.595.91.508.89.310.2](a) (b)
Figure 2. (a) Monte Carlo study using the nominal powheg+pythia MC sample showing the correlation between the parton-level top-quarkpTand the particle-level hadronic
pseudo-top-quarkpTand (b) the correlation between the particle-level hadronic pseudo-top-quarkpTand the
hadronic pseudo-top-quarkpTevaluated from reconstructed objects. In each case the correlation is
normalised to all the events within a bin on the horizontal axis.
and forward regions are instrumented with LAr calorimeters for both the electromagnetic and hadronic energy measurements up to|η|= 4.9. The MS toroid magnets are arranged with an eight-fold azimuthal coil symmetry around the calorimeters. Three layers of muon spectrometer chambers surround the toroids. High-precision drift tubes and, at small radius in the end-cap, region cathode strip chambers provide an independent momentum measurement. Resistive plate chambers in the central region and fast thin gap chambers in the end-cap region provide a muon trigger.
Data are selected from inclusive pp interactions using a three-level trigger system. A hardware-based first-level trigger is used to initially reduce the trigger rate to approximately 75 kHz. The detector readout is then available for two stages of software-based (higher-level) triggers. In the second level, partial object reconstruction is carried out to improve the selection and at the last level, the event filter, a full online event reconstruction is made to finalise the event selection. During the 2011 run period, the selected event rate for all triggers following the event filter was approximately 300 Hz.
4 Monte Carlo simulation
JHEP06(2015)100
calculation for up to five additional partons, which are subsequently matched to parton showers [43]. A common feature of the samples, unless stated otherwise, is the generation of the underlying event and parton shower, which is either performed bypythia(v6.425) [44] or by herwig (v6.520) [45] together with jimmy (v4.31) [46]. The programtauola [47] is used for the decays ofτ-leptons and photos [48] for photon radiation.
A powheg sample was generated using the version powheg-hvq p4 [39], with the
ct10nlo PDF set [49] and the default factorisation and renormalisation scales set to
Q2 =m2
t+p2T, wheremtis the top-quark mass andpTthe top-quark transverse momentum as evaluated for the underlying Born configuration (i.e. before radiation). The powheg
matrix-element calculation was interfaced withpythia, using the “C” variant of the Perugia 2011 tunes [50] and the corresponding cteq6l1 PDF set [51]. This sample is referred to as “powheg+pythia” and is the benchmark signal sample in this study.
An additional powheg sample was generated in order to compare the parton shower and fragmentation models. It was interfaced withherwigtogether withjimmyfor the un-derlying event model using the AUET2 tune [52] (“powheg+herwig”). To evaluate the im-portance of the gluon PDF on the final corrected distributions, an alternativepowheg sam-ple was produced with theherapdf15nloPDF set [53] (“powheg(herapdf)+pythia”). This PDF set is based on HERA I data together with the inclusion of the precise high-Q2
preliminary HERA II data. Simulations using this PDF set are in good agreement with earlyW andZ boson production measurements at the LHC [54].
To compare the powheg predictions, alternative samples were generated using
mc@nlo (v4.01) with the ct10nlo PDF set and its default renormalisation and fac-torisation scales: Q2 = ((p2
T,t+p2T,¯t)/2) +m 2
t. mc@nlo was interfaced to herwig and
jimmy, using the AUET2 tune (“mc@nlo+herwig”).
To assess the modelling of LO matrix-element calculations for additional partons, the
alpgen[42] generator (v2.13) was used together with thecteq6l1PDF set and associated strong coupling constant,αS(mZ) = 0.129. The produced processes correspond to the LO matrix elements for t¯twith five inclusive associated partons and t¯t+b¯b andt¯t+c¯cstates, at its default renormalisation scale and with the factorisation scale set toQ2 =P
m2+p2 T. Here the sum runs over heavy quarks and light jets5with massmand transverse momentum
pT. Thealpgensamples were interfaced withherwigandjimmy, using the MLM parton-jet matching scheme [42] with a matching scale of 20 GeV. The exclusive heavy-flavour samples were combined with the inclusive samples, after the removal of overlapping events. This sample is referred to as “alpgen+herwig”.
Both the NLO matrix-element-based MC models and the LO multi-leg MC models have higher-order correction uncertainties that can be estimated in terms of initial-state radiation (ISR) and final-state radiation (FSR) variations. alpgen (v2.14) is used to generate t¯t samples with the cteq5l PDF set [55], the pythia parton shower and the Perugia 2011 tune. Nominal and shifted ISR/FSR samples were produced with an αS corresponding to ΛQCD = 0.26 GeV as used in the Perugia tune and by modifying the
5Defined to be a jet comprising gluons and light quarks and subsequently used in the MLM matching
JHEP06(2015)100
renormalisation scale at each local vertex in the matrix element by a factor of 2.0 (0.5) relative to the original scale to obtain more (less) radiation. The renormalisation scale is varied by the same factor in the matrix-element calculation andpythia, where the radHi and radLo Perugia 2011 pythia tunes are used [50]. These samples are referred to as
alpgen+pythia(αS Up) and alpgen+pythia(αS Down), respectively. The selected αS values are found to produce variations that are similar to the uncertainty band of cross-section measurements fort¯tevents with additional jet activity, as described in ref. [30]. The effect of colour reconnection is estimated by generating apowheg+pythiasample in which no colour reconnection is allowed within pythia, using the noCR Perugia 2011 tune [50].
The total inclusive t¯t cross-section for pp collisions at √s = 7 TeV is calculated to be σtt¯ = 177+10−11 pb for a top-quark mass mt = 172.5 GeV. This calculation is carried out at leading order (NNLO) in QCD including resummation of next-to-next-to-leading logarithmic (NNLL) soft gluon terms [56–61] withtop++(v2.0) [62]. All
t¯tMC samples were generated withmt= 172.5 GeV and were normalised to the theoretical NNLO+NNLL cross-section prediction.
For the simulation of background processes, samples of W and Z bosons produced in association with jets were generated usingalpgen(v2.13) with LO matrix elements for up to five inclusive associated partons. Thecteq6l1PDF set and theherwigparton shower were used. In addition to the inclusive jet-flavour processes, separate samples ofW b¯b+jets,
W c¯c+jets,W c+jets andZb¯b+jets matrix-element processes with three additional partons were generated and the overlap between them removed. The normalisation of theW+jets samples were determined from data as described in section 5.3. The Z+jets samples are normalised to the cross-section obtained from an NLO QCD calculation with mcfm [63] using the mstw2008nloPDF set [64].
A sample oft-channel single top-quark decays was generated using theacermc gener-ator [65] (v3.8), whilemc@nlowas used to generateW t-channel ands-channel processes. Each of these samples is normalised according to an NLO+NNLL calculation for the cor-responding t-channel [66], s-channel [67] and W t-channel [68] processes. Diboson events (W W,W Z,ZZ) were produced usingherwigand normalised to the cross-section obtained from an NLO QCD calculation withmcfm using the mstw2008nloPDF set.
To properly simulate the LHC environment, additional inelastic pp interactions were generated withpythiausing the AMBT1 tune [69] and then overlaid on the hard process. The MC events are weighted such that the distribution of the generated mean number ofpp
collisions per bunch crossing (hµi) matched that of the data-taking period. The particles from additional interactions are added before the signal digitisation and reconstruction steps of the detector simulation, but are not used within the particle-level measurement defined in section2.
JHEP06(2015)100
5 Data sample and event selection
The data are selected from the full 2011 data-taking period. Events are required to meet baseline data quality criteria during stable LHC running periods. These criteria reject data with significant detector noise or read-out problems and depend on the trigger con-ditions and the reconstruction of physics objects. The resulting data set corresponds to an integrated luminosity of 4.59±0.08 fb−1 [72]. During this period, the LHC delivered instantaneous luminosities that were sufficient to produce severalppinteractions within the same bunch crossing (in-time pile-up). Interactions in adjacent bunch crossings also influ-enced the detector and readout signals in the selected bunch crossing. The mean number of in-time pile-up interactions, hµi, was measured by averaging over allpp bunch crossings in a given luminosity block. The average value ofhµiwas approximately 5 at the beginning of the data-taking period and as high as 18 by the end of the 2011 run.
5.1 Object reconstruction
Primary vertices are formed from tracks reconstructed in the ID. The selected primary vertex is required to include at least four reconstructed tracks satisfyingpT>0.4 GeV and to be consistent with the pp beam collision region in the transverse plane. In the cases where more than one primary vertex with at least four tracks is reconstructed, the vertex with the highestP
p2T of the associated tracks is chosen and assumed to be associated with the hard process.
Electron candidates are identified as electromagnetic energy deposits (clusters) matched to a reconstructed track in the ID [73]. Selected electrons are required to satisfy stringent identification criteria. The reconstructed tracks are required to have a minimal number of pixel and SCT hits among those expected along the electron trajectory and at least a minimum number of high-threshold TRT hits. The longitudinal and lateral shower profiles in the calorimeter are required to match those expected for an electron, with a satisfactory match between the cluster energy and the reconstructed track momentum.
To reduce the rate of events with non-prompt and fake lepton signatures from multi-jet background processes, electrons are required to be isolated within both the calorimeter and ID. The calorimeter isolation is defined using a cone of size ∆R = 0.2 around the electron direction. The transverse energy sum of the clusters found in the cone is calculated and required to be less than 10% of the electron transverse energy, after excluding the calorimeter cells associated with the electron cluster and correcting for leakage from the electron cluster. The ID-based isolation is calculated using the summed track-pT within a ∆R = 0.3 cone around the electron direction and is required to be less than 10% of the electron track pT. Electrons are selected by requiring pT > 25 GeV in the range
|η|< 2.47, excluding the barrel/end-cap transition region of 1.37 <|η|< 1.52. Electrons with pT >15 GeV are used for the object overlap removal discussed later in this section and to remove events with two or more leptons as discussed in section 5.2.
JHEP06(2015)100
improved pT resolution. Reconstructed tracks are required to have a hit in the innermost pixel layer if expected from the track trajectory and at least a minimum number of pixel and SCT hits, set below the number of expected hits on a muon trajectory. Muons crossing the TRT are required to have a hit pattern consistent with a well-reconstructed track.
To further reduce the fake muon background, muons are required to be isolated within the calorimeter and ID. The calorimeter isolation is determined using using calorimeter energy deposits in a ∆R = 0.2 cone around the direction of the muon and is required to be less than 4 GeV. The ID isolation is determined from the summed pT of tracks in a ∆R= 0.3 cone around the direction of the muon and is required to be less than 2.5 GeV, excluding thepTof the muon. The muon channel event selection requires the reconstruction of one muon withpT >25 GeV associated with the selected primary vertex. Muons with pT > 15 GeV are used to define an additional lepton veto discussed in section 5.2. Both types of muons are selected within|η|<2.5.
Topological clusters [75] are formed from calorimeter energy deposits. Jets are recon-structed from these clusters with the anti-ktalgorithm [33] with a radius parameter of 0.4. The jets are calibrated using the EM+JES scheme, where the jet energy scale (JES) is derived as a correction of the initial calorimeter calibration set for electromagnetic show-ers [76]. The jet energy is corrected for the effect of additional pp collisions in data and MC events.
To correct for energy losses due to non-compensation in the calorimeter, uninstru-mented material and detector subsystems in front of the calorimeter, jet energy corrections factors are applied that depend on the jet energy and the jet η to achieve a calibration that matches the energy of stable particle jets in simulated events (excluding neutrinos and muons).
Differences between data and Monte Carlo simulation are evaluated using in situ tech-niques and are corrected in an additional step [77]. The in situ calibration exploits thepT balance in events with aZ boson (Z+jet) or a photon (γ+jet) and a recoiling jet and dijet events. Z+jet andγ+jet data are used to set the JES in the central detector region, while
pT balancing in dijet events is used to achieve an η intercalibration of jets in the forward region with respect to central jets
The calibrated jets are required to satisfy pT >25 GeV and be within the range |η|< 2.5. Jets associated with large energy deposits from additionalpp interactions are removed by requiring that the pT sum of the reconstructed tracks matched with the jet and the selected primary vertex is at least 75% of the total pT sum of all tracks associated to the jet. This quantity is referred to as the jet vertex fraction (JVF). Jets satisfyingpT >50 GeV are always accepted and jets having no associated tracks are also accepted.
The MV1 algorithm [78] is used to select jets associated with b-hadron decays. The algorithm combines several tagging algorithms into a single neural-network-based discrim-inant. Jets are identified as b-jets by using an MV1 discriminant tuned to achieve a 70% tagging efficiency for jets withpT>20 GeV in simulatedtt¯events. The corresponding rejec-tion factor for jets originating from gluons or light quarks is found to be approximately 130.
TheEmiss
JHEP06(2015)100
transverse energy deposited in calorimeter cells not associated with these objects, within the range|η|<4.9. The object classification scheme for the electrons, muons and jets used to calculate Emiss
T is chosen to be the same as the object definitions used in this analysis. Calorimeter cells not associated with an object are calibrated at the electromagnetic scale before being included in the Emiss
T calculation. This calibration scheme is similar to the one described in ref. [79].
Electron and jet objects are reconstructed using separate algorithms that are run in-dependently. Jets are reconstructed from topological clusters as described above, with no distinction made between identified electron and jet energy deposits within the electro-magnetic and hadronic calorimeters. Jets associated with an electron energy deposit are discarded using angular matching. For each electron, the jet with an axis closest to that of the electron direction, within ∆R < 0.2, is discarded. To remove leptons from heavy-flavour decays, the lepton is discarded if the lepton is found to be within ∆R < 0.4 of a selected jet axis.
5.2 Event selection
Data were collected by requiring either a high-pT electron trigger, based on calorimeter energy deposits, shower shape and track quality constraints, or a high-pT muon trigger that included a reconstructed track in the MS matched with a track in the ID. The electron trigger pT threshold was either 20 GeV or 22 GeV, depending on the data-taking period, whereas the muon trigger pT threshold remained at 18 GeV for the duration of the entire 2011 data taking period.
The selected events are required to contain at least one reconstructed primary vertex. A small number of events are rejected that included one or more jets of pT >20 GeV with energy that is identified as being from noise in the calorimeter electronics, from non-pp
collision background sources or cosmic-ray showers. Events where an identified electron and muon share the same reconstructed track in the ID are also removed.
Events are classified in the electron (muon) channel by the presence of one electron (muon) withpT>25 GeV, no additional electron or muon with pT >15 GeV and at least four reconstructed jets with pT>25 GeV and|η|<2.5 where at least two are identified as b-jets. To reduce the background contribution from non-prompt or fake leptons, Emiss
T > 30 GeV and mT(W) >35 GeV are also required. To reduce the effects of jet merging and migrations within the pT ordering of the jets described in section2, events with a pair of reconstructed jets separated by ∆R <0.5 are vetoed.
5.3 Estimation of backgrounds
JHEP06(2015)100
The fraction of dilepton events that remain after applying the full event selection is evaluated with a MC simulation and removed from the data. A bin-by-bin correction factor derived from the baseline powheg+pythiatt¯Monte Carlo simulation is used (see section 8). Contributions from single top-quark, Z+ jets and diboson (W W, W Z, ZZ) production are evaluated using corresponding MC samples and theoretical cross-sections for these processes, as discussed in section4.
The overall normalisation of the W+jets MC sample was determined in the data via a lepton charge asymmetry measurement described in ref. [15]. This method exploits the fact that the production of W bosons at the LHC is charge-asymmetric and also that the ratio of the number of W− to W+ bosons is more precisely known than the total number ofW bosons [80]. Most of the other background processes result in lepton charge distributions that are symmetric. The numbers of events with positively and negatively charged leptons are measured in the data and are referred to asNℓ+ and N−
ℓ , respectively.
A MC simulation was used to estimate the charge-asymmetric background from single top-quarks and to subtract that from the values ofNℓ+andN−
ℓ . The number ofW+jets events
was then extracted from:
NW+ +NW− =
rMC+ 1 rMC−1
(Nℓ+−N−
ℓ )
whererMCis the ratio of theW++jets andW−+jets production cross-sections determined using the W+jets MC simulation for the signal region kinematic cuts, and NW+ (NW−) is the number of W+ (W−) events. The W+ jets normalisation was determined using the event selection of this analysis, but without the b-tagging requirement. The values of (NW+ +NW−) are independently determined for W+ 4-jet and W+≥ 5-jet events and
are applied as inclusive scale factors to the alpgen W+jet processes. The normalisation was separately obtained for each of the MC systematic uncertainty evaluations listed in section 6.
The normalisation of the heavy-flavour fractions within theW+jets sample was deter-mined by measuring the number ofW+2-jet events, without ab-tagging requirement and with the requirement of at least oneb-tag. To make this measurement, the charge asymme-try technique described above was applied to both sets of selected events. The number of events that have one or moreb-tags is related to the number of events before theb-tagging requirement, theb-tagging probability and the flavour fractions in theW+jets sample. The simulated fractions for the heavy-flavour processes (W b¯b+jets, W c¯c+jets and W c+jets) are determined with the ratio W cc/W b¯ ¯b taken from simulation. The measurement used the number of events after requiring at least one b-tag where the overall normalisation of
W+jets events was fixed using the values previously determined by the charge asymmetry method. The heavy-flavour fractions are then extrapolated from theW+2-jet selection to
JHEP06(2015)100
Multi-jet production processes have a large cross-section and can provide a non-prompt or fake lepton signature due to interactions with detector material, electromagnetic shower fluctuations and heavy-flavour decays. In the electron channel, jets and electrons from photon conversions or heavy-flavour decays can mimic isolated electrons from W bosons. In the muon channel, the background is dominated by the decay of heavy-flavour hadrons to muons.
A matrix method [81] is used to estimate the number of background events using a second event sample for which the lepton identification criteria are relaxed and the isolation requirements removed (loose selection). The number of background events that pass the standard tight lepton selection described in section5.2(Nfaketight) is then given by:
Nfaketight = ǫfake
ǫreal−ǫfake
(ǫrealNloose−Ntight),
where ǫreal and ǫfake are the fractions of real and fake leptons that pass the loose and the tight selection andNloose (Ntight) is the number of events with a lepton passing the loose (tight) selection. The efficiency for a real lepton to pass the tight selection (ǫreal) is mea-sured using a tag-and-probe technique using leptons from Z boson decays. The efficiency for a loose background event to pass the tight selection (ǫfake) is estimated in control re-gions dominated by background. Contributions fromW+jets and Z+jets production are subtracted in the control regions using simulation.
In the electron channel the control region to determine ǫfake is defined by ETmiss < 20 GeV. In the muon channel two control regions with similar numbers of events are used. One control region has events with low-mT(W) while the other control region contains events where the selected muons have a large impact parameter. The efficiency ǫfake is extracted separately from the two background-enriched samples and the average is used.
6 Systematic uncertainties
The systematic uncertainties due to detector effects and the modelling of signal and back-ground are determined for each bin of the measured observables. Each systematic un-certainty is evaluated by varying the relevant source by one standard deviation about its nominal value. This effect is propagated through the event selection, unfolding and correc-tion procedure. Deviacorrec-tions from the nominal case are evaluated separately for the upward and downward variations for each bin, observable and channel. The total systematic un-certainty for each bin is calculated by adding the individual systematic contributions for that bin in quadrature.
The uncertainty on thet¯tsignal and background modelling are discussed in sections6.1
and 6.2. The detector-related uncertainties are presented in section6.3.
6.1 Signal modelling
JHEP06(2015)100
The uncertainty in modelling the parton shower and hadronisation is evaluated from the relative difference between the alpgen+pythia t¯t MC sample and the alternative
alpgen+herwigsample.
The evaluation of the uncertainty due to the choice of PDF set is obtained using the
nnpdf 2.0 [82], mstw2008nlo and cteq66 [83] PDF sets. An envelope of uncertainty bands is determined using the PDF4LHC recommendations [84].
The uncertainty associated with the modelling of additional QCD radiation accompa-nying the tt¯system is calculated by comparing the alpgen+pythia sample to the ones with varied radiation settings presented in section4. The variation is achieved by changing the renormalisation scale associated withαSconsistently in the hard-scattering matrix ele-ment as well as in the parton shower. The level of radiation through parton showering [85] is adjusted to encompass the ATLAS measurement of additional jet activity int¯tevents [30]. The uncertainty is estimated as the maximum difference between the specialised samples and the nominal sample, with the uncertainty being symmetrised.
6.2 Background modelling
The individual experimental and theoretical uncertainties are used to calculate the uncer-tainty on the size of background contributions determined by MC simulation. This results in an uncertainty on the background subtraction for all backgrounds except for those from
W+jets processes and from multi-jet processes resulting in a non-prompt or fake lepton signature.
In the muon channel the normalisation and shape uncertainties are determined as the difference between the two multi-jet estimates described in section5.3. The normalisation uncertainty is determined to be 20%. The shape uncertainty is evaluated by two different linear combinations of the two multi-jet estimates. In the electron channel the normali-sation uncertainty is determined from the variation of the background estimate when the efficiencies for real and fake leptons are varied within their uncertainties. The uncertainty of the efficiency for real leptons is estimated by varying the fit parameters in the tag-and-probe method using Z boson events. The uncertainty on the efficiency for fake leptons is estimated by varying theEmiss
T cut between 15 GeV and 25 GeV and by relaxing theb-tag requirement to at least one b-tag. From these variations a normalisation uncertainty of 50% is assigned.
For the background contribution due toW+jets, the overall uncertainty from the charge asymmetry normalisation method (see section5.3) and the uncertainty on the flavour frac-tions are separately determined. A shape uncertainty is estimated by varying model pa-rameters in theW+jetsalpgensimulation. The total background uncertainty is evaluated by adding in quadrature each of the different background uncertainty contributions.
6.3 Experimental uncertainties
JHEP06(2015)100
The jet energy scale (JES) systematic uncertainty [77] is a major contributor to the overall systematic uncertainty in all distributions affected by the signal efficiency and bin migration. In the central region of the detector (|η| < 1.7) it varies from 2.5% to 8% as a function of jet pT and η as estimated from in situ measurements of the detector response [77]. It incorporates uncertainties from the jet energy calibration, calorimeter re-sponse to jets, detector simulation, and the modelling of the fragmentation and underlying event, as well as other choices in the MC generation. Additional sources of the JES uncer-tainty are also estimated. The main contributions are the intercalibration of the forward region detector response from the central regions of the detector, effects from the correction of additional pp interactions, jet flavour composition, b-jet JES calibration and the pres-ence of close-by jets. Uncertainties due to different detector-simulation configurations used in the analysis and in the calibration are added as one additional uncertainty parameter (“relative non-closure”). The JES uncertainty is evaluated using a total of 21 individ-ual components to model the uncertainty correlations as a function of the jet transverse momentum and the rapidity.
The jet energy resolution (JER) has been found to be well modelled in simulation. In situ methods are used to measure the resolution, which MC simulation describes within 10% for jets in thepT range 30–500 GeV [86]. The jet reconstruction efficiency is also well modelled by the simulation and the uncertainty is evaluated by randomly removing simu-lated jets within the 1σ uncertainty of jet reconstruction efficiency measured in data [77].
The uncertainties introduced by the JVF requirement used to suppress pile-up jets are estimated using events with a leptonicZ boson decay and an associated high-pT jet. The efficiency to select jets from the hard-scatter and the contamination by jets produced by pile-up interactions are measured in appropriate control regions and the agreement between data and MC simulation is evaluated.
The uncertainties related to the MC modelling of the lepton trigger, reconstruction and identification efficiency are evaluated by comparing high-purity events featuring leptons in data and simulation. These include Z → ee, Z → µµ and W → eν events in data and simulation, while tt¯events are also included in the simulation studies [73]. Similar studies are also performed for the lepton energy and momentum scales and resolutions. Since the two channels require different lepton flavours, the electron uncertainty affects only the electron channel, and similarly for the muon channel. The electron uncertainty is approximately double the muon uncertainty. In both cases the uncertainty is small with little variation between bins. The uncertainty on Emiss
T is determined by propagating all the uncertainties associated with the energy scales and resolutions for leptons and jets to the calculation of Emiss
JHEP06(2015)100
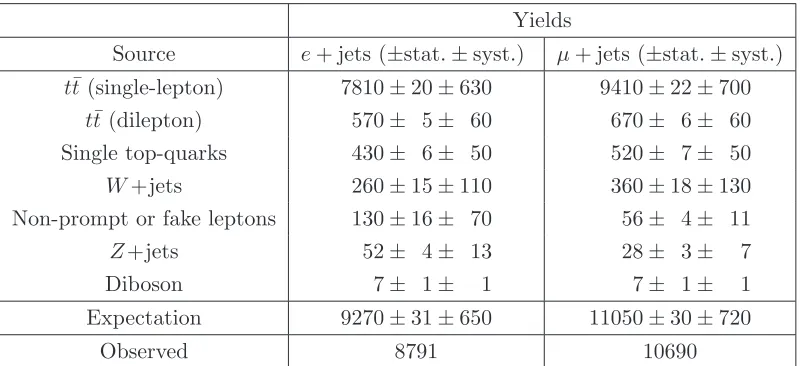
Yields
Source e+ jets (±stat.±syst.) µ+ jets (±stat.±syst.)
tt¯(single-lepton) 7810±20±630 9410±22±700
tt¯(dilepton) 570± 5± 60 670± 6± 60
Single top-quarks 430± 6± 50 520± 7± 50
W+jets 260±15±110 360±18±130
Non-prompt or fake leptons 130±16± 70 56± 4± 11
Z+jets 52± 4± 13 28± 3± 7
Diboson 7± 1± 1 7± 1± 1
Expectation 9270±31±650 11050±30±720
[image:19.595.97.499.94.277.2]Observed 8791 10690
Table 1. The number of selected events from data, MC simulation and data-driven background estimates, in the electron and muon channels. The yields of MC samples that are not constrained by fits to data shown are normalised to an integrated luminosity of 4.6 fb−1. The uncertainties specific
to thett¯MC sample (ISR, generator, fragmentation, etc.) are not included in thet¯t(single-lepton and dilepton) uncertainties given in this table.
factors used to correct the differences between simulation and data in each of the categories. The uncertainties in the simulation modelling of the b-tagging performance are assessed by studying b-jets in dileptonic t¯t events [88]. The b-tagging efficiency is another major contributor to the overall systematic uncertainty and tends to slightly increase withpT. The c-quark efficiency uncertainty is approximately constant at≈2% while the misidentification uncertainty contributes at the percent level for all distributions.
The last experimental uncertainty evaluated is due to the measurement of the inte-grated luminosity. This is dominated by the accuracy of the beam separation scans and has an associated uncertainty of 1.8% [72] that is assigned to each bin of the distributions and the MC background predictions. With the exception of the MC and data statistics and the background modelling all uncertainty components are correlated across the bins and for all observables.
7 Reconstructed yields and distributions
A summary of the number of selected data events, background contributions and total predictions is given in table1. Dileptont¯tevents constitute the largest background followed by single top-quark production. TheW+jets and non-prompt or fake lepton backgrounds are smaller in comparison.
JHEP06(2015)100
(a) (b)
[image:20.595.86.508.90.570.2](c) (d)
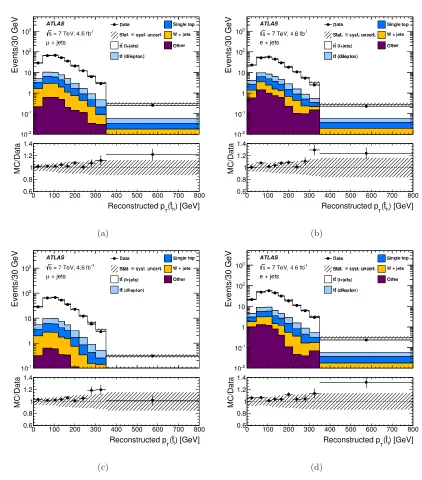
Figure 3. The reconstructed pseudo-top-quarkpTin comparison to the MC signal and data-driven
background models. ThepT(ˆth) distributions: (a) the muon channel and (b) the electron channel.
ThepT(ˆtl) distributions: (c) the muon channel and (d) the electron channel. Signal and background
processes are shown in different colours, with “Other” including the small backgrounds from diboson and Z+jets production, and non-prompt or fake lepton signatures from multi-jet processes. The data are compared with predictions from background models and expected yields from simulated
JHEP06(2015)100
(a) (b)
[image:21.595.93.507.117.575.2](c) (d)
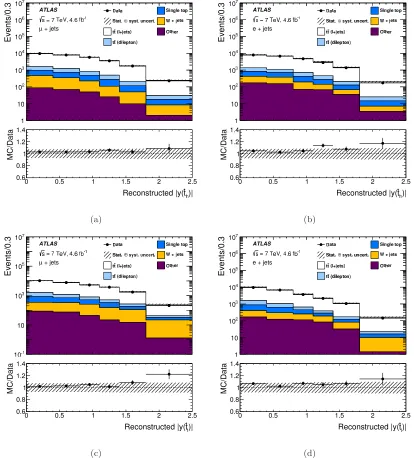
Figure 4. The reconstructed pseudo-top-quark rapidity in comparison to the MC signal and data-driven background models. The|y(ˆth)|distributions: (a) the muon channel and (b) the
elec-tron channel. The |y(ˆtl)| distributions: (c) the muon channel and (d) the electron channel. The
JHEP06(2015)100
[image:22.595.100.505.86.315.2](a) (b)
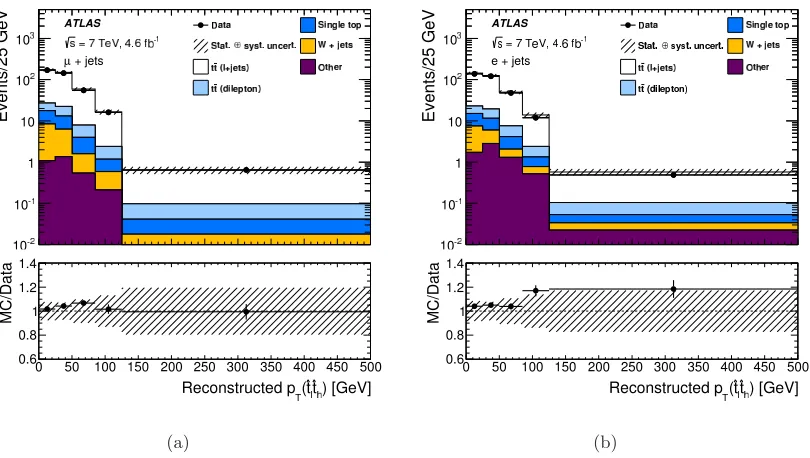
Figure 5. The reconstructedpTfor the system of pseudo-top-quark pairs ˆtltˆhin comparison to the
MC signal and data-driven background models. The pT(ˆtlˆth) distributions: (a) the muon channel
and (b) the electron channel. Signal and background processes are shown in different colours, with “Other” including small backgrounds from diboson andZ+jets production, as well as non-prompt and fake leptons from multi-jet processes. Thepowheg+pythiaMC generator with the Perugia 2011C tune is used for the t¯t signal estimate. The shaded band shows the total systematic and statistical uncertainties on the signal plus background expectation.
In each region, the expected number of events agrees with the number observed in the data. The data are shown using bin sizes that correspond to one standard deviation resolution in the hadronic variables, except in the tails of the distributions where the bin width is increased to reduce the statistical fluctuations.
8 Corrections for detector effects and channel combinations
Each of the reconstructed pseudo-top-quark observable distributions is corrected for the effects of detector efficiencies and resolution. All distributions are presented within the kinematic range defined in section2, which is close to the acceptance of the reconstructed object and event selections, such that model dependencies from regions of phase space outside of the acceptance are minimised. Section 8.1 describes the correction procedure, section 8.2describes the propagation of the statistical and systematic uncertainties to the final distributions, and section8.3describes the combination of the results obtained in the electron and muon channels.
8.1 Correction procedure
The reconstructed pseudo-top-quark observable distributions are corrected as follows:
Nparti =fpart!recoi ·X j
JHEP06(2015)100
[image:23.595.97.505.97.330.2](a) (b)
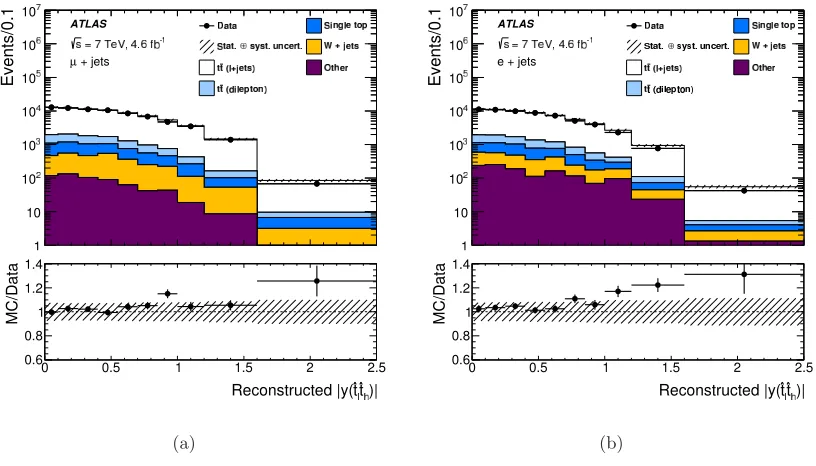
Figure 6. The reconstructed rapidity for the pseudo-top-quark system ˆtltˆh in comparison to the
MC signal and data-driven background models. The y(ˆtlˆth) distributions: (a) the muon channel
and (b) the electron channel. Signal and background processes are shown in different colours, with “Other” including small backgrounds from diboson andZ+jets production, as well as non-prompt and fake leptons from multi-jet processes. Thepowheg+pythiaMC generator with the Perugia 2011C tune is used for the t¯t signal estimate. The shaded band shows the total systematic and statistical uncertainties on the signal plus background expectation.
where Nrecoj (Nparti ) is the number of reconstructed (fully corrected) events in a given reconstructed observable binj(particle-level observable bini), andNbgndj is the number of background events estimated as explained in section 5.3. The correction factorsfi
part!reco, fmisassignj andfreco!partj are discussed below.
Detector resolution effects on the reconstructed pseudo-top-quark observables are cor-rected with an iterative Bayesian unfolding procedure [89] using a response matrixMrecopart
that describes the migration between the detector-level observable bin j and particle-level observable bin i. To ensure a one-to-one relationship between the particle-level and the detector-level observables, the response matrix is constructed from events where for each detector-level pseudo-top-quark object a particle-level pseudo-top-quark object can be matched. The matching is based on the angular differences between the components of the pseudo-top-quarks. Detector-level and particle-level jets (jet/jet′) and leptons (ℓ/ℓ′) are considered matched if they satisfy ∆R(jet,jet′)<0.35 and ∆R(ℓ, ℓ′)<0.02. This matching definition is found to be fully efficient for leptons and close to 100% efficient for jets.
JHEP06(2015)100
[image:24.595.96.511.86.318.2](a) (b)
Figure 7. The reconstructed m(ˆtltˆh) for the pseudo-top-quark system ˆtlˆth in the muon (a) and
electron (b) channel. The distributions are shown in comparison to the MC signal and data-driven background models. Signal and background processes are shown in different colours, with “Other” including small backgrounds from diboson andZ+jets production, as well as non-prompt and fake leptons from multi-jet processes. The powheg+pythia MC generator with the Perugia 2011C tune is used for thet¯tsignal estimate. The shaded band shows the total systematic and statistical uncertainties on the signal plus background expectation.
provide convergence and avoid higher statistical uncertainties in the tails of the corrected distributions.
Events that have no matched detector-level and particle-level pair are taken into ac-count by three factors that correct the detector-level observable distribution to the particle-level observable distribution:
• The correction for events that pass the detector-level event selection but fail the particle-level event selection (freco!part);
• The correction factor for events with a reconstructed pseudo-top-quark that has no counterpart at the particle level (fmisassign);
• The correction for events that fulfil the particle-level event selection requirements but fail the reconstruction-level event selection (fpart!reco).
These correction factors are also derived from MC simulation. The correction factors
freco!part and fmisassign are in the range between 0.65–0.70 for all observables. The cor-rection factor fpart!reco is primarily dominated by the detector efficiency, in particular by the b-tagging efficiency, and is in the range 5.5–8.0. They are found to be similar for the
JHEP06(2015)100
The same unfolding procedure is applied to each of the distributionspT(ˆt),y(ˆt),y(ˆtltˆh), pT(ˆtlˆth), and m(ˆtltˆh).
The number of background events Nbgnd and the correction factors freco!part and
fmisassign are functions of the detector-level pseudo-top-quark observables. The
correc-tion factor fpart!reco is a function of the particle-level pseudo-top-quark observable xipart. To evaluate the cross-section in bin i, it is also necessary to take into account both the luminosity and bin width.
8.2 Propagation of uncertainties
With the exception of the non-t¯tbackgrounds, each of the correction factors in eq. (8.1) is calculated usingpowheg+pythiaevents that are passed through the detector simulation. The effect of the statistical uncertainty on Mrecopart is estimated by smearing the number of events in each element of the matrix, using a Poisson probability density function. The sta-tistical uncertainty on the correction factors (freco!part,fmisassign and fpart!reco) is evaluated by smearing the value in each bin using a Gaussian distribution following the statistical uncertainty in the bin. The correction factors and the response matrix are smeared simul-taneously by performing 1000 pseudo-experiments and repeating the unfolding procedure for each pseudo-experiment. The statistical uncertainty for each measurement point is taken from the root-mean-square (1σ) of the spread of the unfolded distributions over the various pseudo-experiments.
The statistical uncertainty on the reconstructed distributions in data is propagated to the final distributions by performing 1000 pseudo-experiments, following a Poisson dis-tribution defined by the number of events in each bin j. Similar to the MC statistical uncertainty, each bin of xjreco is independently fluctuated.
The experimental systematic uncertainty on the reconstructed distributions is evalu-ated by changing the values of the physics objects by their associevalu-ated uncertainties. The total uncertainty on the number of reconstructed background events (Nbgnd) is evaluated by summing in quadrature each of the background uncertainties discussed in section6.
The systematic uncertainty on the unfolded spectra due to the background is evalu-ated by performing 1000 pseudo-experiments, following a normal distribution with a width matching the total uncertainty band. The root-mean-square of the distribution of un-folded spectra of the pseudo-experiments is taken as the uncertainty on the background. Due to the small number of background events and their generally small uncertainties, the background uncertainties are propagated in an uncorrelated manner. This choice reduces the impact of statistical fluctuations on the background uncertainty estimates for the final distributions.
JHEP06(2015)100
point. For each t¯t modelling systematic uncertainty, a pair of particle-level and detector-level spectra is generated. One thousand pseudo-experiments are used to fluctuate the reconstructed input spectrum within its statistical uncertainty. The pseudo-experiments are used to evaluate the statistical significance of the systematic variation in the output distribution. The relative bias is calculated for each pseudo-experiment.
The ISR/FSR systematic uncertainty is evaluated from the relative bias between the
alpgen+pythia central and shifted ISR/FSR samples. The uncertainty on the matrix-element calculation and matching scheme (the generator uncertainty) is estimated from the relative bias ofmc@nlo+herwigwith respect to thealpgen+herwigt¯tsample.
Each of thet¯tuncertainties is propagated individually and are then symmetrised before being combined, taking the larger of the upward or downward variation.
8.3 Combination of lepton channels
The electron and muon channel measurements of each pseudo-top-quark distribution are combined by using the Best Linear Unbiased Estimate (BLUE) method [90, 91]. The BLUE method determines the coefficients (weights) to be used in a linear combination of the input measurements by minimising the total uncertainty of the combined result. All uncertainties are assumed to be distributed according to a Gaussian probability density function. The algorithm takes both the statistical and systematic uncertainties and their correlations into account. The BLUE combination was cross-checked against an average performed using the algorithm discussed in ref. [92]. The result of the two methods are found to be consistent. The MC statistical uncertainties on the correction factors for the two samples are assumed to be uncorrelated. The uncertainties related to the electron and muon efficiencies are also treated uncorrelated. All other systematic uncertainties are treated as fully correlated. In particular, the total background systematic uncertainty is assumed to be completely correlated between the electron and muon channel. The uncertainties of the combined measurement are dependent on the observables but tend to closely follow the muon channel uncertainties.
9 Results
The measurements of the differentialtt¯cross-section corrected for detector effects are pre-sented as a function of the pT(ˆt) and y(ˆt) for the hadronic or leptonic reconstruction of the pseudo-top-quarks, as well as the variablesy(ˆtlˆth),pT(ˆtlˆth) andm(ˆtlˆth) of the pseudo-top-quark-pair system; ˆt refers to both the hadronic and leptonic pseudo-top-quark. The fiducial cross-section measurements are presented within the kinematic range defined in section 2, and are evaluated as described in section8.
The measurements can be directly compared to Monte Carlo simulations that are generated with top quarks with a mass of 172.5 GeV. The top quark mass dependence of the cross-sections was derived with Monte Carlo samples generated with top quark masses from 165 to 178 GeV. The cross-sections depend linearily on the top mass. The slope6 is
6The top mass (m
JHEP06(2015)100
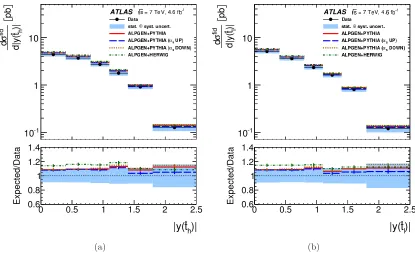
[image:27.595.87.504.87.343.2](a) (b)
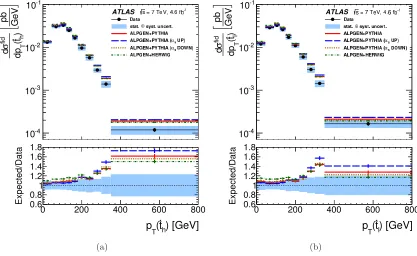
Figure 8. Differentialt¯tcross-section after channel combination as a function of (a) the hadronic pseudo-top-quarkpT(ˆth) and (b) the leptonic pseudo-top-quarkpT(ˆtl). The data points are shown
with a blue band which represents the total uncertainty (statistical and systematic). The model predictions from several LO multi-leg MC generators described in the text are superimposed: the alpgen+herwigand thealpgen+pythiasamples. For thealpgen+pythiasample, variations in the renormalisation scale by factors of 0.5 and 2.0 are also shown.
between −0.1 and −0.3 %/GeV for y(ˆt), y(ˆtlˆth) and pT(ˆtlˆth). For m(ˆtlˆth) (pT(ˆt)) it rises from −0.6 (−0.3) %/GeV for low values to 0.4 (0.4) %/GeV at high values.
The tt¯MC generators are of two types (for a detailed discussion see section 4): NLO matrix elements are used to describe the hard scattering pp → t¯t, and LO multi-leg MC generators model t¯t processes with up to five additional quark or gluon emissions. All t¯t
MC samples are normalised to the NNLO+NNLL QCD inclusive cross-section.
Figures8,9 and 10show the corrected data for the differential variables noted above. Superimposed on the data are the expectations of the LO multi-leg MC generatoralpgen
(see section4):
• alpgen interfaced withpythia(alpgen+pythia),
• alpgen interfaced withherwig(alpgen+herwig),
• alpgeninterfaced withpythiabut with the renormalisation scale varied by a factor of 2 (αS Up) and a factor of 0.5 (αS Down).
Both the alpgen+herwig and alpgen+pythia models indicate yields within the acceptance that are higher than the observed data. This is evident in figures 9 and 10(b)
JHEP06(2015)100
[image:28.595.89.504.87.342.2](a) (b)
Figure 9. Differentialt¯tcross-section after channel combination as a function of (a) the hadronic pseudo-top-quark rapidity y(ˆth) and (b) the leptonic pseudo-top-quark rapidity y(ˆtl). The data
points are shown with a blue band which represents the total uncertainty (statistical and system-atic). The model predictions from several LO multi-leg MC generators described in the text are superimposed: thealpgen+herwigand thealpgen+pythiasamples. For thealpgen+pythia sample, variations in the renormalisation scale by factors of 0.5 and 2.0 are also shown.
indicate a pT(ˆt) spectrum that is harder than the ones observed in data, a possible con-sequence of using the cteq6l1 PDF set. For the alpgen+pythia sample, the effect of increased or decreased radiation is illustrated with the renormalisation scale changed by a factor of 2.0 (αSUp) and by a factor of 0.5 (αSDown) applied consistently to bothalpgen and pythiaas noted in section4. The increased radiation gives fewer events at lowpT(ˆt) and more at high pT(ˆt). This is at the level of 5–10%. For the leptonic pT(ˆt) this effect is slightly larger as shown in figure 8(b). ThepT(ˆtlˆth) distribution, shown in figure 10(a), is very sensitive to additional radiation. When the renormalisation scale factor changes from 0.5 to 2.0, 15–20% more events are observed at lowpT(ˆtlˆth) and 20–30% fewer at high pT(ˆtlˆth). Increased radiation also leads to 5% fewer events at low m(ˆtltˆh) and 10% more events at high m(ˆtltˆh) as shown in figure 10(c). Nevertheless, the (αS Down) variation is not sufficient to restore agreement between the data and the MC simulation. The alp-gen+herwigsample follows the alpgen+pythiasample with the (αS Down) variation. Figures11,12 and 13compare the data with expectations of the NLO MC generators
powheg and mc@nlo. In particular, the following NLO variants are shown:
JHEP06(2015)100
(a) (b)
[image:29.595.98.510.91.610.2](c)
Figure 10. Differential t¯t cross-section after channel combination as a function of (a) the total leptonic and hadronic t¯t pseudo-top-quark variable pT(ˆtltˆh), (b) the rapidity y(ˆtlˆth) and (c) the
massm(ˆtltˆh). The data points are shown with a blue band which represents the total uncertainty
JHEP06(2015)100
[image:30.595.86.503.87.343.2](a) (b)
Figure 11. Differential t¯t cross-section after channel combination as a function of (a) the hadronic pseudo-top-quark pT(ˆth) and (b) the leptonic pseudo-top-quark pT(ˆtl). The data
points are shown with a blue band which represents the total uncertainty (statistical and sys-tematic). The model predictions from several NLO MC generators described in the text are superimposed: powheg(ct10)+pythia, powheg(herapdf)+pythia, powheg+herwig and mc@nlo+herwig.
• powheg-hvq v.4 generator where the ct10nlo PDF set is replaced with the
herapdf15nlo PDF set to assess the sensitivity of the distributions to changes in the gluon PDF (powheg(herapdf)+pythia).
• mc@nlogenerator with the ct10nlo PDF set interfaced withherwigand jimmy
with the AUET2 tune (mc@nlo+herwig).
The individual hadronic and leptonicy(ˆt) distributions in figure12are well described by each of the NLO MC models. Thepowheg(herapdf)+pythiasample is the one closest to predicting the data, whereas the other NLO models predict a more forward distribution. This is also true for the hadronic and leptonicpT(ˆt) distributions (see figure11) for which thepowheg(herapdf)+pythiasample lowers the cross section at highpT(ˆt) with respect to the nominal sample, which results in a better description of the data. For these variables
mc@nlo also gives a good description. The pT(ˆtlˆth) distribution, shown in figure 13(a), highlights the different hard-gluon emission models. The mc@nlo prediction is lower than the data at highpT(ˆtlˆth), as expected due to the softer fifth-jetpT frommc@nloin comparison to the other generators [31].
JHEP06(2015)100
[image:31.595.89.505.87.342.2](a) (b)
Figure 12. Differentialt¯tcross-section after channel combination as a function of (a) the hadronic pseudo-top-quark rapidity y(ˆth) and (b) the leptonic pseudo-top-quark rapidity y(ˆtl). The data
points are shown with a blue band which represents the total uncertainty (statistical and sys-tematic). The model predictions from several NLO MC generators described in the text are superimposed: powheg(ct10)+pythia, powheg(herapdf)+pythia, powheg+herwig and mc@nlo+herwig.
pythiasample agrees well with the high-massm(ˆtltˆh) tail, while the other samples overes-timate the tail. This is consistent with the softer gluon component in theherapdf15nlo
PDF set compared to the one in the ct10nlo PDF set. The y(ˆtltˆh) distribution is rea-sonably predicted for all models in the low y(ˆtlˆth) region, but only thepowheg+pythia model with theherapdf15nloPDF set provides a good overall description. ThepT(ˆtlˆth) spectrum is sensitive to the extra radiation produced in the parton collision process. All models agree with the data within the systematic uncertainties. If these uncertainties can be reduced, this suggests that the pT(ˆtltˆh) distribution can be used to constrain phe-nomenological radiation parameters in future MC tunes.
10 Conclusions
Differential fiducial tt¯cross-section measurements are presented for kinematic variables of the pseudo-top-quark (ˆt), defined at the particle level by the decay products of the W
boson and b-quark occurring in top-quark decays.
JHEP06(2015)100
(a) (b)
[image:32.595.100.505.100.617.2](c)
Figure 13. Differential t¯t cross-section after channel combination as a function of (a) the to-tal leptonic and hadronic t¯t pseudo-top-quark variables pT(ˆtltˆh), (b) the rapidity y(ˆtlˆth) and (c)
the mass m(ˆtlˆth). The data points are shown with a blue band which represents the total