Published Online July 2012 in SciRes (http://www.SciRP.org/journal/sm) http://dx.doi.org/10.4236/sm.2012.23034
Effectiveness and Efficiency of Educational Measures:
Evaluation Practices, Indicators and Rhetoric
Federica Cornali
University of Turin, Turin, Italy Email: [email protected]
Received March 2nd, 2012; revised April 12th, 2012; accepted May 15th, 2012
In recent years, evaluating the performance of educational organizations has sparked increasing interest and debate. Many expectations ride on the smooth operation of school systems. It is widely believed that countries’ social and economic well-being will depend to an ever greater extent on the quality of their citi- zens’ education: the emergence of the so-called “knowledge society”, the transformation of information and the media, and increasing specialization on the part of organizations all call for high skill profiles and levels of knowledge. Today’s education systems are required to be both effective and efficient, or in other words, to reach the goals set for them while making the best use of available resources. This paper, by presenting and discussing a case study, will analyze several dimensions of schools’ effectiveness and effi- ciency, highlighting the importance of selecting evaluation procedures that can provide representations that reflect the actual situation to the greatest possible extent.
Keywords: Education Policies; Evaluation; Effectiveness; Efficiency
Introduction
For some time now, several of the major national and inter- national organizations that support education and economic development (UNESCO and the OECD, for example) have published an extensive set of indicators that describe the main characteristics of how education systems work in a number of countries: student flows and levels of educational attainment, schools and their environment and the costs of education. In- formation about educational institutions can be provided by a variety of sources; it can be intended for administrative use or made public; it can concern different levels: the system, the school, the class. In all cases, however, its aims are the same: to increase the knowledge and understanding of educational insti- tutions and support evaluation processes. Evaluating education policies means expressing a judgment based on a controlled process of investigation regarding the relevance, the advisabil- ity and effects of the action that has been taken. The CIPP (Context, Input, Process, Product) model proposed by Stuffle- beam (1968) over forty years ago provides a solid analytical basis for evaluating education policies. By considering the economic and socio-cultural setting in which the school oper- ates and to which it must adapt its educational provision (Con- text), the human, technological and financial resources that are available, as well as the applicable laws and regulations (Input), the activities (Process) and the results (Product), this model provides an accurate description of school systems. The success of the CIPP model firmly established evaluation practices based on massive collections of data. In two successive conferences (Washington D.C. in 1987, and Poitiers in 1988), the US De- partment of Education and the OECD Secretariat emphasized the need for high quality indicators for all significant aspects of education systems (OECD 1994). To arrive at a useful repre- sentation of education systems, it is first of all essential that these indicators represent all of the dimensions involved se-
mantically. Second, they must be logically and empirically related, in order to provide a consistent data set.
It cannot be ignored that limiting evaluation to examining and comparing the main descriptors of education systems— what Pawson and Tilley (1997) call “quantitative meta-analysis”— creates distortions, chiefly because of the failure to identify causal links, the excessive simplification of outcomes (di- chotomized as either success or failure), and the insufficient consideration given to differences in context. Indicator-based evaluation, though requiring analysis and further investiga-tion—to identify the mechanisms activated together with vari-ous application situations, for example, as well as the results achieved on the whole—now ranks among the most highly accredited analysis procedures and has thus been adopted by the major national and international educational research agen- cies. The usefulness of indicators is proportionate to their abil- ity to describe the central and lasting characteristics of school systems and to furnish information about real or potential prob- lems, with a view to formulating targeted policies or measures. What dimensions should be examined, and what parameters should be compared in order to arrive at reliable estimates of the performance of education systems? The following para- graphs will focus on “effectiveness” and “efficiency”, two as- pects at the center of the educational debate. Our aim is to an- swer the following questions: to what specific conceptual areas do the two terms refer? What types of public discourse revolve around evaluations of effectiveness and efficiency? Accord- ingly, we will present, examine and discuss a measure, viz., the introduction of the single class teacher in Italian elementary schools, which was intended by the legislator as a means of achieving both of these goals.
Administering Resources, Achieving Results
efficiency. The first concerns the school system’s ability to achieve its institutional goals: teaching general and abstract knowledge—as is needed to master languages, symbols, im- ages and concepts—and transmitting cognitive methods and thought patterns. The second factor concerns the ability to achieve assigned aims by making the best use of all allocated resources. Effectiveness indicators refer both to the outputs of education systems in terms of observable products—for in- stance, the number of graduates in a given school year—and to the outcomes achieved, i.e., the degree to which goals are reached, as demonstrated, for example, by students’ scores on tests of their skills and knowledge in curriculum subjects. Effi- ciency indicators, on the other hand, are economic in nature: public expenditure, private expenditure, total expenditure, ex- penditure per student, cumulative unit expenditure by level of education, current and capital expenditure, and public spending on education in relation to GDP and to total public spending.
There is no clear-cut dichotomy between effectiveness and efficiency: there are infinite gradations in achieving education’s goals, just as there are infinite gradations in the economical management of capital, be it monetary or otherwise. Moreover, both properties have an internal dimension and an external one. Internal effectiveness and efficiency can be estimated within a given setting. In education, for example, they can concern the impact of a particular teaching method on students in the same institution or program, or the specific use of certain resources in the same educational sector. By contrast, external effectiveness or efficiency are extra-sectorial, as they extend comparison beyond the setting in question. In the case of education, they can relate to the impact of a certain type of training in several sectors of the economy, or the outcomes of school tracks in terms of individual costs and benefits.
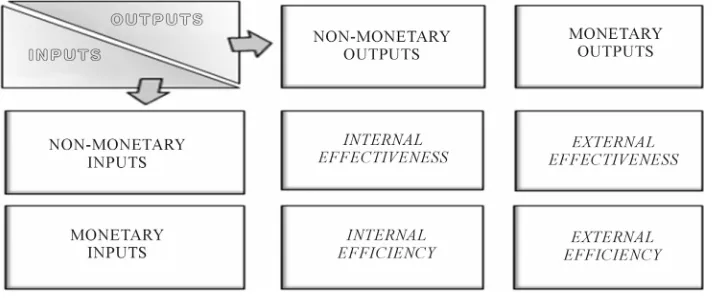
Lockheed and Hanushek (1994) constructed a typology of educational function stemming from the different relationships arising between the stimuli to the school system—the inputs— and its observable products, the outputs (see below, Figure 1).
In planning education policies, effectiveness and efficiency are usually pursued together. Though they refer to different types of outcome, the two goals are always seen as related. While all efficient school organizations are also effective, given that effectiveness is an essential prerequisite for efficiency, the converse is fairly frequently heard: not all effective school sys- tems are also efficient. Every inefficient school system (or educational institution) can be inefficient in its own way. Prof- itable use of resources, in fact, depends on a number of ele-
ments; broadly speaking, however, there are two aspects that are most important. The first, the so-called “allocative effi- ciency”, regards how resources are earmarked, whether they be human resources (teachers, technical-administrative personnel and aids) or tangible resources such as funding or technological facilities. The second, called “technical efficiency”, regards the optimal use of the resources themselves.
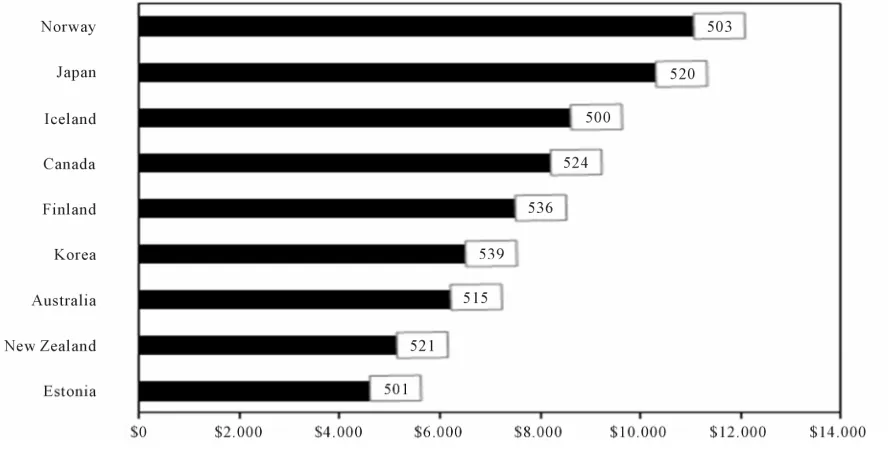
[image:2.595.122.478.569.718.2]The taxonomy proposed by Lockheed and Hanushek is of considerable interest, as it makes it possible to focus on the different types of resource (monetary and non-monetary) and the different levels (internal and external) involved in analyzing educational effectiveness and efficiency. The problem, however, is that there are no reliable estimates of the so-called intangible assets. In general, “assets” are defined as any goods that can generate future benefits, while “intangible” denotes the particu- lar category of assets that are not physical in nature. In the world of education, intangible assets make up most of the school’s total value, as they include the skills of teachers and staff, new ideas, good teaching practices, contacts with the local area and relationships with parents, and much more. Together, as Lev (2001) maintains, intangible assets are an extremely important capital—which he calls “organizational capital”—on which the overall success of an organization depends. While many studies have examined the role and weight of intangible assets in industry and industrial services, few have addressed the part they play in public general-interest services. Estimates of efficiency in such services thus concentrate primarily on monetary assets. In a time of tight budgets and beleaguered public finances, cutting expenses is thus a priority goal, par- ticularly in view of the fact that spending less does not neces- sarily mean having to accept lower performance. In education, a lengthy series of studies have ratified the findings published by Coleman and colleagues (1966) nearly fifty years ago: stu- dents’ levels of attainment are only weakly associated with the amount of resources provided to schools. This was recently confirmed by the OECD’s Programme for International Student Assessment (PISA), a survey that subjected a sample of 15-year old students from over forty countries to tests of their reading, mathematical and scientific literacy. When we compare spend- ing per student in compulsory education (given that young peo- ple in this cohort are still at compulsory school) in several of the countries that achieved the best reading scores in the 2009 survey, we find an enormous variability. Good performance (scores above 500) correspond to a wide range of annual per-student outlays, both well below and well above the OECD
Figure 2.
Expenditure per student during compulsory schooling in US dollars (2007) and students’ reading scores (PISA 2009).Source: OECD 2010.
average of 8070 purchasing power parity-adjusted US dollars (see Figure 2).
The OECD statistics also show that many countries achieve rather poor performance despite massive spending in education. These countries include Luxembourg, with the highest yearly expenditure (16,632 USD) and whose young people score only 472 on average, as well as the Slovak Republic (11,403 USD in spending and an average score of 477), Austria (9801 USD in spending and an average score of 470) and Italy (8661 USD in spending and an average score of 486).
Can aggregating analytical data from a variety of sources— such as the collections of input, process, output and product indicators—tell us something about how well school systems operate? Simply put, yes. However, before taking students’ scores in standardized tests—or other types of performance indicators—as expression of the success of education systems, it is advisable to check the relationships that can link school outcomes to presumable sources of variation. As suggested by Johnes (2004), it is also useful to emphasize that school sys- tems:
Operate with a large variety of internal structures,
Operate with different external contexts and highly varied local systems,
Produce multiple outputs (joint production) from a broad range of inputs, and
Are subject to different strategies, depending on the level of governance in question (internal, regional, national, Euro- pean, international).
Effective and Efficient Education? The Case of
the Single Class Teacher
The Italian school system has recently been swept by a series of reforms with the two-fold aim of improving its effectiveness and efficiency. Recent statistical surveys and investigations indicate that Italy’s schools turn out a lower percentage of graduates than those of other developed countries, providing them with an average quality of education that falls far short of
excellent, despite the fact that funding is by no means inade- quate (see the preceding paragraph). The reforms have affected all levels of education (primary, lower and upper secondary, and university) and were introduced, with varying degrees of acceptance and approval on the part of the public and educators, with no preliminary trial period. One of the innovations that proved most controversial with the general public and special- ists in the field was the change in how teaching is organized in primary school, which in Italy lasts five years and is generally attended by children from six to eleven years of age. While the younger students were previously grouped into classes with three teachers—each dealing with a different area of learning: language and other forms of expression, math and science, and the humanities—who divided their time evenly between two different classes in the so-called “modular organization”, the entry into force of Law 133 of August 6, 2008 introduced the “single class teacher”. As Article 4 of this law states, “Pursuant to the objectives for rationalization […] primary school institu- tions shall set up classes entrusted to a single teacher and func- tioning according to a schedule of twenty-four hours per week”.
This change put an end to the former practice whereby sev- eral teachers were present in the same class in any given period, and assigned a major role to the “single class teacher”. This teacher is responsible for the entire core curriculum, and coor- dinates the work of the specialist teachers who deal with sub- jects such as foreign languages, religion, music, physical edu- cation or other disciplines that schools are now empowered to add independently to their curricula.
better and thus provide personalized teaching. The reform’s opponents, on the other hand, stress that having different teach- ers and being able to work with them in small groups enriches the child’s learning experience. While these arguments center on educational and teaching considerations, the legislators who chose to return to the single class teacher1 focused more on the system’s efficiency. Thus, the “Draft Policy of the Ministry of Education, Universities and Research, with the consensus of the Ministry of the Economy and Finance” of September 23, 2008 states that: “the intention is to combine the quantitative benefits of improving class structure and reducing teaching workload with those of higher quality school services, effective sizing of the system, and a more productive employment of teachers”. The foreword to the “Draft Policy” notes that the student/ teacher ratio in Italy is lower than the OECD average, but this does not translate into high levels of attainment or even in the spread of educational credentials. It thus calls for measures for reducing waste and the underutilization of facilities and re- sources. In particular, as regard the use of teachers’ time, it is urged that steps be taken to “increase the student/teacher ratio by one point”. There can be no doubt that the introduction of primary school classes with a single teacher whose classroom time totals twenty-four hours per week (two more than in the previous organizational model) is a move in this direction. The legislator does not appear to have been inspired entirely by motives of economy, as the “Draft Policy” presents the new teaching and organizational model as the most appropriate for learning purposes, asserting that “in the period of life between six and ten years of age, there is a need for a single reference figure with whom the student can have a continual and direct relationship”.
The reform of primary school teaching thus had two goals: to raise the student/teacher ratio (improving efficiency) and in- creasing students’ knowledge and skills (improving effective- ness). Whether the first goal was achieved can be readily de- termined, and the Ministry of Education was able to announce the number of teacher cuts2 that would result from the reform at the outset. By contrast, monitoring the second goal is much less straightforward. The measure, whose declared aim is to ensure “an educational and organizational model which is better able to raise learning outcomes […] and which can be a factor in strengthening the educational relationship between teacher and student, simplifying and making the most of the relationship between family and school” is unclear as to the connection between the stated ends and the means chosen to achieve them. Nor is anything said regarding how and when results will be gauged.
Educational outcomes are influenced by many variables, situated at multiple levels and interacting with each other. The results of any innovation introduced will differ according the student’s social class, his or her personal expectations and/or those of the family, teacher motivation, the type of educational orientation, and many other factors. Nevertheless, comparing student performance before and after the reform was introduced can help shed light on whether the expected goal was achieved.
For a number of years, INVALSI, the Italian national insti- tute for educational evaluation, has administered standardized tests of the knowledge and skills in mathematics and Italian acquired by students in a number of grades of compulsory school, bearing in mind the learning outcomes established for the two subjects in question. A variety of standardized tests are used—which may involve either multiple-choice or open- ended response formats (e.g., essays and performance tasks)— and are devised, administered, graded and reported in such a way as to avoid partial or ambiguous interpretations of the results.
The national evaluation system plays a key role in gauging the effects of education policies. The INVALSI tests provide a historical series of student attainment data that makes it possi- ble to compare changes in the performance over the long term and after the large scale introduction of organizational and/or teaching innovations.
Table 1 compares the attainment of second grade students who attended the first two years of elementary school with several teachers (2008-2009 school year) and that of students who had a single class teacher (2010-2011 school year).
At first sight, this rough ex post evaluation would appear to indicate that the introduction of the single class teacher was successful in terms of improving the system’s effectiveness.
Evaluating education, however, is a far more complex activ- ity. Its main purpose is not merely to determine what outcomes were achieved and whether they met expectations and goals. Strictly speaking, if the links connecting a situation with a prior action taken in order to bring about change are not identified, we cannot evaluate the outcomes of the action. A well con- ducted evaluation thus requires that a set of variables (for the context, input, process and product) be monitored to determine whether or not they are related to the quality of the outcome. For analysis to be complete, moreover, it must also include an ex ante stage carried out for forecasting purposes which can provide guidance in selecting between alternative measures, outlining scenarios based on an analysis of current trends, as well as an in itinere or ongoing evaluation during the imple- mentation phase to check whether the measure has led to unex- pected consequences.
In the case in question, analyzing the impact of introducing the single class teacher is particularly arduous.
The implementation provisions for the primary school teach- ing reform allows individual schools considerable leeway in organizing instruction time, which can also be based on par- ents’ preferences regarding afternoon sessions. Schools can thus offer 24, 27 and 30 hours of instruction time per week, with the further option of the so-called “full-time” 40-hour school week. It should be noted that two teachers are assigned to the full-time classes, though they are not present in the classroom at the same time. In the 2009-2010 school year—the only post-reform year for which data are available—the per-centage of students attending a 24-hour school week was tiny, at only 0.7%.
To say that all these conditions are related to improvements in student attainment is clearly something of a risk. And it is probably also misleading, given that the same period of time also saw an improvement (and a much more significant one) in the learning outcomes of fifth grade students who were unaf- fected by the introduction of the single class teacher3 (see be-
ow, Table 2). 1Italian elementary school classes were held by a single teacher until Law
148 of June 5, 1990 introduced the multiple-teacher approach after a trial period.
2For the three years following the reform, the Ministry estimated that 87,000 teaching jobs would be eliminated through attrition at all levels of education. For primary school teachers, it was announced that a total of around 28,000 positions would be cut in 2009-2012, including 9245 in the
l 3
Table 1.
Percentage of correct answers* by second grade students in mathematics and Italian achievement tests, 2008-2009 and 2010-2011 school years.
Italian Mathematics
Lower limit Mean Upper limit Lower limit Mean Upper limit
2008-2009 school year 64.5% 65.0% 65.5% 54.3% 54.9% 55.4%
2010-2011 school year 68.5% 69.2% 69.8% 59.8% 60.3% 60.9%
*The percentage score is calculated as the percentage ratio of the number of correctly answered questions to the total number of questions. The “lower limit” is the lower
[image:5.595.55.540.239.301.2]limit of the confidence interval containing the mean with a 95% probability. The “upper limit” is the upper limit of the confidence interval containing the mean with a 95% probability. Source: INVALSI 2009 and 2011.
Table 2.
Percentage of correct answers* by fifth grade students in mathematics and Italian achievement tests, 2008-2009 and 2010-2011 school years.
Italian Mathematics
Lower limit Mean Upper limit Lower limit Mean Upper limit
2008-2009 school year 61.8% 62.3% 62.7% 56.6% 57.1% 57.7%
2010-2011 school year 72.7% 73.1% 73.5% 68.1% 68.4% 68.7%
*The percentage score is calculated as the percentage ratio of the number of correctly answered questions to the total number of questions. The “lower limit” is the lower
limit of the confidence interval containing the mean with a 95% probability. The “upper limit” is the upper limit of the confidence interval containing the mean with a 95% probability. Source: INVALSI 2009 and 2011.
To what other factors, then, can the improvements be as- cribed?
A more analytical examination, taking the outcomes of indi- vidual schools or classes into consideration, could enable us to single out a certain number of factors of change in order to estimate their impact on student attainment.
There can be many such factors, and many different types. However, given that the improvement in attainment can be seen at both of the levels of education that were examined (primary school and lower secondary school) and in all of the areas of the country considered (Northeast, Northwest, Central Italy, South and the islands), there would appear to be good reason to look for a factor that influences the system as a whole.
One such factor is of particular importance: the gradual spread of a new approach to assessing students based on stan- dardized tests In Italy, unlike other countries with advanced school systems, structured tests were long considered as inap- propriate for verifying attainment, and other assessment meth- ods—chiefly centering on an oral presentation of the course content learned by the student—were preferred. Recently— thanks to the greater emphasis given to the work of the IN-VALSI evaluation institute and participation in international programs such as the Progress in Reading Literacy Study (PIRLS) and the Trends in International Mathematics and Sci-ence Study (TIMSS) conducted by the International Associa-tion for the EvaluaAssocia-tion of EducaAssocia-tional Achievement (IEA)—we have seen the rise of large-scale tests that, building on major advances in statistical techniques (Item Response Theory, for example), provide valid, reliable data on student achievement. The current trend, though doubtless positive inasmuch as a rigorous evaluation can stimulate improvement in course qual-ity, is not without its downsides. It is widely recognized, for instance, that schools attempt to ensure that good test scores are achieved by devoting increasing amounts of classroom time to exercises preparing students for this type of assessment, cutting into the space available for in-depth coursework or creative activities. In certain situations, teachers have even been seen to
provide their students with the correct answers during nation-wide tests, fearful that poor scores would reflect badly on their own work (INVALSI, 2011).
This aspect must not be forgotten, if we are to avoid attribut- ing excessive importance to students’ scores on standardized tests. As in the case we have just mentioned, information of this kind is not always of great assistance in formulating a judgment regarding the effectiveness or ineffectiveness of a given educa- tional innovation.
Because of its intrinsic difficulties, evaluating education poli- cies is thus often limited to a mere description (qualitative and/or quantitative) of the efforts made to improve the school system. At times, it is accompanied by a judgment regarding effectiveness or ineffectiveness, consisting in generic consid- erations about the “quality” of the service, where quality is for the most part seen as a question of compliance with organiza- tional standards or the level of satisfaction expressed by users. Ever more frequently, the need to follow the standards of the European Community is cited as the justification when an edu-cational measure is adopted. In the case of the introduction of the single class teacher, the measure’s proponents did not fail to point out that assigning a team of three teachers to each class was entirely unknown outside of Italy. If we look at the EU- RYDICE statistics (2011), in fact, we see that elsewhere, from Portugal to Lithuania, from Greece to Finland, and in England and France, primary school teaching is in the hands of a single teacher who is responsible for the students’ learning and, in certain cases, is assisted by specialist teachers for physical education, art, and so forth4. In some countries such as the United Kingdom and Malta, there is a single teacher for each grade, or in other words, the students change teacher every school year, partly in order to prevent any situations of conflict that may arise between teacher, student and family from spiral- ing out of control, but chiefly to enable teachers to improve
their teaching methods for children of different ages.
Reducing the number of teachers per student and bringing it closer to the European Union average is a legitimate objective, especially in view of the fact that having a large number of teachers is not matched by an increase in classroom time, which is often limited to the morning hours, particularly in Central and Southern Italy. Nevertheless, to assume that achieving this goal also leads to an improvement in teaching quality is perhaps over-bold. The many studies of teaching effectiveness demon- strate the importance of other teacher variables: training and continuing education, good pay and other economic incentives, career prospects: all factors that are entirely absent from the Italian school system.
Conclusion
The ultimate aims of an education policy are often unstated. At times, they are camouflaged: measures inspired by financial dictates (such as tight school budgets) or by political reasons (to accede to the demands of pressure groups or unions, for example) may be presented as a means of achieving goals that are important for teaching and educational quality, or as de- signed to rationalize the public administration. Just as fre- quently, such measures have a multitude of stated objectives, expressed in highly general terms. Consequently, any attempt to verify the results of these measures is an operation of little practical value. If the expected outcomes in terms of effective- ness and efficiency, both internal and external, are not clearly stated beforehand, evaluation will be nothing more than a trivial rhetorical exercise.
REFERENCES
Coleman, J., Campbell, E., Hobson, C., McPartland, J., Mood, A., & Weinfeld, F. (1966). Equality of educational opportunity. Washing-ton, DC: National Center for Educational Statistics.
Eurydice (2011). Key data series. URL (last checked 23 January 2012). http://eacea.ec.europa.eu/education/eurydice/key_data_en.php Goldhaber, D., & Anthony, E. (2004). Can teacher quality be
effec-tively assessed. Working Paper, Seattle: Center on Reinventing Pub-lic Education, University of Washington.
Invalsi (2009). Le rilevazioni degli apprendimenti A.S. 2008/2009.
URL (last checked 16 December 2011).
http://www.invalsi.it/download/Rapporto_SNV_08_09.pdf
Invalsi (2011). Le rilevazioni degli apprendimenti A.S. 2010/2011. URL (last checked 16 December 2011).
http://www.invalsi.it/snv1011/documenti/Rapporto_SNV%20201011 _e_Prova_nazionale_2011.pdf
Johnes, J. (2004). Efficiency measurement. In G. Johnes, & J. Johnes (Eds.), International handbook on the economics of education (pp. 613-742). Cheltenham: Edward Elgar Publishing Ltd.
Lev, B. (2001). Intangibles: Management, measurement and reporting. Washington D.C.: Brookings Institution Press.
Lockheed, M., & Hanushek, E. (1994). Concepts of educational effi-ciency and effectiveness. Human Resources Development and Op-erations Policy Working Papers.
OECD (2010). Education database. URL (last checked 18 March 2012). http://www.oecd.org/education/database
Pawson, R., & Tilley, N. (1997). Realistic evaluation. London: Sage. Stufflebeam, D. L. (1968). Evaluation as enlightenment for decision-