Evaluation of Shear Strength and Cone Penetration
Resistance Behavior of Tropical Silt Loam Soil under
Uni-Axial Compression
Seth I. Manuwa*, Omolola C. Olaiya
Department of Agricultural Engineering, School of Engineering and Engineering Technology, The Federal University of Technology, Akure, Nigeria.
Email: *[email protected]
Received March 29th, 2012; revised April 30th, 2012; accepted May 14th, 2012
ABSTRACT
Laboratory investigations were conducted to study strength characteristics of silt loam soil of Ilorin, Kwara State, Nige-ria, under uni-axial compression tests. The main objective of this study was to evaluate the effects of applied pressure and moisture content on strength indices such as bulk density, penetration resistance and shear strength of the soil and to develop relationships between the strength indices for predictive purposes necessary in soil management. The com-pression was carried out at different moisture contents determined according to the consistency limits of the soil. The applied pressure ranged from 75 to 600 kPa. Values of bulk density, penetration resistance and shear strength increased with increase in moisture content up to peak values after which the values decreased with further increase in moisture content. Regression models were used to describe the trends in the results for the soil. Results also showed that bulk density and soil strength normally regarded as indicators of soil quality are affected by moisture content and applied pressure and that these properties can be predicted using the models generated from the study.
Keywords: Loamy Soils; Applied Pressure; Bulk Density; Penetration Resistance; Moisture Content; Shear Strength; Nigeria
1. Introduction
Soil strength has been regarded as important characteris- tics that affect many aspects of agricultural soils, such as the performance of cultivation implements, root growth, least-limiting water range and trafficabilty [1]. They fur- ther reported that characterization of soil strength is us- ually made by measuring the response of a soil to a range of applied forces.
Soil compaction may be defined as the densification of unsaturated soil due to reduction in air volume without change in mass wetness [2]. Soil compaction occurs in unsaturated soils when subjected to mechanical forces [3]. While soil compaction is essential in many engineering works (especially civil engineering) it is undesirable in agricultural production to a large extent. Compaction re- duces the soil permeability to water, so that run off and erosion may occur and adequate recharge of ground wa- ter is prevented. Compaction reduces regeneration of the soil, so that metabolic activities of roots are impaired. Compaction increases the mechanical strength of the soil, so root growth is impeded. It is known that in agricultural
system, the risk of soil compaction increases with the growth of farm size, increased mechanization and equip- ment weight, and the drive for greater productivity. Soil compaction also has negative effects on the environment by increasing runoff and erosion thereby accelerating po- tential pollution of surface water by organic wastes and applied agrochemicals [4]. All of these effects may re- duce the quality and quantity of food and fiber grown on the soil. Therefore, the knowledge of soil compaction is increasingly important and desirable within agriculture and environmental protection.
The state of soil compactness is expressed in several ways: bulk density (expressed on a wet or dry basis), po- rosity and apparent specific gravity [5]. Accurate com- paction behavior equations will provide a means to pre- dict compaction. The ability to predict compaction is the first requirement for attaining control of compaction. Considerable research has been performed in attempts to develop soil compaction behaviour equations [6-12]. Others have also reported on effects of organic matter and tractor passes on compaction and yield of crops [13,14].
The aim of this study therefore was to observe the be- havior of Ilorin silty loam soils under uni-axial compres-
*
sion as it is affected by applied pressure and water con- tent and also to model the behavior using regression ana- lysis for the purpose of prediction.
2. Materials and Methods
2.1. Site of Soil Sample
The soil sample was taken from the arable soils of Na- tional Centre for Agricultural Mechanization (NCAM) Ilorin, Kwara State, Nigeria (8.30 N 4.32 E). The soil was Regosols (FAO). The soil samples were collected from the first 35 cm of soil profile; each sample was dug to a radius of 15 cm and then mixed thoroughly to get a homogeneous mixture, and then taken to the laboratory for further processing and analysis
2.2. Analytical Methods
Particle size analysis of the soils was performed using hydrometer method [16]. Organic matter content of the soils was determined using the [16] method. Other phy- sical and chemical properties of the soils were also deter- mined using standard methods.
2.3. Compression Test
The samples that collected were each air-dried and ground to pass through a 2-mm sieve. The moisture levels for compaction tests were chosen according to the consis- tency limits of the soils determined by the procedure de- scribed by [15]. Compaction test was performed by fill- ing the proctor mould with a known mass of soil and placed under a uni-axial compression apparatus (Univer- sal Testing Machine (UTM), manufactured by the Tes- tometric Co. Ltd., UK). Compression was carried out at a steady speed of 30 mm/min. Soil samples in the mould were subjected to 75, 100, 150, 200, 300, 400, 500, 600 kPa. The soil displacement and mass were recorded for each compaction. The mass was used to calculate bulk density of compacted soil sample. The proctor mould was 16.8 cm height and 10 cm diameter. A circular thick metal plate was placed on the compression end of the UTM to effect uniform compaction in the proctor mould. After each compaction test, the change in depth of com- pressed soil was measured with the aid of a digimatic vernier caliper.
2.4. Cone Index Measurement
Cone index (CI) was determined using a Rimick CP20 recording penetrometer (model CP 20 ultrasonic, Agridry Rimik Pty Ltd, Toowoomba), with a standard 30˚ cone of 322-mm2 base area and a penetration rate was less than 10 mm/s. Measurements were taken at two depths 5 and 10 cm of the proctor mould and the average of the
read-ings taken as the representative value of cone index at that treatment.
2.5. Shear Strength Measurement
The shear strength of the soil was observed using a 19 mm vane of a shear vane tester. Measurements were taken at two depths of 5 and 10 cm and the average re- corded to represent the shear strength of the particular treatment.
3. Results and Discussion
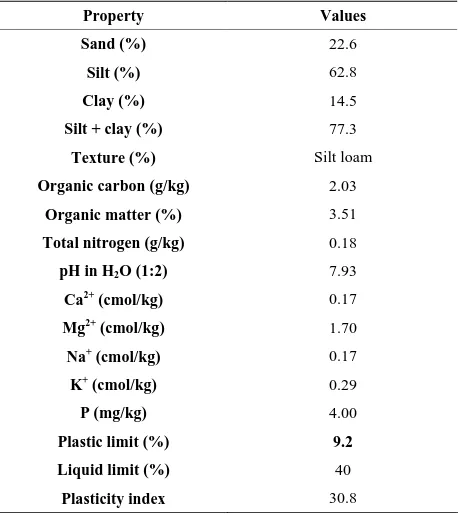
3.1. Soil Physical PropertiesThe soil studied was a silty loam soil according to the USDA textural classification of soils. Table 1 shows some physical and chemical properties of the soil. The consistency limits of the soils are also presented in Table 1. Plasticity index is an index of workability of the soil and a large range of plasticity index implies a need for large amounts of energy to work the soil to a desired tilth.
3.2. Soil Strength Properties
[image:2.595.309.538.479.736.2]Shear strength and cone index are indicators of soil strength. Shear strength is the resistance of soil to shear- ing or structural failure. The shear strength of an indi-vidual clod decreases with wetting, but more importantly, the strength of the bulk soil increases with increasing
Table 1. Some physical and chemical properties of experi-mental soil.
Property Values
Sand (%) 22.6
Silt (%) 62.8
Clay (%) 14.5
Silt + clay (%) 77.3
Texture (%) Silt loam
Organic carbon (g/kg) 2.03
Organic matter (%) 3.51
Total nitrogen (g/kg) 0.18
pH in H2O (1:2) 7.93
Ca2+ (cmol/kg) 0.17
Mg2+ (cmol/kg) 1.70
Na+ (cmol/kg) 0.17
K+ (cmol/kg) 0.29
P (mg/kg) 4.00
Plastic limit (%) 9.2
Liquid limit (%) 40
moisture up to the lower plastic limit at which each par- ticle is surrounded by a film of water which acts as lu- bricant. Soil strength drops sharply from that point to the upper plastic limit, where the soil becomes viscous.
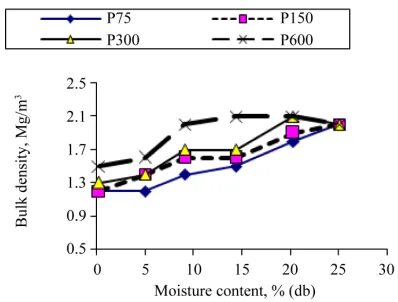
The effects of moisture content and applied pressure on shear strength of the experimental soils are presented in Figure 1. Shear strength increased with increase in moisture content up to a maximum and then decreased as the moisture content of the soil further increased. This is a typical soil behavior which has been reported by other researchers. The peak value occurred at higher moisture content as the applied pressure increased. The maximum shear strength of the soils at applied pressure of 600 kPa was 1025 kPa at moisture content of 9.1% (db). Similarly, the effects of moisture content and applied pressure on cone index of the soils are presented in Figure 2. The relationship is similar to that exhibited by shear strength. The maximum cone index at applied pressure of 600 kPa was 1325 kPa at moisture content of 5.0% (db).
[image:3.595.324.523.93.244.2]However, the effects of moisture content and applied pressure on bulk density showed behavior that was dif-ferent from those of shear strength and cone index ( Fig-ure 3).
Figure 1. Effect of moisture content and applied pressure on shear strength.
Figure 2. Effect of moisture content and applied pressure on cone index.
Figure 3. Effect of moisture content and applied pressure on bulk density.
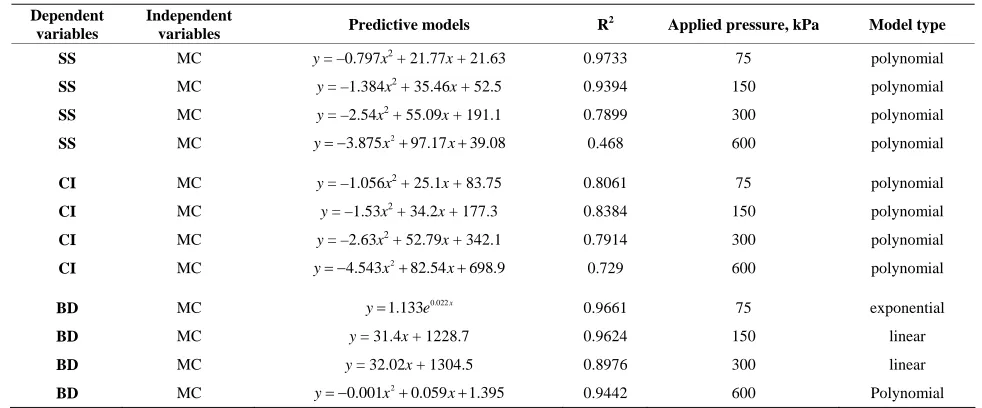
Regression models (Table 3) were also established to show relationships between compaction indices such as shear strength, cone index and bulk density at applied pressures of 75, 300 and 600 kPa representing a range of low to medium and high pressures. The relationships vary from linear to exponential and to polynomial func-tions.
The results also found a linear correlation between cone index and shear strength at a low applied pressure of 75 kPa. This agrees well with the findings of Vanags
et al. [1] who reported linear relationship between cone index and surface shear resistance of soil.
Bulk density decreased at higher moisture content after the peak value because further addition of water created greater water pressure which reduced soil compressibility. The maximum bulk density at applied pressure of 600 kPa was 2.1 Mg/m3 at 15.0 % (db). This moisture content was significant because it was the moisture content at which the soil reached maximum bulk density. This agrees with other researchers’ report that soils with high amount of fine particles (clay plus silt) are more suscep-tible to compactability [17].
[image:3.595.78.271.382.527.2]The regression models that describe the behavior of soil parameters shown in Figures 1 to 3 are presented in
Table 2. The models are largely nonlinear and they agree well with those reported by other researchers [6-12].
4. Conclusions
The following conclusions can be drawn from this study. 1) The study showed that compaction behavior of silt loam soil can be modeled after certain linear and non- linear regression equations.
2) Cone index have good positive linear relationship with shear strength, but can also be fitted with polyno- mial (quadratic) function with higher coefficient of deter- mination.
[image:3.595.74.275.569.709.2]Table 2. Relationships between dependent and independent variables.
Dependent variables
Independent
variables Predictive models R
2 Applied pressure, kPa Model type
SS MC y = –0.797x2 + 21.77x + 21.63 0.9733 75 polynomial
SS MC y = –1.384x2 + 35.46x + 52.5 0.9394 150 polynomial
SS MC y = –2.54x2 + 55.09x + 191.1 0.7899 300 polynomial
SS MC 2
3.875 97.17 39.08
y x x 0.468 600 polynomial
CI MC y = –1.056x2 + 25.1x + 83.75 0.8061 75 polynomial
CI MC y = –1.53x2 + 34.2x + 177.3 0.8384 150 polynomial
CI MC y = –2.63x2 + 52.79x + 342.1 0.7914 300 polynomial
CI MC 2
4.543 82.54 698.9
y x x 0.729 600 polynomial
BD MC 0.022
1.133 x
y e 0.9661 75 exponential
BD MC y = 31.4x + 1228.7 0.9624 150 linear
BD MC y = 32.02x + 1304.5 0.8976 300 linear
BD MC 2
0.001 0.059 1.395
y x x 0.9442 600 Polynomial
C = cone index; BD = bulk density; MC = moisture content; SS = shear strength.
Table 3. Relationships between cone index, shear strength and bulk density.
Dependent variables
Independent
variables Predictive models R
2 Applied pressure, kPa Model type
CI SS y1.184x24.52 0.6651 75 linear
CI SS y = 0.0006x2 + 0.97x + 60.5 0.7914 150 polynomial
CI SS y = 177.59e0.0025x 0.9687 300 exponential
CI SS 2
0.001 1.406 866.8
y x x 0.2600 600 polynomial
CI BD y = –627.3x2 + 1890x – 122 0.4711 75 polynomial
CI BD y = –0.0014x2 + 4.42x – 3108.8 0.8094 150 polynomial
CI BD y = –0.0017x2 + 5.30x – 3108.8 0.4531 300 polynomial
CI BD y = –10128x2 + 36518x – 31362 0.7790 600 polynomial
CI = cone index; BD = bulk density; MC = moisture content; SS = shear strength.
on cone index, shear strength was best fitted with poly- nomial function of the second order.
4) The effect of applied pressure and moisture content on bulk density of silt loam can be modeled after linear, exponential and polynomial regression functions.
5. Acknowledgements
The authors wish to acknowledge the good gestures of the management of the National Centre for Agricultural Mechanization (NCAM), Ilorin, Nigeria for allowing us to use their laboratory facility for this study.
REFERENCES
[1] C. Vanags, B. Minasny and A. B. McBratney, “The Dy-namic Penetrometer for Assessment of Soil Mechanical Resistance,” 2004.
http://www.regional.org.au/au/asssi/supersoil2004/s14/po
ster/1565_vanagsc.htm
[2] H. Hillel, “Soil and Water: Physical and processes,” Academic Press, New York, 1971.
[3] W. R. Gill and G. E. Van den Berg, “Soil Dynamics in Tillage and Traction,” Handbook 316, Agricultural Re-search Service, US Department of Agriculture, Washing-ton DC, 1968.
[4] S. Assouline, “Modeling Soil Compaction under Uniaxial Compression,” Soil Science Society of America Journal, Vol. 66, No. 6, 2002, pp. 1784-1787.
doi:10.2136/sssaj2002.1784
[5] A. J. Koolen and H. Kuipers, “Agricultural Soil Mechan-ics,” Springer-Verlag, New York, 1983, pp. 171-280. doi:10.1007/978-3-642-69010-5
[6] A. J. Koolen, “A method of Soil Compatibility Determi-nation,” Journal of Agricultural Engineering Research, Vol. 19, No. 3, 1974, pp. 271-278.
doi:10.1016/0021-8634(74)90066-3
[image:4.595.54.541.353.492.2]“Compres-sion of Agricultural Soils from Eight Soil Orders,” Soil
Science Society of America Journal, Vol. 44, 1980, pp.
450-457.
doi:10.2136/sssaj1980.03615995004400030002x
[8] G. R. Saini, T. L. Chow and I. Ghanen, “Compatibility Indexes of Some Agricultural Soils of New Brunswick, Canada,” Soil Science, Vol. 137, 1984, pp. 33-38. doi:10.1097/00010694-198401000-00005
[9] S. C. Gupta and R. R. Allmaras, “Models to Assess the Susceptibility of Soil to Compaction,” Advances in Soil
Science, Vol. 6, 1987, pp. 65-100.
doi:10.1007/978-1-4612-4682-4_2
[10] K. C. Oni, “Traffic Compaction and Tillage Effects on the Performance of Maize in Sandy loam Soil of Nigeria,”
Agricultural Mechanization in Asia, Africa and Latin
America, Vol. 22, No. 2, 1991, pp. 27-31.
[11] C. W. Smith, M. Johnston and A. Lorentz, “Assessing the Compaction Susceptibility of South African Forestry Soils. 1. The Effect of Soil Type, Water Content and Ap-plied Pressure on Uni-axial Compaction,” Soil Tillage &
Research, Vol. 41, 1977, pp. 53-73.
doi:10.1016/S0167-1987(96)01084-7
[12] D. D. Fritton, “An Improved Empirical Equation for Uni- axial Soil Compression for a Wide Range of Applied
Stresses,” Soil Science Society of America Journal, Vol. 65, 2001, pp. 678-684. doi:10.2136/sssaj2001.653678x [13] J. O. Ohu, G. S. V. Raghavan, E. McKyes and G. Mehuys,
“Shear Strength Prediction of Compacted Soils with Varying added Organic Matter Contents,” Transactions of
the American Society of Agricultural Engineers, Vol. 29,
No. 2, 1986, pp. 251-255.
[14] A. P. Onwualu and U. G. N. Anazodo, “Soil Compaction Effect on Maize Production under Various Tillage Meth-ods in a Derived Savanna Zone of Nigeria,” Soil &
Till-age Research, Vol. 14, No. 2, 1989, pp. 99-114.
doi:10.1016/0167-1987(89)90025-1
[15] T. W. Lambe, “Soil Testing for Engineers,” John Wiley, New York, 1951.
[16] A. Walkley and I. A. Black, “An Examination of the Dif-ferent Methods for Determining Soil Organic Matter and a Proposed Modification of the Chromic Acid Titration Method,” Soil Science, Vol. 37, No. 1, 1934, pp. 29-38. doi:10.1097/00010694-193401000-00003
[17] M. Krzic, C. E. Bulmer, F. Teste, L. Dampier and S. Rahman, “Soil properties Influencing Comppactability of Forest Soils in British Columbia,” Canadian Journal of