warwick.ac.uk/lib-publications
A Thesis Submitted for the Degree of PhD at the University of Warwick Permanent WRAP URL:
http://wrap.warwick.ac.uk/91932
Copyright and reuse:
This thesis is made available online and is protected by original copyright. Please scroll down to view the document itself.
Please refer to the repository record for this item for information to help you to cite it. Our policy information is available from the repository home page.
By: M. PELED
submitted for the Degree ot Doctor of Philosophy (Ph.D.)
THE UNIVERSI'rY OF WARWICK
School of Industrial and ~usiness Studies
December 1978
IMAGING SERVICES NORTH
Boston Spa, Wetherby
West Yorkshire, LS23 7BQ
www.bl.uk
CONTAINS
ACKNOWLEDGEMENTS
. . .
.
. . .
. .
. . .
INTRODUCTION
. . . .
.
. . .
.
.
.
.
.
.
.
. . . .
.
.
.
. . .
PART I. THE DEVELOPING ECONOMY
SECTION 1. THE GREAT DIVISION
· . .
. . .
. . . .
.
.
.
1.1 Developing versus Developed Countries up to 1960 1.2
1.3
The Polarisation to Date
What is a "Developing Country"
1.31 1.32
Other points of view • • • • • • • GNP to define state of development
. .
.
. .
.
1.4 Proposed Definition
· . .
. . . .
.
. . .
.
.
1.41 The 'Industrial Revolution' and the DevelopingCountries
.
. .
. . .
. .
. .
.
.
.
. .
SECTION 2. AIMS, PLANS AND REALITY
2.1 Industrialisation - Past Experience 2.2 Consideration of Industrialisation Aims
2.21 India
2.22 Malaysia • • • • • • •
· .
. . .
·
. .
2.23 Nigeria. • • •
.
. .
.
. . .
SECTION 3. WHY INDUSTRIALISE?
· . .
. . .
. . . .
.
. . . .
. . .
. . .
3.1 National Prestige
3.2 Provision of Work
. . .
.
.
.
.
. . . .
. .
.
.
3.21 Industrial wages and unemployment3.3 Raising the Standard of Living
3.4
3.31 Agro-Industrial linkage
Improvement of the Balance of
3.41 Import policies 3.42 Export policies
Trade
. . .
.
. . .
.
3.5 Creation of a Progressive Environment
3.6 Reality and Division - Summing Up Note
PART II.
SECTION 4.
4.1 4.2 4.3 4.4 4.5 4.6
SECTION 5.
5.1
5.2
5.3
PROPOSED INDUSTRIAL PLANNING APPROACH
SETTING THE SCENE
The Industrial Countries
The Less Developed Countries
. . . .
.
·
.
The Developing Countries. . . .
The Hong-Kong and Singapore Case The Philosophy of Industrialisation
The Philosophy of Industrial Planning
· .
LONG-TERM STRATEGY
The Two Schools of Thought
5.11 Growth and industrialisation approach 5.12 Basic needs approach • • • • •
.
.
The Prime Strategy
.
. . . .
.
. .
.
. . .
.
.
.
49 50 51 51 52 52 53 55 56 57 58 595.21 The prime strategy and political independence. 60
5.22 The prime strategy and the ruling party 60
'Consensus' Strategies • • • • • • • • • • • • • • •
5.31 Different priorities and planners' task
61
62
5.4 Government's Role and OWnership - A Pragmatic Approach 63
5.5 5.6 5.7 5.8 5.9 5.41 5.42 5.43 5.44
'Wholly' government controlled industries Government controlled industries
Partnerships - joint ventures
, Open' indus tri es • • • • • • • • • Size of Plants
. . .
64 64
65 65
66
5.51 Foreign involvement and indigenous management. 67
Industrial Cooperatives
.
.
.
5.61 Social development • • • 5.62 Technological development 5.63 Managerial development 5.64 The cooperative centre
·
.
.
. .
.
.
· .
.
. .
Small Scale Industries
.
.
. .
5.71 Advantages • • • •
. . .
.
.
5.72 Disadvantages5. 73 Industry centres
.
.
.
The Development of Basic and Intermediate Industries
5.81 5.82
The pros and cons • • • • • • • • • • • Accelerated industrialisation - constraints
and remedies • • • • • • • •
Conclusion Note - Long-Term Strategy
6.2
SECTION 7.
7.1
7.2
SECTION 8.
8.1
Investment Criteria
6.21 Foreign currency posi tion 6.22 National economy consideration 6.23 Social considerations • • • •
. . .
.
. . .
REGIONAL ALLOCATION OF INDUSTRIAL PROJECTS .
Income per Inhabitant (IPI) as Main Consideration for Regional Allocation of Projects • • • • • • 7.11 Kilosa district example . ,
7.12 IPI and town population . , . 7.13 Industrial centres • • • • Assistance to Rural Industry
·
.
.
7.12 General subsidies
7.22 Ad hoc subsidies
· . . .
· . .
.
· .
· .
.
·
. .
·
.
.
.
PROJECT EVALUATION
· . .
.
.
. . .
.
Tasks of Rules Committee
· .
. .
.
8.11 Prices
.
. .
. ·
·
·
·
· ·
· .
8.12 Subsistence farmers· · ·
8.13 Exportab1es
· · ·
8.14 By-Products
· · ·
·
8.15 Interest Rates·
·
·
· ·
· . .
8.16 Transport and utilities·
· · . .
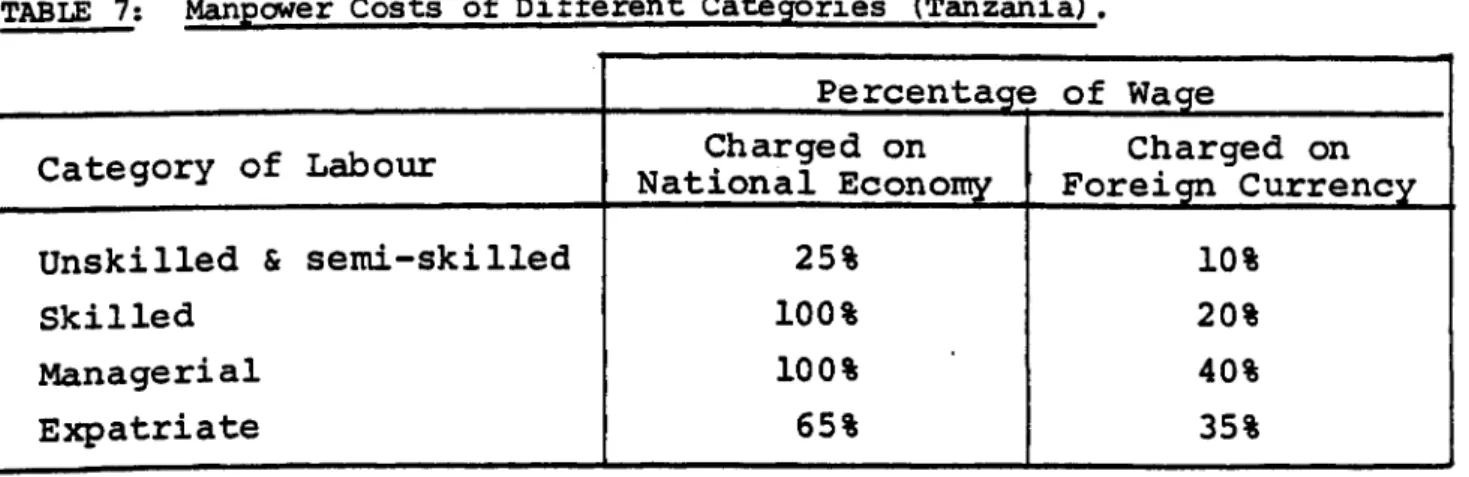
8.17 Manpower Costs
·
· · ·
·
·
·
·
.
. .
.
8.2 Application of Investment Criteria • • • •8.21 The ratios and criteria 'l • • •
SECTION 9. PROTECTION POLICY
· . .
9.1 protection by Import Duties
· . .
.
. .
.
.
.
9.2 9.11 9.12 9.13 9.14 9.15 9.16
Infant industries • • • • • •
Home base for export industries • • • • • • • strategic industries • • • • • • • • • • • Optimizing of local content • • • •• • • Raising reven1Je • • • • • • • • • • • • •
Other issues . . . . . . .
Protection by Administrative Measures
.
. .
.
SECTION 10. THE PLANNING PROCESS
10.1 The Plan of Action
10.11 What? 10.12 Where?
10. 13 By whom?
10.14 When?
107
108
108 109 109 109
10.2 The Industrial Programme 109
10.3 Project and PrograImDe lIlillemen tation 112
10.31 Pre- feasibi l i ty • • • • • • 112
10.32 F e a s i b i l i t y . • • • • • • • 113
10.33 Pre-implementation, detailed planning & design 115
10.34 Erection of the plant and mobilisation of
personne 1 • • • • • • • • • • • • • • • • 117
10.35 Start-up and production • • • • 118
10.4 Industrial Development Bank • • • • 113
10.5 Industrial-Planning Organisation • • • • • 120
10.51 D a t a - u n i t . . . 121
10.52 Pre-feasibility and feasibi1i~1 studies-unit. 122
10.53 Central planning, evaluation & coordination 123
10.54 Plan iIrl'lementation and control - unit 124
TABLE NO.
1.
2.
3.
4.
5.
6.
7.
8.
9.
10.
The 20 ("Richest") Developed Countries
'!'he 21 ("Poorest") Developing Countries
Average Indicators of Economic Development and Standard of Living in Some Countries • • • • • • • •
Ivory Coast, GDP by Kind of Economic Activity
Ivory Coast - GDP Projections of Economic Activity
1980-1985 • • • • • • • • • • • • • • • •
List of Towns and Districts in Tanzania Arranged According to its IPI • • • • • • • • • • • •
Manpower Costs of Different Categories (Tanzania)
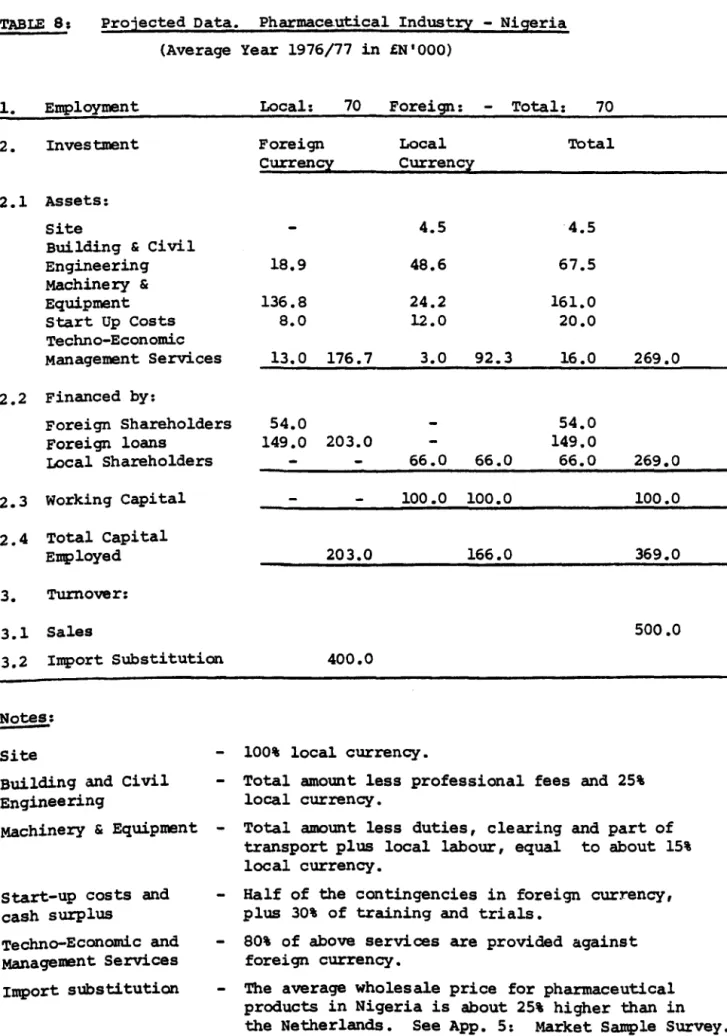
Projected Data. Pharmaceutical Industry - Nigeria
Projected Income and Expenditure, Pharmaceutical Industry
Nigeria . . . . . . .
Internal Rate of Return - Nigeria
. .
. .
. .
.
DIAGRAM NO.
1. From Policy to Production • • • • • • • • •
Logical Flow Diagram for Developing Countries
. .
.
.
.
.
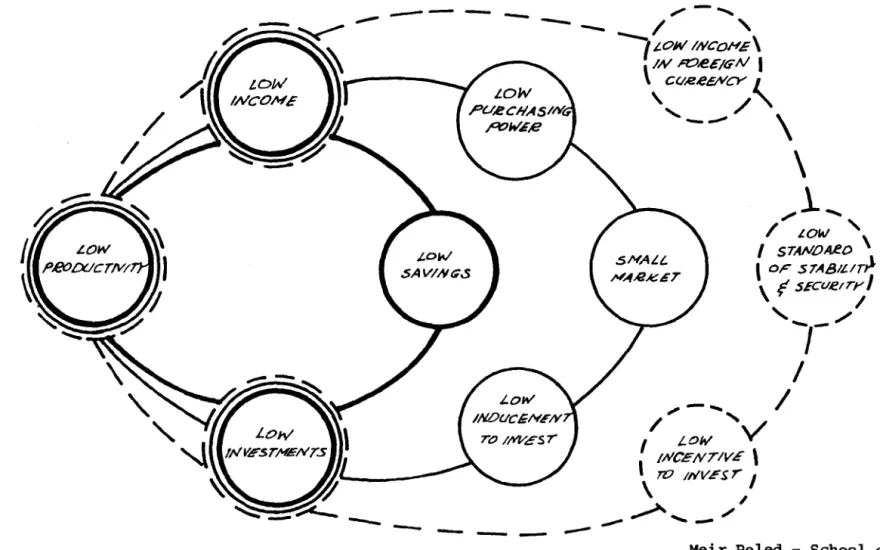
2. The Three Vicious Circles of Poverty in Developing Countries
. . . .
.
. . .
. .
.
. .
. .
.
.
17
18
22
42
43
85
94
96
97
99
111
ANNEX A
ANNEX Al
ANNEXA2
ANNEX A3
ANNEX A4
ANNEX B
ANNEX C
ANNEX D
ANNEX E
ANNEX F
LIST OF ANNEXURES
World Population, GNP per capita & Growth
Population (Mid-1970) and Average Annual Growth Rate
Population, Average Annual Growth (1960-1970) Arranged According Growth Rates • • • • • • •
Gross National Product per capita at Market Prices (1970) and Average Annual Growth Rate (1960-1970)
GNP per capita Annual Growth (1960-1970) Arranged According Growth Rates • • • • . • • • • • • •
A Guideline for Sectoral OWnership - Industrial Classification • • • • . • • • • • • • • •
.
.
.
Regional Allocation Projects Second FiveYear Plan -TaIl zaIli a • • • • • • • • • • • • • •
Encouragement of Non-Agricultural Activities in the Rural Areas - Training and Running-in Loan • • • •
Guidelines for Industrial Feasibility Studies
Planning and Implementation System for the control of a National Industrial Plan • • • • • • • • • •
128
129
132
135
138
141
149
154
164
ACKNOWLEDGEMENTS
It is a pleasant duty to express my gratitude to my supervisor, Professor B.T. Houlden, who provided the initial stimulus which encouraged me to tackle such a wide field. His pertinent and constructive reviewing and advice, extending over many sessions, are very much appreciated.
My special gratitude, though of a different kind, is due to President J.K. Nyerere and Minister P. Bomani of the United Republic of Tanzania who, twelve years ago, were the first to listen to my ideas and provided me with their unqualified support in implementing them. The few successes and the many errors resulting from my efforts gave me important experience
for my future work in the Third World.
I should also like to thank my Examiners, Professor R.E. Thomas and Dr. J. Charnock, for their subtle criticisms and suggestions which made me much more sensitive to issues which I might have otherwise overlooked.
9
INTRODUCTION
To escape from national poverty is the principal goal of the Developing Countries. A large number of current national state-ments of development indicate a growing awareness of the need to pursue plans that are increasingly sensitive to
socio-economic problems. The development of industrial activity is most likely to supply the dynamics and momentum to mobilise the necessary resources to start this escape from poverty.
My approach to and proposals for more effective industrial planning, are based on an analysis of the relevant literature, and the comparison and evaluation of a considerable number of national and industrial plans.
Part I deals with the ever-increasing gap between the GNP
per capita of the Developed and the Developing Countries during the last 100 years. I show that this gap has widened more
rapidly between the 1960's and the 1970's. The literature on the industrialisation efforts since the late 1950's is sur-veyed and the experience gained is assessed. In this way, the major constraints shared by almost all Developing Countries, although varying in background, starting-point and social aspiration, are scrutinized.
Part II provides an outline of situations and decisions.which directly affect the process of industrialisation in the
majority of Developing Countries, while the planning process
11
In attac~ing the most common issues, I am guided by two
prin-ciples: firstly,that these situations and issues are indeed the most important and, secondly, that by adequate planning, better practical results can be obtained - provided that the planning principles and their application are kept clear and simple.
Planning is not only the design of a desired future, but i t means, in its proper sense, taking decisions - and following them up - in order to bring this desired future about.
This thesis suggests, therefore, a pragmatic approach which is reinforced by my practical experience over several years in a variety of Developing Countries, where I prepared
PART I. THE DEVELOPING ECONOMY
"Il n'y a qu'un prob zeme phi losophique vraiment seZ'ieu:x:: c I est le suicide. I'
13
SECTION 1. THE GREAT DIVISION
The division of the world into "developed" (or "industrialised") and "developing" (or "underdeveloped") countries is an unfortu-nate fact.
When did this polarisation start among the individual countries, what happened in the last decade and how are we to define a
Developing Country?
1.1 DEVELOPING VERSUS DEVELOPED COUNTRIES UP TO 1960
There is a standpoint according to which the division started with the industrial revolution, since "in the early nineteenth century there was not much difference between the
living-standards of the British and the Chinese peoples" (Dr. J. Bognar).
According to S.J. Patel in 'Economic Transition in Africa' per capita national income in dollars in the industrial coun-tries (Western Europe, North America, New Zealand, Australia and the East European countries) and the developing countries was as followsil )
(1) oswaldo Sunkel in "Underdevelopment in Latin America: Towards the Year 2000" in Jagdish Bhagwati edt. Economics and World Order from the 1970~ to the 1990s, Macmillan COllFany, London, wrote: "the USA achieved a per capita income of $200 around 1832, the U.K. in about 1837, France
in 1852, Germany around 1886 and Italy only in 1909. Around 1850 the average per capita income of the countries now regarded as "developed". or "advanced" reached some US$ 150, while the rest of the world
Industrial countries Developing countries
15
1850 150 100
1960 1100 120
Thus, the ratio between the Industrial and Developing countries in the mid-nineteenth century was 1 : 1.5 and in the 1960's it was 1 : 9.2.
According to other opinions, the now developed countries were already much more developed in the nineteenth century than the developing countries are now. Kuznets(l) made efforts to
approach the problem from other aspects and with different methods.
According to his calculations, per capita income increased in the Developing countries in the last 100 years at most by 50 per cent, while in the developed countrie.f. _it grew four-fold. Since according to his assumption GNP per capita in
the poorest countries, around the middle of the vNentieth
century, was approx. $75 and in the most advanced $1,400, thus the ratio was 1 : 19. Therefore, a hundred years ago the ratio was 75/1.5 : 1400/4 i.e. 1 : 7.
1850 1960 Growth
Industrial countries 350 1400 300%
Developing countries 50 75 50%
Ratio 1:7 1:19
In this sense the present huge difference is also considered by Kuznets to be relatively recent. (2 )
(1) Simon Kuznets: "Modern Economic Growth: Ratio Structure and Sp~ead," Yale Uni versi ty Press 1966. See also "Econanic Growth and Economic Inequali ty," American Economic Review, Vol. 45/1955.
1.2 THE POLARISATION TO DATE
It appears almost certain that the gap between the industrial-ised and the developing countries has come about during the last 100 years. The question naturally arises: has the polarisation intensified in the last decade?
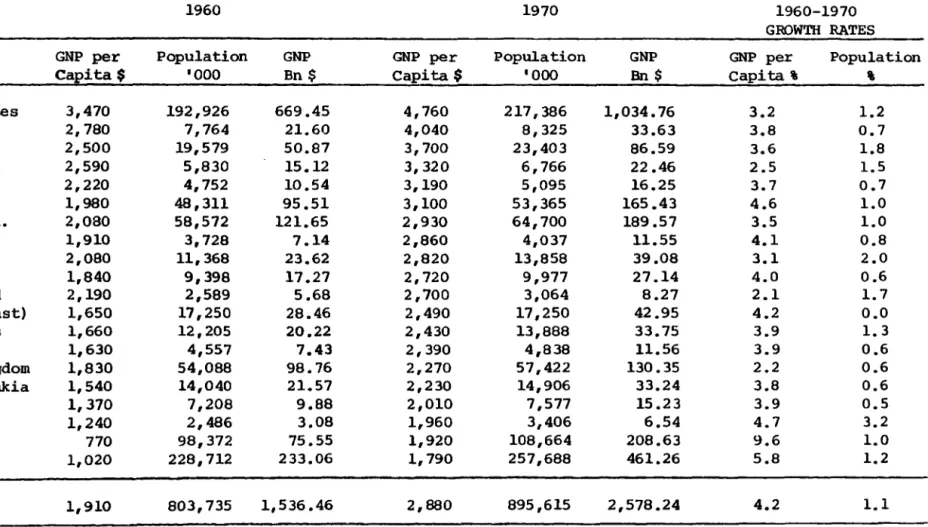
To answer this question I have compared the 20 "richest" and 21 "poorest" countries over the period of 1960 to 1970 and the results are given in Tables 1 and 2. These two tables are based on Annex A. It is notable that during the 1960's the population growth rate in the 21 "poorest" countries was more than double the rate of the 20 "richest" countries
(2.3% versus 1.1% respectively).
During the same period, GNP in the 20 "richest" countries grew from $1,536.46 Bn to $2,578.24 Bn (68%) and in the 21 "poorest" countries from $74.80 Bn to $108.12 Bn (45%).
To illustrate this situation, one may compare the 21 "poorest" countries with a total population of 1.077 Bn and total GNP of only $108 Bn to the U.K. with a population of 57 million and a GNP of $130 Bn. (1)
To demonstrate the increasing polarisation I calculated the
GNP per capita in the two groups of countries for 1960 and 1970;
TABLE 1: The 20 ("Richest") Deve1op-ed Countries.
1960 1970 1960-1970
GROWTH RATES
No. Country GNP per Population GNP GNP per Population GNP GNP per Population
Capita $ '000 Bn $ Capita $ '000 Bn$ Capita ,
"
1. United States 3,470 192,926 669.45 4,760 217,386 1,034.76 3.2 1.2
2. Sweden 2,780 7,764 21.60 4,040 8,325 33.63 3.8 0.7
3. Canada 2,500 19,579 50.87 3,700 23,403 86.59 3.6 1.8
4. Switzerland 2,590 5,830 15.12 3,320 6,766 22.46 2.5 1.5
5. Denmark 2,220 4,752 10.54 3,190 5,095 16.25 3.7 0.7
6. France 1,980 48,311 95.51 3,100 53,365 165.43 4.6 1.0
7. Germany Fed. 2,080 58,572 121.65 2,930 64,700 189.57 3.5 1.0
8. Norway 1,910 3,728 7.14 2,860 4,037 11.55 4.1 0.8
9. Australia 2,080 11,368 23.62 2,820 13,858 39.08 3.1 2.0 ~
10. Belgium 1,840 9,398 17.27 2,720 9,977 27.14 4.0 0.6 -....J
11. New zealand 2,190 2,589 5.68 2,700 3,064 8.27 2.1 1.7
12. Germany (East) 1,650 17,250 28.46 2,490 17,250 42.95 4.2 0.0
13. Nether1andu 1,660 12,205 20.22 2,430 13,888 33.75 3.9 1.3
14. Finland 1,630 4,557 7.43 2,390 4,838 11.56 3.9 0.6
15. united Ki.ngdom 1,830 54,088 98.76 2,270 57,422 130.35 2.2 0.6
16. Czechoslovakia 1,540 14,040 21.57 2,230 14,906 33.24 3.8 0.6
17. Austria 1,370 7,208 9.88 2,010 7,577 15.23 3.9 0.5
18. Israel 1,240 2,486 3.08 1,960 3,406 6.54 4.7 3.2
19. Japan 770 98,372 75.55 1,920 108,664 208.63 9.6 1.0
20. USSR 1,020 228,712 233.06 1,790 257,688 461.26 5.8 1.2
Total & Averages 1,910 803,735 1,536.46 2,880 895,615 2,578.24 4.2 1.1
NOTES: 1. This Table is based on Annex A.
1960 1970 1960-1970 GRCM'nI RATE
No. Country GNP per Population GNP GNP per Population GNP GNP per Population
Capita $ '000 Bn$ Capita $ '000 Bn $ Capita ,
,
1. Rwanda 70 3,102 0.22 60 4,169 0.25 -1.5 3.0
2. Burundi 55 3,210 0.18 60 3,913 0.23 0.8 2.0
3. Upper Vo1ta 65 4,853 0.32 60 5,974 0.36 -0.6 2.1
4. Mali 45 4,522 0.20 70 5,567 0.39 4.4 2.1
5. Somalia 80 2,512 0.20 70 3,184 0.22 -1.1 2.4
6. Malawi 65 3,905 0.25 80 5,048 0.40 2.1 2.6
7. Afghanistan 75 12,952 0.97 80 15,788 1.26 0.5 2.0
8. Ethiopia 60 22,087 1.33 80 27,456 2.20 2.8 2.2
9. Indonesia 70 104,672 7.58 80 127,595 10.21 1.0 2.0
10. Yemen Arab Rep. 65 5,140 0.33 80 6,389 0.51 2.0 2.2 ...
11. Burma 75 24,862 1.86 80 30,605 2.45 0.6 2.1 00
12. Nepal 75 10,116 0.76 80 12,092 0.97 0.5 1.8
13. Chad 75 3,330 0.25 80 3,980 0.32 0.4 1.8
14. Zaire 70 16,376 1.15 90 21,584 1.94 2.7 2.8
15. Dahomey 90 2,347 0.21 90 3,124 0.28 0.1 2.9
16. Niger 110 3,485 0.38 90 4,638 0.42 -2.0 2.9
17. Pakistan &
80 113,932 8.99 100 148,713 14.87 2.4 2.7
Bangladesh
18. Vietnam (North) 75 18,423 1.38 100 24,282 2.43 3.2 2.8
19. Tanzania 70 11,729 0.82 100 15,014 1.50 3.6 2.5
20. Haiti 120 4,409 0.53 110 5,374 0.59 -0.9 2.0
21. India 100 480,295 46.89 110 602,927 66.32 1.2 2.3
Totals & Averages B7 856,259 74.80 100 1,077,416 108.12 1.4 2.3
19
GNP PER CAPITA
1960 1970 Growth
20 ("richest") Developed Countries 21 ("poorest") Developing Countries Ratio
$1910
$ 87 1:22
$2880 $ 100 1:29
51% 15%
It took 100 years between 1850 and 1950 to increase the ratio between the developed and the developing countries from 1 : 7 to 1 : 19, i t needed only 10 years to increase the ratio from 1 : 22 to 1 : 29.
In spite of increased economic activity in the Developing Countries, after the majority of them gained independence,
the polarisation intensified and accelerated between 1960 and 1970. Unfortunately there are no signs that this trend
'11 h (1)
Wl. C ange.
1.3 WHAT IS A "DEVELOPING COUNTRY"
It is not easy to find a single index capable of determining
whether a given country or region is "developing" or "developed". The difficulty is largely in that there are enormous differences in political and social structure, cultural background and
natural resources. One may, for example, contrast the relative-ly abundant natural resources in various countries of Latin America and Africa with their very low national income per capita figures.
(1) According to David Morawetz: "Twenty-five years of Economic Development" (1950-1975) Washington, 1977, the over-all growth rates of Developing countries did not even begin to close the absolute gap in income per capita during 1950-1975. He says in pp. 27-29: "In fact, during the 3rd quarter of a century, there was not a single region or country
Some developing countries have a major source of income in foreign trade (Singapore or Malta), yet others - Ethiopia or Somalia, for instance - do not. Furthermore, there are some very important conditions ranging from areas of primitive agriculture to areas of advanced industrialisation.
1.31 Other Points of View
A useful approach may be found in seeking some form of common denominator among developing states.
Liebenstein(l) has classified common characteristics such as:
economic: a large proportion of the population is engaged in agriculture; there is a low income per head and foreign trade per head figure; a low rate of savings and capital formation exists; a high proportion of income is expended on food; there is a low standard of housing; credit
facilities are poor.
demographic and health: there are dietary deficiences; both fertility and mortality rates are high; health is poor and there is inadequate sanitation.
technological: yield is low; system.
this is at a crude level; labour productivity-there is a poor communication and transport
cultural and political: illiteracy is prevalent; there is a high level of child-labour; there is no middle-class; values are traditional; women have inferior status.
Bennett's(2) non-monetary index was contrived to compare
consumption levels of various states and also the various stages
(1) Harvey Liebenstein: "Economic Backwardness, Economic Growth," Wi1ey (N. Y.) 1957, pp. 38-45.
21
of development they undergo. He took the level of consumption as the total of food, fuel and non-durables utilised, the
services of durable and semi-durable goods used, together with personal services. His measurements were:
(a) Food: total number of calories per head per day at the retail level, and the percentage of calories derived from sources other than roots and flour.
(b) Medical Services and Health: the number of physicians and of hospital beds per 1,000 of the population.
(c) Housing: the figure for the average of sawn-wood consump-tion in cubic metres per 1,000 of the populaconsump-tion.
(d) Clothing: metric pounds of cotton, wool and rayon textiles consumed per head.
(e) Education: total school population enrolled at schools, newsprint consumed per head of the population. (He also measured leisure in terms of the number of cinemas per 1,000 of the population, but this is not universally
accep~ed as a sound idea, nor is i t universally applicable.)
(f) Transport and Communication: passenger and commercial vehicles per 1,000 of the population, kilometres of rail-way track per 100 sq.km. of land, annual freight per head
(ton/mile), and the number of telephones and radios per 1,000 of the population.
Additional indices suggested include the total energy consumed per head and the number of livestock units per head.
In the U.N. Report on International Definition and Measurement of Standards and Levels of Living (1954), the idea was to present the indicators listed by Bennett in absolute and in relative
terms (i.e. showing each activity as a percentage of the indi-cator, the highest value being expressed as 100). The total of
These indices were further developed in an attempt to quantify the Basic Needs of the poorest parts of the population. In Part II under 5.12 I examine this concept in relation to the identification of a long-term industrial strategy for a
Developing Country.
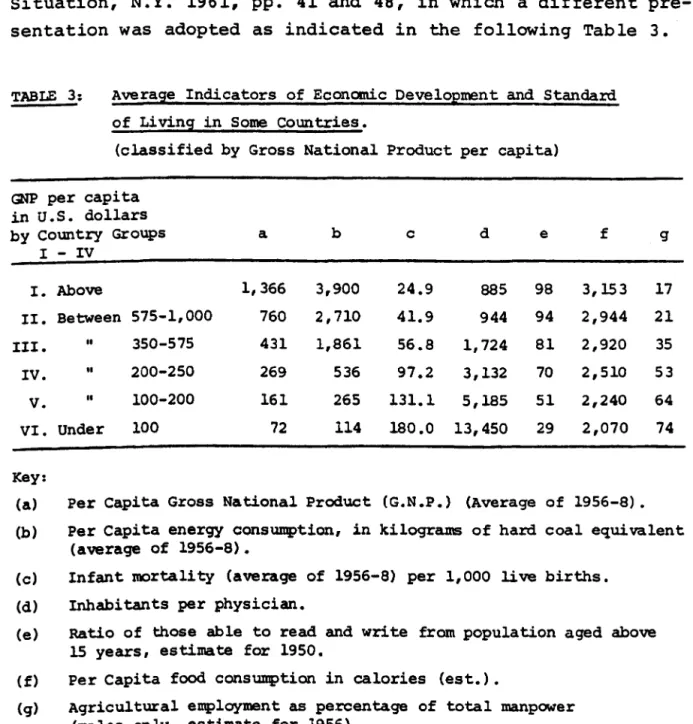
Other attempts were made in the U.N. Report on the World
Situation, N.Y. 1961, pp. 41 and 48, in which a different pre-sentation was adopted as indicated in the following Table 3.
TABLE 3: Avera5le Indicators of Economic Deve1012ment and Standard
of Livin5l in Some CO\.mtries.
(classified by Gross National Product per capita)
GNP per capita in U.S. dollars
by CO\.mtry Groups a b c d e f g
I - IV
I. Above 1,366 3,900 24.9 885 98 3,153 17
I I . Between 575-1,000 760 2,710 41.9 944 94 2,944 21
Ill. 11 350-575 431 1,861 56.8
1,724 81 2,920 35
IV. 11 200-250 269 536 97.2 3,132 70 2,510 53
V. 11 100-200 161 265 131.1 5,185 51 2,240 64
VI. Under 100 72 114 180.0 13,450 29 2,070 74
Key:
(a) Per Capita Gross National Product (G.N.P.) (Average of 1956-8).
(b) Per Capita energy consumption, in kilograms of hard coal equivalent (average of 1956-8).
(c) Infant mortality (average of 1956-8) per 1,000 live births.
(d) Inhabitants per physician.
(e) Ratio of those able to read and write from population aged above 15 years, estimate for 1950.
(f) Per Capita food consumption in calories (est.).
23
Country Groups referred to in Table 3:(1)
Group I :
Group 11 :
Group I l l :
Group IV :
Group V :
r;roup VI :
EUROPE, NORTH AMERICA, OCEANIA:
Australia, Canada, New Zealand, Sweden, Switzerland, U.S.A.
EUROPE, NORTH AMERICA, OCEANIA:
Belgium, Czechoslovakia, Denmark, Finland, France West Germany, Netherlands, Norway, Soviet Union, United Kingdom.
LATIN AMERICA: Venezuela. ASIA:" Israel.
EUROPE, NORTH AMERICA, OCEANIA:
Austria, East Germany, Hungary, Ireland, Italy, Poland. LATIN AMERICA:
Argentina, Chile, Cuba, Puerto Rico, Trinidad & Tobago, Uruguay.
AFRICA: Republic of South Africa.
EUROPE, NORTH AMERICA, OCEANIA:
Bulgaria, Greece, Spain, Turkey, Yugoslavia. LATIN AMERICA: Guyana, Costa Rica, Jamaica, Mexico, Panama.
ASIA: Malaya, Japan.
EUROPE, NORTH AMERICA, OCEANIA: Albania, Portugal, Romania.
LATIN AMERICA: Brazil, Columbia, Dominican Republic, Ecuador, Honduras, Nicaragua, Paraguay, Peru.
AFRICA: Ghana.
ASIA: Ceylon, the Philippines.
LATIN AMERICA: Bolivia. AFRICA: Congo (Kinshasa).
ASIA: Burma, Cambodia, Taiwan, India, Indonesia, Laos, Pakistan, Thailand.
(1) Source: Report on the World Social Situation, U.N., New Yont, 1961,
Evidently, from the above "key" (& Note) it is an almost
impossible task to collect fairly accurate and comparable data for the same period for all developing countries. Consequently, the usefulness of compiling all such out-dated information is doubtful indeed.
1.32 GNP to Define State of Development
The most commonly used indicator of the level of development is taken from national income data; e.g. measuring GNP per capita. This convenient measure is widely used. Some of the limitations are noted in Annex A, others it may be appropriate to point out here:
(a) Economic Development should refer also to the quality of life. National income statistics, however, cannot include all the appropriate elements, particularly the
"non-economic" ones such as the extent and degree of well-being of society within its political and social frame-work. Moreover, these statistics tell nothing about distribution of the output and income and little about
the adequacy of employment opportunities they have generated.
It is also true that the national income can increase, without the inhabitants of the country deriving much direct benefit. (1)
(b) The statistics may not be uniformly accurate and may not be comparable.
(c) It is difficult to convert national income data into a
common monet~ry standard (usually the U.S. $) for comparison, since exchar~ge rates are themselves arbitrarily and
artificially fixed.
25
1.4 PROPOSED DEFINITION
A more useful definition would divide the world into three groups: the Developed, the Less Developed (LDC s) and the Developing Countries.
There are some countries, e.g. Brazil, Mexico, South Korea,
Hong Kong, which are industrialising rapidly and therefore could be classified as LDCs.
There are others, about 60, to include all the countries in Africa south of the Sahara and the majority of countries in Latin America and Asia, where the conditions for development hardly exist at present. This last group could be classified as "Developing Countries".
For the purpose of this dissertation I have developed the
following definition by T & E tests based on Annexes A2 and A4.
The definition of a "Developing Country" is therefore a country where at least 2 of the following 3 situations persist:
( i ) the GNP per capita in 1970 U.S.$ is less than $400 per annum.
( ii) the annual growth rate of GNP per capita is less than 2.0 per cent.
(iii) the population growth rate is more than 2.0 per cent per annum.
It is the "Developing Countries" with which this dissertation is concerned.
1.41 The 'Industrial Revolution' and the Developing Countries
The above definition implies that the polarisation between the Developed and Developing Countries occurred because of the
phenomenon of the progress of North America, Western Europe and Japan so far ahead of all other countries, occurred mainly during the last 125 years (1.1 & 1.2). It is therefore generally
accepted that this phenomenon was, in fact, the 'Industrial Revolution' •
At the end of the 18th century the 'Industrial Revolution' manifested itself and it gained momentum in the 19th century.
Its most spectacular results became apparent during the first half of the 20th century when it finally led to the post-war economic boom period of the last 25 years.
27
SECTION 2. AIMS, PLANS AND REALITY
Nehru said: "Real progress must ultimately depend on indus-trialisation." Indeed, industrialisation is more than an ef-ficient method to manufacture goods - i t is a comprehensive system of th~nking. This is why 'industrialisation' served as a synonym for progress and development in many newly independent Developing Countries. (1)
The pre-occupation of many Developing Countries with industrial expansion from the 1950s onwards, has led to modest results.
During the 1960s, for example, some of the 21 poorest Developing Countries recorded on average an annual increase of about 7 per cent in their manufacturing activity as against an average
increase of about 3.75 per cent in their total gross national product. (2) There was, however, a wide dispersion in the experience of individual countries.
Some of the poorest countries, because of their extremely low starting base, experienced an annual increase of 10 per cent or more in their manufacturing activity, whereas others re-corded an annual rate of 5 per cent or less.
To summarise the achievements and failures of the industrialisa-tion effort in the last decades, it is essential to review the various policies that led to the results obtained. Equally re-levant is to discuss the development statements of various De-veloping Countries and to perceive the reasons for the need to industrialise.
(l)For elaboration see 4.5
29
2.1 INDUSTRIALISATION - PAST EXPERIENCE
The current plans of many Developing Countries project a con-tinuing industrialisation drive. For the first half of the 1970s these countries have set, on average, a target of an annual increase of around 10 per cent in their manufacturing output.
The actual record in this regard since 1970, although short of this target, shows a significant acceleration over the average growth rates of the 1960s. Up to the closing months of 1975, manufacturing output was exceeding the indicative target of 8 per cent annual increase included in the Inter-national Development Strategy for the Second United Nations Development Decade.
Some countries have projected an annual increase of 14 or 15 per cent in their manufacturing production; some others have as a target an annual increase of only 4 or 5 per cent. By the end of the 1970s a few Developing Countries expect manu-facturing to account for a quarter or more of their gross domestic product; but there are some others in which this share is still envisaged to remain less than one tenth. Some are manufacturing consumer goods for the home market as well as for export; a number are manufacturing capital goods, in rare cases for export.
According to United Nations estimates, the Developing Countries, which accounted for less than 7 per cent of world manufacturing output in 1960, have not increased their share since then.
2.2 CONSIDERATION OF INDUSTRIALISATION AIMS
The Pearson Report(l) throws interesting light upon development targets in relation to industrialisation. It suggests that the two objectives of increase of GNP rate and decrease of
un-employment may well be incompatable:
"The failure to create meaningful employment is the most tragic failure of development. All indications are that underemployment and under-utilisation of human resources have increased in the 1960s and that the problem will grow even more serious."
This is true. The target concerned with maximising output
conflicts - in many cases - with that of maximising employment. In fact, even more fortunate Developing Countries with around 6-8 per cent per year growth in GNP per capita, meet with rising unemployment.
During the 1950s Venezuela and Jamaica were among those with an 8 per cent growth rate, yet each in 1960 had a higher level of unemp loymen t than it had ten ye ars be fore. Morse (2) has suggested that 280 million persons will be added to the world's
labour force during the 1970s and that 173 million will be in Asia, 32 million in Africa and 29 million in Latin America.
Authoritive estimates also state that the total of unemploy-ment and underemployunemploy-ment in Developing Countries rose from 166 million to 248 million between 1960 and 1970, or from 24.7 per cent to 29.5 per cent of the labour force (see footnote related
to 3.21).
(l)committee on International Development (Chairman: Lester Pearson) "Partners in Development, It 1969, p.6S.
(2)D.A. Morse: "The World Employment Programme," International Labour Review (Geneva) Vol. 97, June 1968. See also D. Turnham: "The Employment
31
These facts must be taken into account in the establishment of the industrialisation target in any development plan. Technolo-gical progress will usually result in an increase in
product-ivity per man-hour and this, in turn, gives rise to possibilities of economising in labour. The pattern of industrial development shows itself in capital-intensive (and labour-saving) forms so that the number of available jobs is reduced.
It is now being recognised that there is continuous scope in many Developing Countries for labour-intensive products to meet the demands of both domestic and foreign consumers. It is
suggested for instance that necessities may be supplied in the form of pounded rice rather than machine-milled, or hand-woven cloth instead of factory-produced, or wooden or brick houses instead of re-inforced concrete buildings. (1)
However, the creation of such "Intermediate Technologies" or "new" practices borrowed from the past, requiresmuch time, scientific and technical sophistication and a good deal of
very expensive expertise which is difficult to organise. These technologies, if implemented, may, more often than not, reverse the process of seeking a higher degree of industrial efficiency and competitiveness, in order to create additional employment in the short-run.
To emphasise the different approaches to industrialisation, it is worthwhile taking some actual examples of planning in Developing Countries and examining briefly the way in which these efforts fit into the general context.
(l)The late E.F. Schumacher developed this theme during the last decades. His work "Small is Beautiful," Blond & Briggs, 1973, sums up his efforts
2.21 India (1)
The general objectives of Indian Planning are stated to be
strengthening the base of Indian society and rende~ng
it more resilient, to maximise the utilisation of her own human and physical resources, remove want and misery and.make human life richer and fuller. In other words, the removal
(at least the reduction) of mass poverty.
The simple target for economic growth is 5.5 per cent per annum. However, as the Planning .Commission reports:
••••• a growth-oriented strategy must have woven in it a series of redistributive measures which in turn requires planning not only for a high growth rate, but also for a particular composition of growth which favours the weaker sections of society.1I
Part of the strategy involved, therefore, includes creation of employment opportunities, the development of a programme of minimum needs, regional development, as well as the official procurement and distribution of essential commodities. And, since half of India's national income is generated by agricul-ture, output from that sector is an important element in growth.
Individual industrial output targets include, specifically, those for mild steel, and basic inputs such as fertilizers, cement and electricity. Other priorities emerging from the massive increase in capital investment also envisaged, are the adequate production of such consumer goods as sugar, textiles and drUgs, together with basic services such as education, drinking water, housing and so on.
The motivation of decreased reliance upon imports is also ~~e
reason for the boosting of domestic production of much of the machinery needed for industrial expansion.
33
2.22 Malaysia
In Malaysia there is the official "New Economic Policy," the vehicle of which was recently the Second Malaysia Plan (1971-1975). The stated objectives here are: the eradication of poverty in Malaysian society and the elimination of the iden-tification of race with particular forms of economic activity.
However, the twin objectives are difficult to achieve (being very much the core of the state's economic and political dis-putes) and it appears that an overall slower growth rate has to be accepted in order to raise the level of the rural popula-tion by allocating to i t more resources for communal and
industrial activity.
The actual growth rate established by the Plan was 6.5 per cent per annum, but this was not achieved in 1971 or 1972. The
decision now is to aim at communal adjustment first and then at a high growth rate. One often-quoted target is that by 1990, 30 per cent of Malaysia's wealth must be owned by the Malay community, as compared with the 5 per cent they own at present.
Industrialisation in the region is subordinated to the social objectives - for example, any enterprise in Malaysia must have a work force which reflects the structure of the population at all levels, yet managers at middle level are hard to recruit from the Malay community. Industrial location is mainly in Kuala Lumpur, Penang and Johore, but the Government is seeking to persuade entrepreneurs to site factories now in predomi-nantly Malay areas.
Industrialisation began in the early 1960s and the emphasis was then onimport substitution - mainly for consumer goods. When opportunities for this form became fewer, the emphasis
the industrial employment rate remains at only 8 per cent of the total labour force and is a major problem. In 1972, industrial exports accounted for about 10 per cent of total exports.
2.23 Nigeria
In this country the primary objective of the second National Development Plan 1970-74 was to achieve a growth rate of 6.6 per cent per annum, with additional aims of redressing the
balance of income distribution and reducing the foreign control of strategic sectors (mainly industrial and mining). A specific target figure was established for government investment in both private and public sectors and several priorities were esta-blished for agricultural development, transport and manpower development.
Before the above plan expired, a new plan 1973-77 was launched. The main features of this new Plan are:
(a) Import-Substitution
The policy of import-substitution pursued since Independence has earned dividends. It was the main determinant of the high growth
rates recorded in the manufacturing sector.
For a few industrial products like cement, flour and beer, the process is nearly complete. As the country's manufacturing consists mostly of the s~pp1y of goods to final consumers, import-substitution brought in its wake a rise in the importa-tion of raw materials and intermediate and capital goods. The manufacturing sector has thus became highly dependent on import.
(b) Recognising the Problems
The value added as percentage of gross output in most industries remains remarkably low. The exceptions are food, beverages and cement. Imported raw materials are also known to constitute
~ 35
The problem is worse in the -metal production industry where value added is as low as 7%. At present all the stages of metal produc-tion are undertaken abroad except the final stage of metal fabri-cation.
Manufacturing in Nigeria has yet to achieve a high level of inter-dependence between the different sectors. This low linkage has
serious implications for the structure of industry and employment as well as for the level of income and foreign exchange earnings.
To achieve a high level of linkage, local production must be upgraded to embrace intermediate and capital goods for sale to other industries. Nigerian manufacturers still remain a perpetual appendage of foreign industrial complexes.
Another problem facing industrial development in Nigeria is the low level of indigenous ownership and control. This is an un-satisfactory situation which may lead to future undesirable economic and political complications, if not reversed now.
The Government believes that the efforts at attracting foreign investment should proceed simultaneously with the drive for
greater Nigerian participation in production process on mutually beneficial terms. While welcoming foreigners to invest in the
industrial sector, it is now Governments policy that Nigerians must have an effective stake in the ownership and management.
(c) Industrial policy and Objectives
The industrial policy of the Government in the present Development Plan is intended to check the undesirable trends of previous plans and lay a solid foundation for long-term steady growth and
development of the industrial sector.
i promote balanced development and fair distribution of industries in all parts of the country;
(ii) ensure a rapid expansion and diversification of the industrial sector of the economy;
(iii) increase the incomes realised from manufacturing activity; (iv) create more employment opportunities;
( v) promote the establishment of industries which cater for overseas markets in order to earn foreign exchange;
( vi) continue the programme of import-substitution as well as raise the level of intermediate and capital goods pro-duction;
(vii) initiate schemes designed to promote indigenous manpower development in the industrial sector; and
(v.lii) raise the ~roportion of indigenous ownership of industrial investments.
In pursuance of these objectives, the government has the inten-tion to lay down priorities from time to time and initiate positive measures to achieve them. Apart from setting priori-ties in respect of public-sector programmes, the government will also endeavour in its investment promotion to give
guide-lines to private-sector investments in priority areas through appropriate selective incentive measures.
It is clear from the new plan that the authorities recognise only some of the problems facing the country, but failed to establish a clear • strategy' in respect of stimulating invest-ments and regulating the OWnership complexity. Furthermore, no clear policy was formulated towards solving the severe problems of foreign exchange shortage (in spite of important
37
SECTION 3. WHY INDUSTRIALISE?
In the'majority of 'S-year Plans' of a great number of Developing Countries, the following reasons are given for the need of
Industrialisation:
(a) National Prestige (rarely mentioned as such).
(b) The provision of work for the growing population and/or for under-employed rural inhabitants.
(c) The raising of the standard of living.
(d) The improvement of the balance of trade position and/or decreased dependence upon foreign sources of goods and services.
(e) The creation of a progressive (as opposed to a stationary or "stagnant") environment through development of inven-tiveness, technology and modernity of outlook which indus-trialisation brings in its train.
What about the validity of these reasons:
3.1 NATIONAL PRESTIGE
Several countries are cited by Alan Mountjoy(l); Yugoslavia, The Argentine and Egypt. All these had such a reason in the past. Murray Bryce(2) points out that industry is often wanted
"to show the world that manufacturing is not something that can
(1) Alan B. Mount joy: "Industrialisation and Underdeveloped Countries, 11
Hutchinson University Library, 1963, p.G5.
39
be done only by those who have become rich by doing i t in the past." In such cases, industry represents a "higher form of economic activity" and so is regarded as "something more worthy of pursuit by those who aspire to make progress."
However, the sad truth is that the development of 'prestige projects' will strengthen the vested urban interests and give rise to a distortion of the internal price structure, to result in a waste of scarce capital resources (usually in foreign ex-change as well).
3.2 PROVISION OF WORK
Something has already been said about the failure of economic growth to keep pace with rising unemployment. In fact, as Bauer and Yamey in their standard work point out:(l~,the statis-tical relationship between real income and other indices of
development and the proportion of people engaged in manufacturing industry, is not as straightforward as is often suggested."
They cite the USA as having a smaller proportion of the occupied population engaged in manufacture and yet providing a higher figure in real income per head than the U.K. Even up to 1941, the level of employment in manufacture in the USA, was below that of agriculture and yet she has been the richest state for some decades.
Indeed, experience in the 1950s and 1960s has shown that modern-isation of agricultural methods (new varieties and improved seeds, machinery, fertilizers etc.) may well be an effective way of
expanding mass-employment of the rural population.
3.21 Industrial Wages and Unemployment
Industrialisation, with its higher wages., particularly when these increase fast, not only disturbs delicate equilibrium between labour and capital costs, but directly influences' other wage-earning causing an overall-reduction in the labour force and an increase of actual unemployment.
Careful examination of the connection between wage increases and employment in Kenya and Tanzania has revealed some
interesting facts. (1) From 1958 to 1965 the real wages in
Kenya increased by 75% (as against 50% for the national income), while employment decreased by 6% during the same period. In Tanzania, wages rose by 17% from 1961 to 1965 and employment dropped by 6%.
From these facts a model was derived according to which employ-ment falls by 6% per annum for every 15% increase in the
average wage; employment falls by 2.5% when increase in the average wage is 10%: but employment increases by 5% if the increase in the average wage is kept to 5%.
The reason for such unfortunate situations is usually the inability to determine and achieve development goals on one
hand, and the inadequacy of basic political, social and economic choices on the other.
(l)"Employment in Africa, Part 1: Problems and Politics," International Labou:' Organisation, Geneva, see also 0 'Herlihy,
c.
St. J., "capital/labour41
3.3 RAISING THE STANDARD OF LIVING
The more highly developed countries usually have a significant proportion of the employed population working in industry, whereas less developed countries have a much lower one.
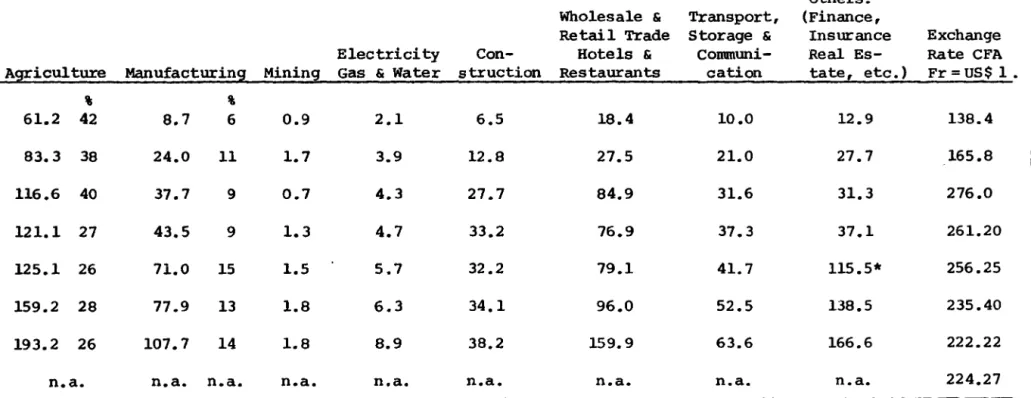
There is a link between the extent of industrialisation and the level of incomes as may be noted from the following table in respect of Ivory Coast, which is, of course, an extreme example.
The average annual increase in CFA Francs between 1960 and
1974 was for the GDP 11.6%, Agriculture 8.0%, Manufacturing -18.3%, Wholesale & Retail Trade) Hotels and Restaurants - 15.5%. Industrial activity in the Ivory Coast is a trail blazer.
The increase in GDP is directly associated with a decreasing proportion of Agricultural contribution and an increasing
TABLE 4:
GDP
1960 142.6
1965 214.0
1970 414.9
1971 439.8
1972 471.8
1973 566.2
1974 739.0
1975 800.0**
Ivory Coast, GDP by Kind of Economic Activity.
(in CFA Fr. billion)
E1ectrici ty Agriculture Manufacturin2 Mining Gas & Water
% %
61.2 42 8.7 6 0.9 2.1
83.3 38 24.0 11 1.7 3.9
116.6 40 37.7 9 0.7 4.3
121.1 27 43.5 9 1.3 4.7
125.1 26 71.0 15 1.5 5.7
159.2 28 77.9 13 1.8 6.3
193.2 26 107.7 14 1.8 8.9
n.a. n.a. n.a. n.a. n.a.
* Extra categories included from this year.
** Estimate
others: Wholesale & Transport, (Finance,
Retail Trade Storage & Insurance Exchange Con- Hotels & Communi- Real Es- Rate CFA struction Restaurants cation tate, etc.) Fr = US$ 1.
6.5 18.4 10.0 12.9 138.4
12.8 27.5 21.0 27.7 165.8 ~
N
27.7 84.9 31.6 31.3 276.0
33.2 76.9 37.3 37.1 261.20
32.2 79.1 41.7 115.5* 256.25
34.1 96.0 52.5 138.5 235.40
38.2 159.9 63.6 166.6 222.22
n.a. n.a. n.a. n.a. 224.27
=---- --- - -- -
--43
TABLE 5: Ivo~ Coast - GDP projections of Economic Activi~ 1980-1985
(in CFA Fr. billions)
Year GDP Agriculture Manufacturing
Fr.Bn. Fr .Bn. % Fr.Bn. %
1974 739 193 26 108 14
1980 1200 250 21 190 16
1985 1600 290 18 '370 23
The conclusion is obvious: Manufacturing enjoys an increasing share of the national GDP while the vast majority of the popula-tion is engaged in agricultural activities.
3.31 Agro-Industrial Linkage
Past industrialisation record reveals that, in the area of agro-industrial linkage, the majority of Developing Countries have been very slow to accord priority to the manufacture of the
inputs needed for modernising agriculture. On the other hand, they have put a great deal of efforts to produce high-cost
consumer goods which have remained beyond the reach of the rural masses.
In the U.N. Monthly Bulletin of Statistics for August 1976 -Abidjan, with its nearly one million inhabitants, and Geneva were cited as the two most expensive cities in the world.
Industrial wage and salary levels have been allowed to rise very much beyond the incomes of the rural poor. The expectation of earning a high ind~strial wage created a vast migration from the
rural areas to the towns. As a result two ~ocieties live in close proximity on totally different staudards of living - the
3. 4 IMPROVEMENT OF THE BALANCE OF TRADE
More often than not, industrialisation policy is put forward in order to boost exports which are expanding at a pace which is
less than adequate to sustain required imports of consumer goods.
When Developing Countries cannot earn enough foreign exchange, there is always a strong argument for building-up manufacturing industry for substitution of imports and stimulating exports on improved terms, particularly when there is a wish for greater economic independence.
until recently the terms of trade for agricultural products seemed, on the long-term, likely to be less favourable to a Developing Country than industrial products would be. However, as Bauer and Yamey(l) consider, the concept is meaningless as "'over any prolonged period ••• the volume and composition of world trade are likely to change so greatly that any particular base (for comparison) loses all significance. 11
True enough, the commodity boom of the last four years has made a significant contribution to the Terms of Trade of some
Developing Countries. To what extent the present trend will be maintained is difficult to predict.
3.41 Import Policies
Developing Countries have been undecided and unclear in their choices of techniques for giving infant industries the stimulus
they undoubtedly need. For several years many countries, with-out much regard for the potential size of their internal markets or capacity for specialisation, tended not only to concentrate their efforts on import substitution strategies, but chose forms of protection that were excessive for their needs.
-45 ..
Barriers composed of tariffs, administrative measures, exchange rates and exchange controls have provided the domestic indus-tries with either exceedingly high, or, in some cases, with
absolute protec~ion.
These barriers have denied domestic producers the stimulus of competition from imports, encouraged inefficiency, raised costs and prices to domestic users and yielded unduly excessive
returns to the owners and managers of the protected enter-prises.
3.42 Export Policies
The same set of policies have prevented other Developed Countries from exporting manufactured goods competitively. In many of the Less Developed Countries (LDCs) the remaining feasible room
for import substitution is now narrowly limited. Both Govern-ments and enterprises are looking more actively to exports, either to the world as a whole, or within the frame-work of c09perative effort at regional economic integration.
Recently, several Less Developed Countries scored successes in exports of manufactured goods. Some of these have been closely keyed to particular rapid growing economies of Deve-loped countries, especially of Japan: e.g. Taiwan, South Korea and The Philippines. Some of the LDC' s depend on the marketing networks of the Developed Countries, particularly for manufactured
components.
However, many Developing Countries have unsuccessful export records, as they have been slow to develop effective market research, selling and promotional skills.
Finally, the Developing Countries have done little about trade and economic cooperation among themselves. The general volume of manufactured goods that Developing Countries import from each
other remains exceedingly low. Several regional economic
integra-tion schemes have faltered or failed, e.g. the East Africa Common
3.5 CREATION OF A PROGRESSIVE ENVIRONMENT(l)
This sociological motive, although not regarded as a decisive one, has been researched by various people who indicated that a planned policy of industrialisation is worthwhile in this
context. (2) Even Australia and Denmark, which are still regarded as predominantly agricultural, have large industrial sectors
and they are progressive and technologically advanced, so they do not form exceptions to the general rule that the 'spin-off' from industrialisation creates the sort of environment which assists a state of progression. (3)
The American Bryce lists eleven elements of strategy found to be most effective in mounting a successful national effort for sound industrial developmenti in fact, a 'Western' plan-ning effort. This approach is contested by Gunnar Myrdal's
Asian work. (4) He regards many past development failures as the products of planning in terms of Western-oriented solutions
which cannot apply to Asian situations. His point is that eco-nomists and planners, bent on industrialisation projects and nurtured in Western traditions, have done a disservice by con-centrating unduly on economic conditions and by believing that the necessary (and desirable) changes in structure will auto-matically follow as per capita income rises.
(1) This type of environment has no relation to issues raised by Western environmentalists, see footnote of 1.2 •
•
(21 See also Jagdish Bhagwati: liThe Economics of Underdeveloped COuntries,"
world University Library, 1966, p.165.
(3)A good deal has been written on this subject but W.W. Rostow, "The Eco-nomics of Take-off into Sustained Growth," Macmillan/St. Martin's Press
1963, has been the main advocate of this thesis •
- 47
-3.6 REALITY AND DIVISION - SUMMING UP NOTE
Industrialisation in the Developing Countries has been unsuccess-ful to date on the employment front. When account is taken of the size of the industrial base, the size of the labour force and the rate of labour force growth in most Developing Countries, it becomes quite clear that in most Developing Countries manu-facturing can directly provide only a modest fraction of the needed gains in employment.
At the same time, industrialisation strategies frequently have failed to realise their employment potentials by neglecting, as noted in 3.3l,to build adequate linkages to agriculture.
One may say that industrialisation has intensified inequalities in many Developing Countries. In fact, inequalities are a matter of countries' basic social and political choices. Despite the importance they accord to re-distribution of income in their statement of development priorities, many Developing Countries have not been very persistent in promoting this objective.
In consequence, industrial developments - have provided high returns to an urban and foreign population (directing the pro-duction of consumer goods to that market and widening the gap between city and countryside) - have accentuated the
inegali-tarian tendencies already inherent to the social and political environment. But in most cases, industrialisation did not by itself create those tendencies.
Nonetheless, a good number of political leaders in the Third World developed an ambivalent attitude to the industrialisation process and are often infatuated with conflictin~ strategies and policies borrowed elsewhere. It is the purpose of this
PART II. PROPOSED INDUSTRIAL PLANNING APPROACH
"0 my soul~ do not aspire to imrrr:;rtal life .. but e:chaust the Zirrrit of the possible. "
49
SECTION 4. SETTING THE SCENE
In 1985 the population on this planet will surpass the 4~ Bn mark. Rather less than l~ Bn will live in the Industrialised Countries. One billion will live in Less Developed Countries
(LDCs) which are now fast industrialising (see 1.4) and the balance of the world population will live in the Developing Countries, i.e. the "Poorest."
The appearance of the LDCs on the world market to compete on the one hand for food, scarce raw materials and, in particular, for energy and on the other hand offering cheaper manufactured products, will most probably create world-wide pressures and structural changes which could be envisaged as follows:
4.1 THE INDUSTRIAL COUNTRIES
The "Richest" countries will shift their manufacturing activities towards much more sophisticated products aided by much higher technology. The high added value of these activities will com-pensate for the higher costs of energy, food and raw materials. In the vast majority of cases the GDP in real terms will be well maintained or might even improve. (1)
(l)This view will probably be contested, in the long run, by Daniel Bell: "Notes on the Post-Industrial Society," Winter & Spring 1967. But other