A DATA COMMUNICATIONS NETWORK
A THESIS
SUBMITTED IN PARTIAL FULFILMENT OF THE REQUIREMENTS FOR THE DEGREE
OF
MASTER OF SCIENCE IN COMPUTER SCIENCE IN THE
UNIVERSITY OF CANTERBURY BY
CLINTON ANDREW LOGAN
he said, "but I don't know how to go about it. What shall/ do ?"
With most terrestrial telecommunication networks experiencing growth the need for powerful computer design tools is becoming mandatory. Such tools facilitate the quick and accurate quantification of many complex technical and economical interactions enabling planners to control the evolution of their networks.
This thesis focuses on several issues surrounding the computer-aided design of a wide area data communications network. Three main topics are addressed: the application of interactive computer graphics to network design tools; the inherent shortcomings of several contemporary design methods; and the application of the tools developed during this study for the evaluation of an existing wide area network.
Network Designers Workshop (NDW), the computer planning tool presented in this thesis has been developed to address some of the main inadequacies found in current day design tools. NDW utilizes high resolution graphics to provide the designer with a highly interactive framework for the rapid prototyping of
communication networks.
In addition, NDW's network synthesis methodology emphasises the importance of adopting an integrated approach to network design by enabling the planner to find a minimum cost solution through a series of iterative designs.
The architecture and facilities of a modern packet switching network are also examined with a special focus on the mechanisms available for the collection of the essential performance data needed for the evaluation and design stage. The final section of this thesis concentrates on the application of the design tools presented in this study for the evaluation and cost driven optimization of a multimillion dollar packet switching network. Finally the impact of nodal cost and access network tariff structures on the optimum cost topology are illustrated.
I have looked forward to writing this page for some time. I can finally
acknowledge the help that people have given me during my three year study. First I want to thank Ray Hunt for the support and continuous encouragement he provided during the course of this study.
My thanks go to Robert Davidson (TNI Ltd) for the valuable discussions we have had over the last two years- pity we did not get the email link up sooner.
I am grateful to Netway Communications for giving me the opportunity to play with something "real" and Lincoln Phelps, the network engineer, for answering a multitude of questions - toward the end he must have been grateful we were separated by several hundred miles of telephone wire.
My Father and Grandmother for proof-reading the manuscript, which resulted in
a slightly less than infinite number of small improvements and clarifications. Special thanks are due to Datacom for the financial assistance of the Battersby Scholarship.
I offer my appreciation for the help and cooperation I have received from the technicians within the department, especially Tony, who sold me coffee at vastly inflated rates when I needed it most.
Thanks to Apple Computer for making the ultimate thesis writing machine: The Macintosh IIci, which made the typing and retyping of the 281,921 characters constituting the final manuscript a pleasure instead of a chore. I wonder how that will sound in ten years time!
The greatest thanks of all however, must go to Nicola for giving me the help, love, and warmth that kept me going throughout my six years at University. I
could not have done it without her.
List of Figures List of Tables
1
IntroductionOutline of the study xiii XV
Motivation 1 Objectives 2 Approach 2 Thesis Contributions 3 Thesis Structure 3
1
SECTION I
COMMUNICATION NETWORKS: AN OVERVIEW
2 Networking Concepts
Network Classification 5 Network type 5 Geographical coverage 6 Transmission technique 6 Network Components 7 Network Topology 8
Distributed mesh topologies 9 Traffic Attributes 1 0
5
SECTION II
DATA COMMUNICATION NETWORK DESIGN
3
The Network Design ProblemThe Design Problem 1 3 Problem Formulation 14 Design input 14 Design output 15 Design constraints 15 Design objective 16 The Design Strategy 1 6
Data collection and analysis phase 17
ix
Operation and management phase 1 8
4
Design MethodologiesPerformance Prediction 19 Performance modelling 19
Analytical performance models 21 Topological Design 23
Centralised network design 24 Distributed network design 24 Node placement techniques 25 Backbone perturbation techniques 26 The need for integrated topological design Network Cost Analysis 29
Network cost elements 29
Concluding Remarks 33
5
Computer-Aided Network DesignCAND: An Overview 34
Brief history 34 Design tool survey 35
Network Design Tools 36
Hughes automated network design system Data pathfinder system 38
Econets 38
Tool Design Issues 39 Ease of use 40
The role of computer graphics 40
Interactive environment 41
Concluding Remarks 41
28
37
SECTION Ill
NETWORK DESIGNERS WORKSHOP
19
34
6 NDW: An Overview 43
Motivation For Construction 43 Design Philosophy 44
User Interface 45
Architectural Overview 47
Graphical user interface layer 47 Network evaluation and design layer 48 Network description layer 48
Modular design 49
Network description 51 Network evaluation 54 Network synthesis 58 Concluding Remarks 62
7
NOW: Implementation DetailsOperating Requirements 63
NOW Synthesis Methodologies 63 Flow assignment 63
Node placement 64 Backbone generation 65 Topology tuning 65
Modifications to the cut-saturation algorithm 67 NOW Verification 69
NOW validation results 70 NOW Design Issues 72
User interface development 72 Software tradeoffs 72
SECTION IV
ANALYSIS Of THE EXISTING NETWORK
8 The Hughes I PN Environment
Network Structure 75 Architectural Overview 77
The Hughes lPN system 77 Network reporting system 79 Data Collection Tools 80
Logfile capture and archival 80 Analysis of the call record logs 81 Analysis of the device statistics logs 81 Concluding Remarks 82
9 Network Workl oa.d Characterization
The Measurement Process 83 Traffic Measurements 84
Traffic intensity 84 Traffic sampling issues 87 Traffic distributions 89
Shortcomings 93
Concluding Remarks 93
xi
63
75
10
Network Design with NDW Design Approach 95Network cost tradeoff 95 The NET-X Design Process 97
Design parameters 97
Design constraints 99
The computer-generated design 99
A comparison of network structures 102 Deficiencies in the existing NET-X design 103 Impact of Design Parameters 104
Nodal cost alteration 1 04 Access network cost alteration Design parameter conclusions
Concluding Remarks 107
11
ConclusionsNetwork Design Tools 109
Future extensions 110
The NET-X Network 110
Design Methods 111
Final Comment 111
Appendices
Telecom Leased Circuit Tariffs 113 Hardware Cost Schedule 116 A Users Guide to NDW 118 Logfile Analysis Reports 142
NET-X Design Transcripts 147
SUPERNET Design 154
105 107
95
109
113
Bibliography 1 56
2.1 Network classification hierarchy 5
2.2 Generalised network structure 7
2.3 Common network topologies 9
2.4 Two level, MCMS topology 9
2.5 Three level, MCMS topology 9
2.6 Two level, MCMD topology 10
3.1 The network design cycle 16
4.1 Transmission link M/M/1 queueing model 22
4.2 Backbone node m-M/D/1 queueing model 23
4.3 Network solution space 28
4.4 Transmission cost trend for Telecom digital links 33
5.1 HANDS 37
6.1 The N DW desktop 46
6.2 NDW system architecture 47
6.3 NDW command hierarchy 50
6.4 Terminal centre definition dialog 51
6.5 Host definition dialog 52
6.6 Geographical display 52
6.7 Logical display 53
6.8 Hardware definition dialog 53
6.9 Network cost monitor 54
6.10 Link cost monitor 54
6.11 Node utilization monitor 54
6.12 Network delay monitor 54
6.13 NDW design adviser schema 55
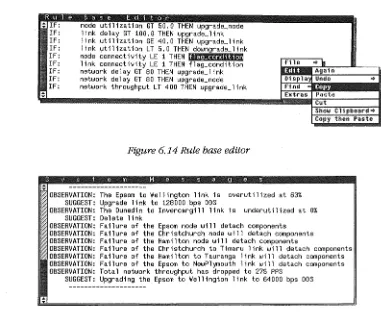
6.14 Rule base editor 56
6.15 System messages window 56
6.16 The NDW design process 59
6.17 NET-X topology tuning trace 61
7.1 Generalized cut-saturation algorithm flow 66
7.2 Typical validation scheme 69
8.2
NET-X logical topology77
8.3
Hughes lPN node architecture78
8.4
lPN network control system79
9.1
Measurement processes83
9.2
Total daily network traffic for the selected week85
9.3
Node traffic profile for an average business day86
9.4
Traffic fluctuations for an average hour87
9.5
Network delay fluctuations caused by changes in arrival pattern88
9.6
Distribution of virtual circuit routes90
9.7
Distribution of virtual circuit path lengths91
9.8
Packet size distribution over backbone links92
10.1
Network cost as a function of nodal dispersion (DDS access links)96
10.2
Network cost as a function of nodal dispersion (ADS access links)96
10.3
Alternative NET-X topology (logical)100
10.4
Alternative NET-X topology (geographical)101
10.5
A comparison of network capacities103
10.6
Effect of design parameters on the optimum number of nodes1 OS
10.7
Minimal cost topology using DDS access links106
10.8
Minimal cost topology using ADS access links106
S.a Design tool landscape 36
7.a Node utilizations 70
7.b Link flows 71
9.a Variation of averaged traffic peaks with measured time frame 88
1 O.a NET-X Subscriber distribution 98
1 O.b Comparison of network designs 102
1 O.c Effects of relocating the Christchurch to Auckland link 104
Can your network accommodate an increased load of twice the present level?
-if so then how much more can it handle? As the load increases which
components will saturate first? How reliable is the network and what are the consequences of this link failing? Is the current network guaranteeing adequate
performance for its users all the time? Is there a more cost-effective way of
engineering the network?
These are but a few of the hundreds of questions network managers must
concern themselves with today. Surprisingly, many network operators address
such problems on a "patch as needed" basis resulting in a network simply evolving with little attention being given to its global structure. Design decisions
are often made without any in-depth analysis of the network, since they are
commonly addressing localized expansions. Such a process seldom results in a
cost-effective structure.
With most terrestrial telecommunications networks experiencing growth the need
for powerful design tools is becoming ever more apparent. Network managers
must analyze a vast range of technical and economic issues and be able to
quantify the impacts of the complex interactions between them. Multiple
tradeoffs must be evaluated for different network expansion or design
alternatives to guarantee successful migrations to future cost-effective
configurations.
OUTLINE OF THE STUDY
This thesis is concerned primarily with the development and subsequent use of
computer based tools for the analysis and design of packet based communication networks. This study illustrates how a structured design strategy is essential for
the successful management of any network system and offers the potential to provide significant cost savings.
MOTIVATION
The NET-X packet switching network is a privately owned system that provides a
data communications service to a large number of customers within New
Zealand. NET-X is one of the two main packet switching networks in New
rapid expansion, the evaluation of the network's current design and performance
was of critical importance.
After an initial two week investigation of the NET -X environment it was
discovered that there was a complete lack of any analysis or planning tools. The
network's management system did have comprehensive monitoring facilities that
collected information on each component, however there were no true analysis tools for evaluating and summarising network performance over an extended
period of time.
In addition to the development of the data collection and analysis tools some
form of network design tool was needed. A literature review was conducted to
gain an understanding of the current state of play in the network design tool
arena. It was discovered that although there were a tremendous number and
variety of design packages available, the vast majority were lacking in several key
areas.
Thus, the primary motivation for this study was this industry need for improved
computer-aided design tools that would enable the planning and dimensioning
of wide area data communication networks.
OBJECTIVES
This study was initiated with two primary goals in
mind-• First, to highlight deficiencies in contemporary design tools and to develop a
"network designer's workshop" of design capabilities that would support the
planning of complex communication networks. Such a tool would provide a
visual
exploratorium
for the rapid evaluation and synthesis of cost-effectivenetwork designs. This approach can be realised with current computer hardware;
high speed workstations with large high-resolution displays, dedicated
processors, and sizable amounts of virtual memory to support the levels of
interactivity required by such a tool.
Network Designers Workshop (NDW), the computer-aided planning tool
presented in this thesis, addresses several shortcomings present in existing tools.
• The second goal was to illustrate the utility of NDW in the evaluation of
network designs by assessing the current NET-X structure and to orientate its
configuration toward a target network optimized with respect to the cost
tradeoffs and performance goals.
APPROACH
In order to achieve these goals the following multi-phased approach was
adopted:
• Data collection and analysis-
The development of an accurate picture of thecollection tools were developed to enable the off-line analysis of the traffic
statistics maintained by the network management system. These analysis tools provided the network operators with a previously unavailable window into the
operational state of their network.
• Design tool development- The second and longest phase involved the design and development of Network Designers Workshop, a graphically orientated
network design environment.
• Network evaluation and design- The third and final phase involved the coupling of NDW with the data obtained from the workload characterization step
to evaluate the current NET-X design.
THESIS CONTRIBUTIONS
The primary contributions of this thesis are (1) NDW a network design tool
prototype; (2) Insight into the current state and design deficiencies of a
communications network; and (3) the proposal of an alternative NET-X structure
that exhibits an 18% increase in traffic carrying capacity with an annual cost
saving of $84,427.
Secondary contributions of this research include some insight gained into several
aspects of the network design problem. The optimisation approach adopted by NDW illustrates the need for integrated design methodologies; Several inherent
shortcomings of a classical design heuristic are highlighted and improvements to
it proposed; Finally the impact of several design parameters on the optimum cost topology are illustrated.
THESIS STRUCTURE
This thesis is organized as follows
-Chapter Two provides a brief introduction to communication networks. It covers the main concepts that arise within this work and includes a brief look at several
topological structures.
Chapters Tbree, Four and Five constitute Section II of this thesis and collectively
provide an overview of communication network design. Chapter Tbree
introduces the network design problem, including a formal description and
finally formulates the global design strategy adopted by this study. Chapter Four
presents the design methodologies used in this study and highlights some of their
inherent deficiencies. The field of Computer-Aided Network Design (CAND) is discussed in Chapter Five. Several 'state-of the-art' tools are presented.
Section III presents Network Designers Workshop (NDW) the design tool
developed during the course of this study. Chapter Six introduces NDW and
provides an overview of the tool- including its design philosophy, architecture
presented in Chapter Seven, including a closer look at its internal design algorithms, and verification of the tool based on network measurement data. The analysis of the NET-X packet switching network is covered in Section IV. A description of the Hughes Integrated Packet Network (IPN) environment is provided by Chapter Eight. The current NET-X configuration is examined, including its topology, subscribers, and network monitoring facilities. Chapter eight concludes with a look at the data collection and analysis tools developed during this study.
Chapter Nine discusses how the measurement tools were employed to evaluate several aspects of NET-X's operational state. The results of this analysis are presented along with several issues surrounding the workload characterization phase.
Chapter Ten concentrates on the cost driven optimization of the NET-X structure using the traffic measurements and NDW. The impact of several design
parameters on the optimized structure are also illustrated in the latter sections of this chapter.
SECTION
I
COMMUNICATION NETWORKS: AN OVERVIEW
Let no one enter who does not know geometry
Whenever two or more entities are connected to exchange information, a
network is formed. This chapter serves as an introduction to networks and
discusses the main concepts that arise in this study.
NETWORK CLASS/FICA TION
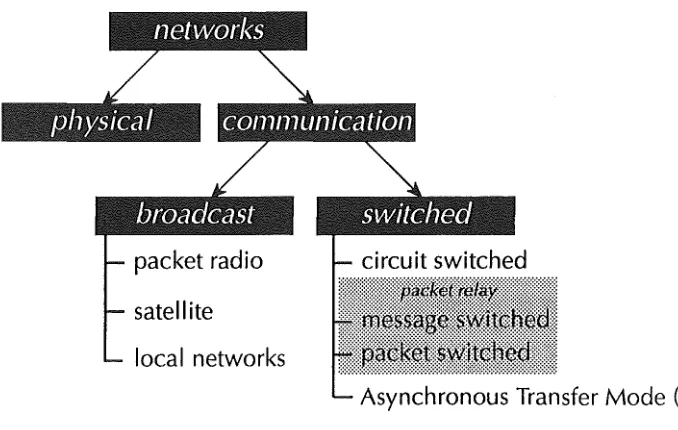
Broadly speaking, networks can be classified by several attributes. These attributes can be grouped according to the network classification tree detailed
in figure 2.1.
satellite
local networks
[image:23.597.89.428.384.599.2]Asynchronous Transfer Mode (ATM)
Figure 2.1 Network classification hierarchy
NETWORK TYPE
Networks can be divided into two broad types: Physical networks and
Communication networks. Physical networks are designed for the transport of
physical items such as water, boxes etc. Communication networks are designed
The techniques used for the design and modelling of physical and
communication networks are very similar, however the nomenclature used is quite different [27].
GEOGRAPHICAL COVERAGE
Networks range in size from small Local Area Networks (LAN) which connect
several computers within a single building, to medium sized systems that
interconnect computers within a metropolitan area or city (MAN), to large geographically distributed Wide Area Networks (WAN) covering entire
countries and even spanning the globe.
TRANSMISSION TECHNIQUE
Data communication networks can also be classified according to the type of transmission technique they employ. Two types are in common use
-Switched communication and Broadcast communication networks.
Switched communication networks
Networks that provide communication between all users fall into the category
of switched networks. Three classes of switched networks exist:
• Circuit switched networks- provide services by establishing a dedicated communication path between the two users for the duration of the call (e.g.
Public Service Telephone Network).
• Packet relay networks- forward logical units of data from source to destination. Packet relay networks discard the need for a dedicated channel
between the source and destination. Rather, if a subscriber wants to send data,
it is passed from node to node until the destination is reached. At each node
the data units are queued along with other data and then forwarded. Message
switched and packet switched networks represent the two fundamental types of packet relay networks in .operation today. Packet switching is very similar to message switching, the principle difference being the length of the data units.
• Cell relay networks- have recently emerged to accommodate the requirements for fast, large scale data transfer. One term that describes cell
relay technologies is Asynchronous Transfer Mode (ATM). ATM uses small packets (known as cells) which are switched through the network. Cells have a
fixed size of 48 bytes with a 5 byte header. The use of fixed length cells allows
the simplification of the transfer protocol and switching hardware and therefore greatly increasing throughput. ATM is the primary mode of data transfer for
broadband ISDN.
This thesis deals with the analysis, design and modelling of packet relay
Broadcast networks
Broadcasting offers the main alternative to switched communication networks.
In a broadcast network a source will transmit information to a large number of subscribers over a shared transmission medium. The message is received by all
subscribers, but only the intended recipient will accept and process the
message. Broadcasting is the main transmission technique employed by local
area networks.
Several design tools for broadcast networks can be found in the literature
[3, 70], however they are beyond the scope of this study.
NETWORK COMPONENTS
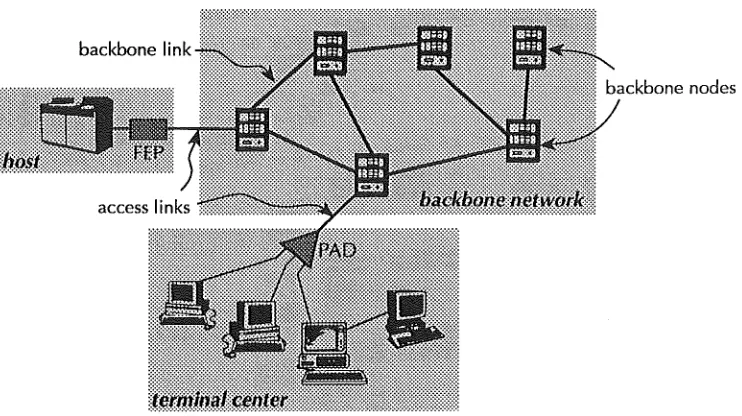
An abstract model of a wide area data communications network, including its major components, is portrayed in figure 2.2. This model is characteristic of the
thousands of packet based networks in operation today.
[image:25.595.90.461.339.547.2]backbone link •
Figure 2.2 Generalised network structure
The primary function of any network is to connect a number of geographically
distributed subscribers enabling them to communicate and share resources.
Terminal centres and Host computers act as sources and sinks for data traffic and are collectively termed subscribers within this thesis. A terminal centre
consists of a cluster of terminals connected by some form of terminal
concentrator (i.e. PAD, MUX etc). Host computers are generally directly connected by way of a Front End Processor (PEP) to a backbone node. A
subscriber is connected to a backbone node by way of a dedicated or dial-up
access link.
Communication networks can be viewed as a two level hierarchical
structure-the lower level consisting of structure-the subscriber access network and structure-the upper level
system of switches or nodes interconnected by backbone links and is primarily responsible for the transportation of the subscriber traffic to its destination.
Backbone nodes or switches are specialised computers that are used to connect two or more links together. Their primary function is to process incoming data
and route it over the outgoing links. Nodes are also responsible for handling
various other tasks such as flow control, buffering and protocol enforcement.
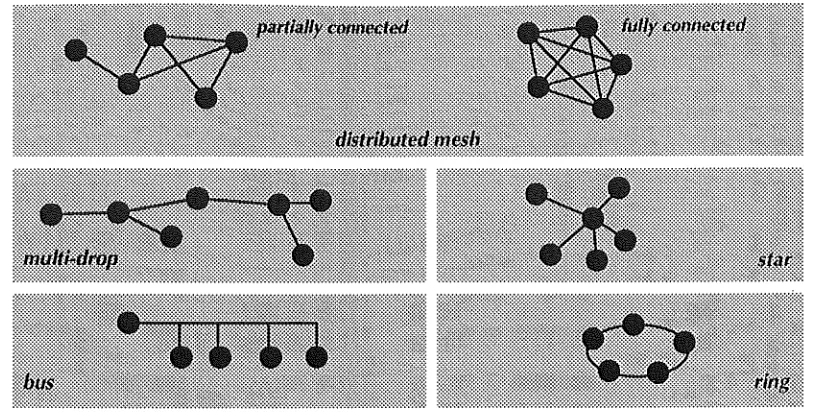
NETWORK TOPOLOGY
One of the most important design considerations is how the network components should be connected. The network topology describes the
interconnection patterns of these components.
The choice of topology is to some extent dependent on the user application. If
the network is expected to share data between many pairs of widely dispersed
subscribers then the least cost topology will be an irregular meshed structure
(like those in figures 2.4, 2.5 and 2.6). If however, the data is shared between a
central site (which could be a node, host, or terminal concentrator) then the
optimal structure can be found u~ing methods developed for centralised
topologies [30].
This section attempts to classify some of the more notable topological
structures. Some elementary topologies that have proven useful for data
communication networks include:
• Distributed mesh topology- can be either fully or partially connected. In a fully connected distributed mesh every node is connected to every other
node. Fully connected meshes offer high reliability, although the cost of the
system grows with the square of the number of nodes.
• Minimal spanning tree or multidrop topology- consists of a master node or root with branches radiating from it. These branches may in turn have
sub-branches. MST/MD topologies are used when all communication is bound
for a single destination, and are frequently employed for subscriber access
topologies.
• Star Topology- all nodes are connected via point to point links to a central site.
• Bus topology- nodes are connected byway of short drops to a shared broadcast link. Bus topologies are employed by local area broadcast
networks.
Figure 2.3 Common network topologies
Other structures can be obtained by combining the topologies in figure 2.3.
Sharma [82] provides a good discussion on the topologies covered in this
section.
DISTRIBUTED MESH TOPOLOGIES
This thesis concentrates on the topological design of a wide area network
where demands can arise between any two nodes. Distributed mesh structures
offer a cost effective means of connecting those nodes. The economical design
of such topologies however, requires the detailed knowledge of traffic flows
among all subscribers [82].
Distributed mesh structures can be divided into roughly two generic categories:
Multicentre multistar (MCMS) topology
A multicenter multistar (MCMS) topology is a hierarchical structure that consists of several nodes that individually serve a subset of the subscriber
population (see figures 2.4 and 2.5). The subscribers are connected to the
closest backbone switch using a star configuration.
Figure2.4 Figure 2.5
The NET-X packet switching network discussed in Section IV employs a two level MCMS topology.
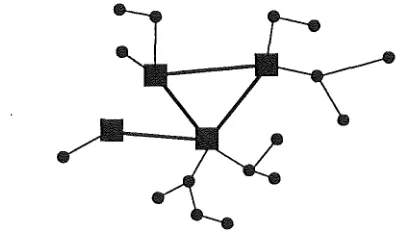
Multicenter multidrop (MCMD) topology
A multicentre multidrop (MCMD) topology is a hierarchical network that can be used to serve many subscribers over a large geographical area.
[image:28.597.193.392.224.343.2]Figure 2.6 illustrates a typical MCMD structure with four backbone switches. The subscribers are interconnected using shared multidrop access links.
Figure 2.6 Two Level, MCMD Topology.
Large complex communication networks typically consist of a combination of the topological structures discussed in this section.
TRAFFIC ATTRIBUTES
Communication networks are characterized by flows of discrete data units from
one subscriber to another. Several attributes that characterize packet based
network traffic are enumerated in the following paragraphs.
Traffic unit
Although many measures of traffic unit exist (e.g. bits, bytes, frames, messages,
transactions etc), the packet represents the fundamental traffic unit for network
design. A data packet consists of a variable length user information segment
encapsulated by a fixed length header.
Traffic intensity
Traffic intensity is· a term used to describe the data traffic load on a network component. Traffic intensity can be defined as the traffic arrival rate per unit
time and is denoted by the symbol
'A.
Traffic intensity is normally expressed inPackets Per Second (PPS).
Traffic delay
• Transit delay- is the time that elapses from when a packet enters a component until it exits. The transit delay imposed by nodes and links are characterized by the sum of their queueing and service times.
• Average network delay- is the average time it takes for a data packet to travel from its source to destination nodes. The designer must be aware of the
dangers associated with sizing networks using this measure. An acceptable average network delay does not always guarantee acceptable end-to-end
delays for all node pairs [77].
• Response time- The user response time can be defined as the time that elapses from when the operator sitting at a terminal completes the last action
associated with a command until the first character of the host's response is
received. Any definition of response time that is applicable to network design
should eliminate host turn around delays, which effectively reduces it to the network transit delay.
Methods for calculating traffic delays are discussed in Chapter four.
Traffic
throughput
An efficient design ensures a high traffic throughput for a given network cost and traffic delay. The throughput of a system is defined as its total traffic
carrying capacity per unit time.
The following three measures of throughput are of interest to the network designer:
• Communication link throughput- Transmission link capacities are rated in bits per second (bps). Recommendation X.135 defines the link throughput to
be the number of user data bits successfully transferred in one direction over that connection per unit time. To determine the throughput of a link,
communications protocol overhead must be taken into account. Thus the
maximum achievable throughput of a link is always less than its transmission
rate.
The maximum theoretical throughputl of an X.25link is given by [37]:
link throughput
= [
8(8:D)] PPS (2.1)where S = link speed in bps and D = user data packet length in bytes.
• Nodal throughput- Whilst communication link capacities are well defined and the corresponding throughputs can be calculated, the calculation of nodal
throughput is much less certain. In virtually all cases,. throughput calculations are dependent on the manufacturers own capacity ratings. Nodal capacity ratings are specified in terms of Packets Per Second (PPS), however manufacturers normally do not supply any information on how general protocol overhead should be taken into account. The difference between the actual data packet processing capability and the manufacturers rated
throughput of a node is dependent on the internal implementation and can vary quite considerably.
• Network throughput- For a given average network delay, the total network
SECTION
II
DATA COMMUNICATION NETWORK DESIGN
When a lot of remedies are suggested for a disease, that means it can't be cured
Anton Chekhov
The design of data communication networks in its general form has prompted a tremendous amount of research interest, resulting in a wide range of approaches to the problem. Some of these approaches simplify the real world case, so
established optimization techniques can be applied [30], whereas others
artificially restrict the solution space in order to decrease the search time [31]. The most effective methods to date employ heuristic procedures to arrive at a close to optimum structure in an acceptable time.
This chapter provides an introduction to the Network Design Problem (NDP) and is organised into three major sections - (1) The design problem introduces the NDP in its general form; (2) The problem formulation provides a more rigourous definition of the NDP; and (3) The design strategy, details the global design strategy adopted by this study.
THE DESIGN PROBLEM
The predominant goal in the design and maintenance of a communications network is to provide a cost-effectivel structure that meets several key criteria. Those criteria are generally accepted to be:
• High throughput-The network should have the capacity to absorb traffic
fluctuations and serve the growing requirements of subscribers without any degradation of service quality.
• Short transmission delays-Traffic should be transferred from source to
destination in the minimum possible time, thus ensuring acceptable response time for its users.
• High levels of reliability-Network subscribers should be able to communicate
even if network components fail.
• High levels of extendibility-The topology should facilitate the graceful
introduction of new nodes and backbone links without the need for significant redesign of the existing structure.
The design of a cost-effective distributed data communications network represents a formidable combinatorial problem. Such problems epitomise the characteristics and general difficulties of the NDP as the number of possible solutions is sufficiently vast to prohibit the exhaustive search for an answer.
For example, having selected the geographic locations for
n
backbone nodes, we can then connect them using m backbone links. The total number of possible designs to consider is determined by [26]:[ n ( n-
1) 121 I(3. 1)
[ n ( n -
1)12-m
1
1m!
NET-X has values of n = 16 and m = 22, so there exist 6.313 x 10²³ possible topologies. Given Network Designers Workshop can evaluate a topology in lOOms, an exhaustive search for the locally optimum topology2 would take 2029
trillion years!3. To make things worse, Frank's analysis ignores the fact that the determination of the globally optimum topology also depends on the selection of the node locations - If there are 5 subscribers in a network, then the optimal
number of backbone nodes
q
will lie somewhere in the range 1 ::;q
~ 5.To determine the optimum network configuration successive values of
n
must be tried untiln
=q
is reached. Each iteration will involve the evaluation of every possible set of inter-nodal connections given by formula 3.1!This phenomenon is termed a combinatorial explosion. To combat problems of this nature, a class of algorithms called heuristics need to be applied.
Fortunately several design heuristics have been developed to significantly reduce the time needed to find a solution. The tradeoff however, is that the heuristic no longer guarantees to find the 'best' solution. A discussion of network design design heuristics can be found in the following chapter.
PROBLEM FORMULATION
In its most general sense, the network design problem corresponds to many different choices in performance measures, design variables and constraints [30]. Many formulations can be found in the literature; the following has been
adopted:
DESIGN INPUT
The input to the network design problem consists of the following:
• Tbe number and location of the network subscribers-The positions of the network subscribers (xi,Yi) i= 1 ,2 .. s can be described using any valid set of two dimensional coordinates (e.g. the V and H coordinate system, latitude and longitude etc).
• Tbe traffic requirement between subscriber pairs-the traffic requirements are
represented by a traffic matrix of the form TM
=
(TRsrc,dest) src,dest = 1,2 .. swhere TRsrc,dest represents the traffic intensity originating at src and terminating at dest.
• Tbe transmission link cost tariffs-The transmission link alternatives (e.g.
ADS, DDS, Megalink etc.) and their corresponding cost structures.
• Tbe hardware cost profiles-The hardware alternatives available for the final
solution and an accurate mechanism for evaluating their cost.
• Message profiles-Knowledge of the average length and distributions of all
data and control messages flowing within the network.
DESIGN OUTPUT
Output from the network design problem will provide the following:
• Tbe optimum number of backbone nodes-The optimum number
q
where1 ::::;
q ;::::
s. s=
number of network subscribers.• Tbe optimum locations for the backbone nodes-the positions of the q
backbone nodes that minimise the tradeoff between subscriber access and backbone link costs.
• The backbone connection topology-the most cost-effective interconnection
pattern joining the nodes using the most suitable link types (e.g. DDS, ADS etc.) and capacities.
• Node dimensioning-the optimum number of processing modules4 as a
function of the nodal traffic handling requirements.
• Miscellaneous empirical information-network costs, utilization, delays etc.
DESIGN CONSTRAINTS
The solution to the network design problem is to be achieved subject to many different constraints including:
• The maximum average packet delay through the network;
• The total network throughput at the maximum network delay;
• The maximum average delay on any network link;
• Network reliability5.
DESIGN OBJECTIVE
The primary objective of the network design problem is to find the least cost topology that satisfies a specified set of design constraints. The NDP however is not necessarily limited to finding the least cost structure, other objectives may include:
• The maximum throughput topology [19].
• The maximum reliability topology [34, 49].
• The minimum mean delay topology [33].
THE DESIGN STRATEGY
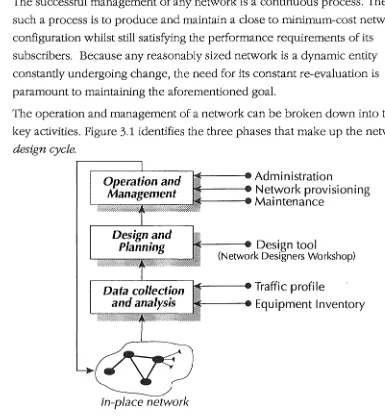
The successful management of any network is a continuous process. The goal of such a process is to produce and maintain a close to minimum-cost network configuration whilst still satisfying the performance requirements of its subscribers. Because any reasonably sized network is a dynamic entity constantly undergoing change, the need for its constant re-evaluation is paramount to maintaining the aforementioned goal.
The operation and management of a network can be broken down into three key activities. Figure 3.1 identifies the three phases that make up the network design cycle.
r--=----:-:----:-~---• Administration
Rilif---e Network provisioning
~g;;g;;Bj:;I'Bg;;g;;dr---. Maintenance
~----e Traffic profile
J!illf----e Equipment Inventory '--sJs~~~dfl
[image:36.597.67.452.284.702.2]In-place network
Figure 3.1 The network design cycle
This process will involve the coordination of several departments and logically starts at the data collection and analysis phase. The cycle then proceeds (using the data from the first step) through the design and planning stage and on to the operation and management stage. The final phase uses the insight gained by the design stage to improve on the existing network configuration.
This cyclic process of network management is representative of the planning strategy adopted by many organisations today [10, 91, 97].
The following sections discuss the three phases in more detail.
DATA COLLECTION AND ANALYSIS PHASE
The data collection and analysis of the existing network represents a fundamentally important step of the design process.
The network management facilities that exist on modern systems provide
detailed statistics on network activity (i.e. traffic volumes, Community Of Interest (COl) data6, nodal utilizations etc). This information is vital for evaluating the network's ability to meet service and utilization objectives and is also used to highlight potential trouble spots where corrective planning action may be necessary. The data gained by this phase provides vital input to the design and planning phase.
Section IV discusses the data collection and analysis phase of this study.
DESIGN AND PLANNING PHASE
The goal of the design and planning phase is to develop a cost-effective network configuration that provides the desired level of performance. This new
configuration will either provide a basis for network expansion or verification of the present network. "Tbe key to accurate network engineering is the ability to feed network statistics and COl data, as well as forecast growth, into an
interactive network design program containing the characteristics of the network components" [10].
The designer, armed with the data gathered in the first phase, uses a computer-aided design tool to postulate "what if'' scenarios. The designer can experiment by moving nodes and links and quickly observe the resulting shifts in traffic distributions. Components can be deleted to simulate failure conditions and the loads due to alternate routing can be identified to ensure sufficient capacity on the secondary traffic paths. Good tools can be used to synthesize new low cost topologies or to plan the expansion of a current network. A tool that allows the designer to experiment with such hypothetical scenarios is essential for the successful management of any network.
The use of Network Designers Workshop (NDW) for the execution of the design and planning phase is covered in Chapter ten.
OPERA TJON AND MANAGEMENT PHASE
The third phase of the design cycle is responsible for the acceptance and execution of the results gained from the design phase. This step includes tasks such as equipment acquisition, installation, maintenance and general
administration of the network.
The insight gained by this study has resulted in several improvements? to the existing NET-X topology.
Data communication networks of any sort, are the product of practical
engineering design. These networks exhibit a tremendous variation in structure
and represent a considerable financial investment by their owners.
The desire to configure these networks so costs are minimized, and yet still meet
the design criteria, is an entirely reasonable one. A cost decrease of just 5% on a
network costing $160,000 per month represents a monthly saving of $8000. This
saving would easily justify a considerable amount of effort in the design stage.
This chapter provides an overview and discussion of the main design
methodologies available to the network engineer with an emphasis on those
used in this study. Network design methods can be split into three key design
activities; performance prediction, topological design and network cost analysis.
PERFORMANCE PREDICTION
The performance evaluation of network components, typically backbone nodes,
switches, PADs etc., forms an essential part of the network design process.
Unfortunately the analysis of measurement data 1 can only provide insight into
the state of an existing network. To evaluate the performance of planned
networks predictive techniques are necessary.
PERFORMANCE MODELLING
The task of performance modelling involves the representation of a real world
system in terms of some abstract quantity. Network models must be constructed
in order to reflect the performance characteristics between proposed network
configurations.
Performance evaluation methods were greatly enhanced by Kleinrock's work in
the delay analysis of packet switching networks [53, 54] and over the last two decades a tremendous amount of research effort has been dedicated to the
performance evaluation of computer networks.
Three primary methods for forecasting the performance of data communication
networks exist, namely:
• Physical models- require the availability of the actual system under study. Tests are performed using artificial loads to obtain performance statistics. Physical
models represent the most expensive and time consuming approach.
• Simulation models- involve the software emulation of the network components and processes. A simulation model describes the dynamic
behaviour of the system. Network objects (i.e. packets) and their corresponding sequences of activity (i.e. packet flows) are directly represented through software
event procedures. Simulation models permit the representation of a system at an essentially unlimited level of detail and generally are employed for the more
detailed examination of system behaviour (e.g. protocol performance evaluation,
buffer utilization etc.)
One of the primary drawbacks of simulation is the cost involved in constructing and running the model. Simulations represent a significant programming task and
require considerable amounts of computer resources to execute.
• Analytical models- are a mathematical representation of the real world
system. Analytical models are a group of solution techniques that describe the
functional relationship between system parameters (e.g. traffic arrival rates,
processing capacities etc.) and a chosen performance criterion (e.g. utilizations, delays etc.). Because of their applicability to this study, analytical methods are
discussed in further detail in the following section.
Several tutorials exist which bear on the subject of network performance
modelling; the more notable ones include Reiser [74], Tobagi et al. [93], and Inose [46].
Selecting a modelling technique
There are several considerations that must be made before a modelling technique
is adopted. The selection is partially based on the required results and partially on the available tools2.
One of the key considerations is the desired level of modelling accuracy. Both
simulation and analytical approaches involve the abstract representation of the
system under study. In general, analytical methods require a much higher level of
abstraction than simulation. Simulations are not bound by the same assumptions
that are necessary to make analytical expressions mathematically tractable,
consequently more accurate results can be expected.
As previously mentioned, this additional gain in accuracy is made at the expense
of a more costly model to develop and run. This extra cost may not always be
justified or desirable. In the case of Network Designers Workshop, the objective
to provide high levels of interaction ruled out the use of simulation techniques.
Kobayashi points out that "An analytic model should be sought wherever possible, since it can evaluate the performance with minimal efforts and costs over a wide range of choices in the system parameters and configurations" [55].
Simulation models have primarily been used in cases where analytical models
have not or cannot be derived. Simulation, despite its performance drawbacks, still represents a powerful class of tools for the design and performance analysis
of computer networks [4, 45].
This study has adopted analytical modelling techniques, since they provide a
fast3 and proven method for the performance prediction of packet relay
networks. The analytical models implemented by NDW are discussed in the
following section.
ANALYTICAL PERFORMANCE MODELS
Among the number of mathematical disciplines that are pertinent to analytical
modelling, queueing theory plays the most important role. We can visualize a
computer network as a multiple resource system, where the resources are the
network nodes, transmission links, PADs etc. Network traffic demand services
from these resources, and as a consequence, most performance problems are
related to the queueing delays experienced from the contention for these
resources.
The performance models adopted by this thesis are based on the work done by Kleinrock [54], and Ng [69]. These models are based on an open network of queues. They are open because all sources generate new packets and all arrivals
are assumed to be accepted by the network without any flow control. Open
queueing models are accurate for light to medium loads where flow control
mechanisms have little or no effect on performance. When loads increase
however, the open model overestimates network delays.
In practice most packet relay networks implement sliding window protocols for flow control. The use of closed queueing network models for the analysis of flow controlled networks has been advocated by Schwartz [79], Reiser [75] and others.
Although closed queueing models enable more accurate modelling of flow
controlled networks, they suffer from the drawback of requiring a greatly
increased amount of computational time, space, and complexity for calculating
_Qetwork performance measures4.
fhus, the following open queueing models have been adopted by this study and
are dependent on the following assumptions [54]:
3 In terms of programmer time required to implement the model and computer resources needed to run the model.
• The traffic arrivals form a Poisson process; • The packet lengthS is exponentially distributed6;
• Each queue works on a First Come First Served (PCPS) discipline; • The arrival processes are independent at every switch;
• Every switch has infinite buffer space.
Transmission link model
A full-duplex communication link is responsible for the transmission of data packets. In such a process the transmission (or service) time will be linearly proportional to the packet length. Thus a full-duplex link can be successfully modelled by the M/M/1 queue detailed in figure 4.1.
---.• Ill
Figure 4.1 Transmission link M/M/1 queueing model
The total delay (TJink) imposed by a transmission link can be determined by:
TJink
Where
1
-=Average packet size (in bits).
J1
C =Capacity of the link (in bps).
1
+PO
pC-A-A
= Mean packet arrival rate for a link (in PPS).PO= Link propagation delay (in sec).
Backbone node model
The increasing demand for packet switching networks has spurred the development of a second generation of packet switching nodes which are characterised by their highly modular architectures7. Nodes consist of several
5 Equivalent to the service process.
(4.1)
6 Figure 9.8 and its subsequent discussion in Chapter nine illustrate the correlation between this assumption and actual network measurements.
Packet Switching Clusters (PSC) interconnected by a high-speed internal bus or ring (refer to figure 8.3).
When a packet arrives at a PSC it is buffered, processed, and passed on. Each PSC contains buffer space and processing units and acts independently of the others. Thus there exists several parallel packet queues within each node.
It is reasonable to expect that the PSC service time should be independent of the packet length (i.e. deterministic), because the operation of each PSC involves the inspection of a fixed-length packet header and the re-routing of that packet [24]. A PSC can therefore be effectively modelled as an M/D/1 queue. A node
consisting of m PSCs and a total traffic arrival rate of
At
is modelled by the m-M/D/1 queueing structure in figure 4.2.At,----/ ____..m
JI[J--+~
incoming
li_nk_s____.~At---+----'~ JID---:l~
outgoing links
Figure 4.2 Backbone node m-M/D/1 queueing model
The total delay (Tn) imposed by a packet switching node can be determined by:
2fl
-A
2fl (fl -A) +SO
(4.2)
Where
fl =Mean service rate for a PSC (in PPS).
A
=Mean packet arrival rate for a PSC, i.e.At
from figure 4.2 (in PPS).m
SO= Load independent serial processing delay (in sec).
TOPOLOGICAL DESIGN
The determination of a cost-effective topology is one of the most important and difficult design activities facing the network engineer. The process of developing a new topology or the reconfiguration of an existing one represents a tradeoff between the cost and performance quality of the resultant network.
A number of topological design methods have been developed over the last decade. These methods can be divided roughly into two groups, each
The choice of topology depends, among other things, on the assumed traffic patterns. If the network is to serve as a data exchange between geographically distributed nodes, then a cost-effective structure can be determined using the methods for distributed network design. If however the network traffic is routed to a single switching centre then centralised structures become more applicable.
CENTRALISED NETWORK DESIGN
Considerable research effort has been spent on the development of centralised network design methodologies, and a vast number of papers are now available [7, 21, 67]. Most are based, in some way or another, on tree structures. One of the most effective8 can be attributed to Esau and Williams [22].
Essentially the Esau-Williams algorithm searches for the nodes that are the furthest9 from the central node and connects them to the adjacent nodes that provide the greatest cost saving.
Schwartz [78] and Sharma [81] provide a good coverage of centralised network design algorithms.
DISTRIBUTED NETWORK DESIGN
The topological design of distributed networks is substantially different and far more complicated than centralised structures, and not surprisingly fewer algorithms exist for its solution.
The design of distributed networks was first discussed by Frank et al. in 1970 [28]
and since then a number of methods have been developed. In a broad sense, the techniques employed to solve the distributed design problem can be categorised into two main groups namely:
• Mathematical methods- A collection of mathematical techniques known as
linear programming have been applied to many areas of problem solving including the NDP. Linear programming methods minimise (or maximise) an objective function (i.e. cost) subject to a system of equations (i.e. constraints). The formulation of the NDP as a programming problem necessitates several assumptions that are not very representative of the real world case.
The practical constraints imposed by a real network (e.g. discrete non linear link costs etc.) further increase the combinatorial character of the NDP, making an exact mathematical solution virtually impossible to attain. The only realistic option for addressing the NDP is through the use of heuristic methods.
8 Chandly and Russell [99] report that the Esau-Williams method produced solutions that were within 5% of the optimum.
• Heuristic methods-Heuristic methods are a class of network design algorithms that try to overcome some of the unrealistic assumptions set by the mathematical methods. Typically, these methods start with a given topology and converge on a solution that is 'fairly close' to the optimum.
Heuristics have been developed to attack the NDP as a series of isolated
subproblems - the access problem and the backbone design problem. The
access problem consists of the determination of backbone node locations and the generation of the subscriber access network. The backbone design problem addresses the development of low cost backbone configurations.
The subsequent sections discuss the heuristic methods employed by this study in more detail.
NODE PLACEMENT TECHNIQUES
In any network that consists of a large number of geographically dispersed subscribers, the strategy for grouping and accessing the network will play a predominant part in determining the total cost of the network. Not surprisingly researchers have worked extensively on the access problem. Some methods are based on clustering techniques [67] whilst others are predominantly driven by cost.
Two effective heuristics in the latter category are the well known ADD and DROP methods. The ADD algorithm was introduced by Kuehn and Hamburger [59] and represents one of the most successful methods to date.
The ADD method works as follows:
T Tentatively place a node at an unserviced location.
" Generate the subscriber access network.
" Evaluate the cost saving realised by placing the node at that location.
" Repeat this procedure for all unserviced locations.
" Place a node at the location that results in the greatest cost saving.
T Repeat the entire process until no more cost savings can be made.
The DROP method [23] essentially reverses the ADD algorithm, whereby nodes are assumed to be at all possible locations. The procedure then eliminates the nodes that result in the greatest cost reduction.
BACKBONE PERTURBATION TECHNIQUES
Backbone perturbation techniques form an important class of topological design heuristic. These methods attempt to improve an existing backbone structure by sequentially altering (or perturbing) small sections of its topology. If the cost of the modified network is lower and it still satisfies the performance constraints it
is accepted and the perturbations are continued on the new structure. Therefore, this class of method search locally around a given topology for a lower cost structure that still fulfils the specified performance constraints.
At present there exists no efficient technique for the exact solution of the
backbone design problem, although two predominant perturbation methods have been developed; The Branch eXChange (BXC) and Generalised Cut-Saturation (GCS) methods.
The Branch exchange method
The BXC method was one of the first perturbation methods to be developed and is discussed by Frank et al. in [28]. Within this paper they described the
application of the BXC method for the optimization of the ARPANET network. The BXC method has also been discussed in [7], [26] and [30].
The essence of the BXC method comprises the following three steps:
.., Select two links, preferably not too far apart . .., Remove these two links from the network.
.., Add two new links using another combination of the four nodes.
The main shortcoming of this method lies in the fact that it requires the
exhaustive exploration of all topological exchanges. In practice this tends to be very time consuming.
The Cut-Saturation method
Gerla et al. [29] have proposed the Cut-Saturation (CS) method for improving backbone designs. The CS method can be considered a sophisticated extension of the BXC method because it selectively considers links, rather than exhaustively trying all exchanges. Backbone links are chosen on their ability to improve network throughput and decrease cost.
The algorithm's goal is to find the least cost backbone topology for a specified delay and throughput constraint. To achieve this, the algorithm attempts to relieve the most congested portion of the topology by adding links in the vicinity of the saturated cutlO, to increase throughput, and by removing links from less utilised areas, to decrease cost.
The CS method described in [29] was somewhat biased by the ARPANET environment and a more generalised version has since been developed with those earlier deficiencies eliminated. The Generalised Cut-Saturation (GCS) method represents one of the more effective backbone optimization heuristics available today, and has been employed by several researchers [13, 73, 90].
The GCS algorithm has been implemented in NDW and several improvements where made in order to improve its performance. These are discussed in the latter part of Chapter seven.
Although perturbation techniques have been discussed in a vast number of papers -the authors have all failed to highlight the major limitation of these techniques in their ability to determine optimum cost topologies. This limitation is discussed in the next section.
Limitations of perturbation techniques
Perturbation techniques alter the network on a link-by-link basis and only one or two discrete variablesll change state during any iteration. This alteration process always converges on an equilibriur:n point which represents a locally optimum topology that satisfies the initial design constraints. The important point to note is that this local minimum does not necessarily correspond to the optimum cost topology.
A possible solution to the network optimization problem will be a network n*.
This network configuration (n*) comprises a large number of variables (e.g. link speed, node positions, backbone structure etc.).
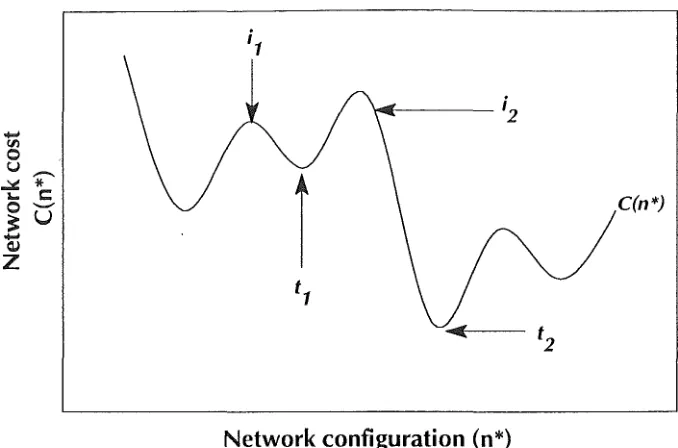
Figure 4.3 details an artificial representation of the solution space for the
optimization problem. The initial, intermediate, and final solutions (n *) and their respective costs C(n*) all correspond to points on this line.
C(n*)
[image:48.597.132.471.67.291.2]Network configuration (n*)
Figure 4.3 Network solution space
Thus, the design process can be vie":ed as the search for an acceptable
configuration (n*) in this very large solution space.
The distance of the initial solution Cit or i2) from the optimum configuration
greatly influences the chances of whether the global optimum Ct2) or just a local
optimum Cit ) is reached.
If the initial network corresponds to a configuration with the optimum number of
nodes, i.e. point i2 in figure 4.312, then any reasonable series of perturbations
should converge on the optimum solution
Ct2 ).
If, however, the initial networkcorresponds to a more distant configuration Cit), for example one with too
many nodes, then the convergence on the optimum structure will depend on the
extent of the perturbations. It is possible to make the extent of these
perturbations so great that all values of n* are covered- this of course equates
to the exhaustive search of all topologies.
This study illustrates the need to integrate the node placement and backbone
design processes in order to provide a greater coverage of the network solution
space (n*), and therefore increase the possibility of the global optimum being
reached.
THE NEED FOR INTEGRATED TOPOLOGICAL DESIGN
Conventional approaches to the distributed network design problem have
divided it into several subproblems- decoupling the node placement and
subscriber access design from the backbone design process, solving them in
isolation, and then combining them for the overall design solution.
The total cost of a communications network consists of the sum of three
components; the hardware (switches etc), the backbone network, and the subscriber access network. In reality, the optimum network structure is highly
sensitive to the interdependence of these three cost components 13.
One of the reasons for this interdependence is that decreasing the cost of one
component will affect the cost of the other two. For example, increasing the
number of backbone nodes will decrease the access cost and simultaneously
increase the hardware and backbone link costs. This implies that in order to
optimize the total cost of the network, the node placement and backbone design
components must be treated as a unified optimization problem.
One of NDW's objectives is to minimise the total network cost whilst still
satisfying the given design constraints. NDW integrates the access network and
backbone design processes with the node placement procedure, in order to
synthesise the most cost-effective topology.
A more detailed discussion of NDW's network synthesis methodology can be
found in Chapters six and seven.
NETWORK COST ANALYSIS
The accurate determination of network configuration costs plays a predominant
part in any design process. The availability of computer-based tools greatly
facilitates the speed and accuracy with which these calculations can be made, enabling the designer to rapidly evaluate the economic consequences of
changing design variables.
Owing to the numerous economic factors involved in costing a modern network (e.g. non linear multi-vendor line tariffs, modular hardware costs etc.) some form
of computerised costing facility is essential for dealing with all but the most trivial
of networks.
This section details the network costing methodology that has been developed
for this study and implemented by NDW.
NETWORK COST ELEMENTS
The total cost of a communications network can be calculated from the sum of
three primary components.
Cnet
=
Cac+
Cbb+
Csw (4.3)where Cac
Csw
Cost of subscriber access network; Cost of backbone links;
Cost of backbone switches.
Each of these three components consists of several sub-components. The calculation of these sub-components are detailed below.
Transmission link cost
The transmission requirements of a link are assumed to be met by commercial leased ser\rices (e.g. Telecom, AT&T etc.), so consequently link costs are totally dependent on their pricing structure14.
In general the cost of a communication link n; is dependent on four components:
Ctink(n;) = C;nit + [ (Caccess + CtransJ X Prental
J
(4.4)where
• Cinit is an initial installation charge .levied by the vendor;
• Caccess is a monthly access or termination charge (usually charged on a per
end basis);
• Ctrans is a monthly transmission charge;
• Prental is the link rental period (in months).
Cinit, Caccess and Ctrans are all dependent on the leased link capacity with Ctrans
being additionally dependent on the link distance.
This costing model can now be used to determine the backbone and access network costs.
Backbone link cost (Cbb)
The cost of the backbone network can be calculated using equation 4.4 and is simply:
Cbb =
t
Ctink (f) where f =set of all backbone linksSubscriber access network cost (Cac)
The cost of a subscriber access link n; can be represented by:
Csub (n;) = Cacclink + Cinterface
14 The transmission link tariffs used by this study are detailed in Appendix I.
(4.5)
where
• Cacclink is the cost of the circuit linking the subscriber equipment to the access port on a network switch. Cacclink can be calculated using equation 4.4;
• Cinterface is the cost associated with any terminal interfacing equipment (i.e. PADs, PEPs, modems etc.).
Thus, the total access network cost for
n
subscribers is:n
Cac=
L
Csub (i)i
=
1(4.7)
Backbone switch cost (Csw)
The backbone switch (for costing purposes) may be regarded as a termination point for communication circuits, with each circuit requiring an individual port. The more circuits terminating at a node the more ports required and the greater the switching cost.
Modern packet-switching nodes may be expanded by the addition of extra processing modules. Each new module has a fixed cost and supports a fixed number of I/0 ports.
Therefore, the cost of a modern switch can be represented by:
CswitchCn) = Cbase
+
Cmodules+ [
Coverheads X Ptime1
where
• Cbase is the fixed base price15 of the switch hardware (less its processing modules).
• Coverheads is the monthly cost associated with housing and maintaining the node. This component is usually variant and dependent on the node's size and location.
• Ptime is the cost analysis time frame (in months).
• Cmodules is a variable cost that is dependant on the number of circuits terminating at that node. Cmodules can be determined by:
I Nbbports + Nacports
l
Cmodules = I MAXports x Cpm
15 Includes the cost of racks, power supplies, cabling etc.
(4.8)
Nbbports and Nacports are the number of backbone and subscriber access ports terminating at the node. MAXports is the maximum number of I/0 ports a single module can accommodate.
I
Xl