ORIGINAL RESEARCH
HEAD & NECK
Prognostic Value of Labyrinthine 3D-FLAIR Abnormalities in
Idiopathic Sudden Sensorineural Hearing Loss
XJ.I. Lee,XR.G. Yoon,XJ.H. Lee,XJ.W. Park,XM.H. Yoo,XJ.H. Ahn,XJ.W. Chung, andXH.J. Park
ABSTRACT
BACKGROUND AND PURPOSE: According to recent research, modern MR imaging can detect the presense of abnormalities on labyrin-thine. Our aim was to report the patterns and prognostic role of abnormal findings on labyrinthine imaging in patients with sudden sensorineural hearing loss.
MATERIALS AND METHODS: This study comprised 113 patients who were diagnosed with unilateral sudden sensorineural hearing loss and underwent 3T MR imaging, including pre-/postcontrast 3D fluid-attenuated inversion recovery and T1-weighted imaging. We analyzed abnormalities on MR imaging and correlated them with audiometric results.
RESULTS:Thirty-one (27%) patients showed abnormal findings on labyrinthine MR imaging in the affected ear. The initial/final hearing levels of the MRI⫹group (91⫾25/73⫾27 dB hearing loss) were significantly worse than those of the MRI⫺group (69⫾30/48⫾24 dB hearing loss). The incidence of abnormalities on labyrinthine MR imaging was significantly lower (3 of 40, 8%) in 40 patients with initial mild-to-moderate hearing loss than in those with profound hearing loss (16 of 34, 47%). Considering hearing improvement by the Siegel criteria, the rate of complete or partial recovery was significantly higher in the MRI⫺group (34%) than in the MRI⫹group (10%). In patients with initial severe or profound hearing loss, the MRI⫺group showed greater hearing improvement (38⫾21 dB) than the MRI⫹group (23⫾22 dB).
CONCLUSIONS: Abnormalities on labyrinthine MR imaging were found in 27% of patients with sudden sensorineural hearing loss. The initial hearing loss was worse in the MRI⫹group than in the MRI⫺group. In patients with initial severe and profound hearing loss, the presence of abnormalities on labyrinthine MR imaging indicated a poor prognosis.
ABBREVIATIONS:DPOAE⫽distortion product otoacoustic emissions; HL⫽hearing loss; PTA⫽pure-tone average; SSNHL⫽sudden sensorineural hearing loss
S
udden sensorineural hearing loss (SSNHL) is caused by a va-riety of pathophysiologic mechanisms and can occur when cochlea or neural function or both are impaired. Viral infection and traumatic, neoplastic, immunologic, toxic, circulatory, and neurologic causes are well-known etiologic factors in 10%–15% of patients with SSNHL, but the cause is unknown in most cases.1Although there are many causes of SSNHL, temporal bone histo-pathologic evidence indicates that SSNHL could be caused by
viral cochleitis or cochlear neuritis, and these lesions are unlike those resulting from known vascular causes.2
MR imaging is frequently performed to evaluate patients with SSNHL, traditionally to identify brain lesions or retrocochlear lesions such as vestibular schwannoma.3Several studies reported
that new MR imaging sequences can evaluate labyrinthine abnor-malities (the presence of intracellular and extracellular methemo-globin or increased protein content in the membranous fluid) by using 3D fluid-attenuated inversion recovery in patients with SSNHL4-10and can distinguish endolymphatic hydrops by
volu-metric quantification of MR imaging.11These abnormal findings
may also be a novel prognostic factor for SSNHL, but there are conflicting results about the prognostic value of abnormalities on labyrinthine MR imaging.6,9
The purpose of this study was to report the incidence of abnormalities on labyrinthine MR imaging in 113 patients with SSNHL and to evaluate the prognostic value of these abnormalities.
Received December 21, 2015; accepted after revision June 16, 2016.
From the Departments of Otolaryngology (J.I.L., J.W.P., J.H.A., J.W.C., H.J.P.) and Ra-diology (J.H.L.), Asan Medical Center, University of Ulsan College of Medicine, Seoul, Korea; Department of Radiology (R.G.Y.), Catholic Kwandong University International St. Mary’s Hospital, Catholic Kwandong University College of Medi-cine, Incheon, Korea; and Department of Otolaryngology (M.H.Y.), College of Med-icine, Kyungpook National University, Daegu, Korea.
J.I.L. and R.G.Y. contributed equally to this article.
Please address correspondence to Hong Ju Park, MD, PhD, Department of Otolar-yngology, Asan Medical Center, University of Ulsan College of Medicine, 86 Asan-byeongwon-gil, Songpa-gu, Seoul, Korea 138-736; e-mail: [email protected]
MATERIALS AND METHODS
Patients
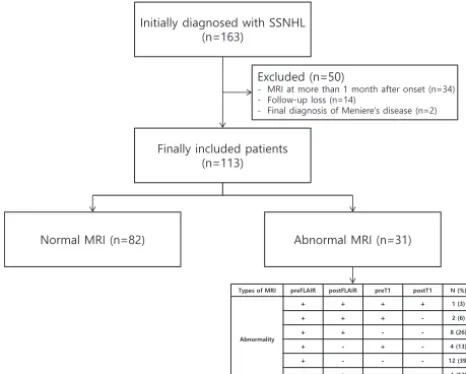
From July 2011 to June 2013, 163 patients were diagnosed with unilateral SSNHL and underwent 3T MR imaging, including pre-/postcontrast 3D-FLAIR and T1-weighted imaging. The criteria used to define SSNHL were the presence of unilateral sensorineural hearing loss ofⱖ30 dB over at least 3 contiguous audiometric frequencies developed during a period of a few hours up to 3 days, without any obvious cause.12We excluded
34 patients who underwent MR imaging after⬎1 month from onset, 14 patients with loss to follow-up, and 2 patients diag-nosed with Menière disease during follow-up. Finally, 113 pa-tients were included in this study (Fig 1). The protocol was approved by the institutional review board of Asan Medical Center.
Audiologic Evaluation and MR Imaging
All patients underwent a physical examination; an otologic assessment, including an endoscopic examination of the tym-panic membrane; and both pure-tone and speech audiometry. Hearing levels were evaluated with pure-tone audiometry (Madsen Orbiter 922; GN Otometrics, Taastrup, Denmark) in a sound-isolated chamber. Hearing loss (HL) was defined by the pure-tone average (PTA), calculated by using thresholds at 0.5, 1.0, 2.0, and 4.0 kHz. Audiometric assessments were per-formed at the time of diagnosis, 1 month later, and then after steroid treatment; the last audiometric findings obtained 4.3⫾ 4.1 months (median, 3.0 months) after steroid treatment were considered the definitive posttreatment result.
The severity of the initial hearing loss was classified as mild (26 – 40 dB), moderate (41–55 dB), moderately severe (56 –70 dB), severe (71–90 dB), or profound (⬎90 dB). If the patient did not respond to the maximum sound level, we defined the thresh-old as the maximum level plus 5 dB. After at least 1 month, the PTA was determined again for evaluation of the therapeutic ef-fects. The degree of recovery was evaluated according to the Siegel criteria,13as follows: complete recovery⫽final hearing⬍25 dB
HL; partial recovery⫽gain⬎15 dB and a final hearing of 25 to 45 dB HL; slight improvement⫽gain⬎150 dB and a final hearing of
⬎45 dB HL; and no improvement⫽gain⬍15 dB and a final hearing of⬎75 dB HL. All patients were treated with oral meth-ylprednisolone, 48 mg/day for 9 days, and then tapered during 5 days. Intratympanic steroid injections were administered to pa-tients experiencing insufficient hearing gains after intraoral meth-ylprednisolone therapy.
MR imaging was performed by using a 3T MR imaging system (Achieva; Philips Healthcare, Best, the Netherlands) with an 8-channel head coil. The protocols included coronal T1- and T2-weighted turbo spin-echo, axial 3D T2-T2-weighted, pre-/postcon-trast 3D-FLAIR, and postconpre-/postcon-trast T1-weighted imaging. For en-hancement, Gd-DOTA (Dotarem; Guerbet, Aulnay-sous-Bois, France) at 0.2 mmol/kg of body weight was used, and axial 3D-FLAIR images were acquired with a time delay of 7 minutes. The delay between SSNHL onset and MR imaging was 9.7⫾8.0 days (range, 1–30 days).
Axial 3D T2-weighted imaging was performed with the following parameters: TR⫽2000 ms; TEeff⫽250 ms; flip angle⫽90°; number
of signal averages⫽2; echo-train length⫽70; number of encoding steps⫽300; FOV⫽180⫻180 mm; matrix⫽300⫻300 (recon-struction matrix⫽512⫻512); voxel size⫽0.6⫻0.6⫻0.6 mm; slab number⫽1; slab thickness⫽40 mm; section thickness⫽1.2 mm; spacing between sections⫽0.6 mm; acquisition time⫽4 minutes 58 seconds; and sensitivity encoding factor⫽2.
Axial pre-/postcontrast 3D-FLAIR MR imaging was per-formed with the following parameters: TR⫽8000 ms; TEeff⫽280
ms; flip angle⫽90°; number of signal averages⫽1; TI⫽2400 ms; fat saturation⫽spectral adiabatic inversion recovery; flip angle⫽ 90°; echo-train length⫽80; number of encoding steps⫽300; FOV⫽180⫻180 mm; matrix⫽300⫻300 (reconstruction matrix⫽512⫻512); voxel size⫽0.6⫻0.6⫻0.6 mm; slab number⫽1; slab thickness⫽40 mm; section thickness⫽1.2 mm; spacing between sections⫽0.6 mm; acquisition time⫽8 minutes 48 seconds; and sensitivity encoding factor⫽2.
Axial postcontrast T1-weighted imaging was performed with the following parameters: TR⫽25 ms; TEeff⫽4.6 ms; flip angle⫽30°;
number of signal averages⫽2; echo-train length⫽70; number of encoding steps⫽300; FOV⫽180⫻180 mm; matrix⫽300⫻300 (reconstruction matrix⫽512⫻512); voxel size⫽0.6⫻0.6⫻0.6 mm; slab number⫽1; slab thickness⫽40 mm; section thickness⫽ 1.2 mm; spacing between sections⫽0.6 mm; acquisition time⫽3 minutes 57 seconds; and sensitivity encoding factor⫽2.
[image:2.594.52.285.48.235.2]the labyrinth was considered MRI⫹, and the absence of any high signal was considered MRI⫺.
Statistical Analysis
The results of audiologic findings in patients with MRI⫹and MRI⫺ were compared by using the Mann-WhitneyUtest for continuous variables and the Pearson2test for categoric
vari-ables. APvalue⬍.05 was considered statistically significant. Sta-tistical analyses were conducted by using SPSS software (Version 14.0 for Windows; IBM, Armonk, New York).
RESULTS
Thirty-one (27%) of 113 patients with SSNHL showed abnormal-ities on labyrinthine MR imaging in the affected ears. Between the
MRI⫹and MRI⫺groups, there were no significant differences in age, sex, under-lying disease (diabetes mellitus, hyper-tension), or associated symptoms (Table 1). The average period from onset to ini-tial visit and from onset to MR imaging examination of all patients was 7⫾10 and 10⫾8 days, respectively, which was also not significantly different between the 2 groups. In the MRI⫹group, 27 patients showed high signal intensity in the affected inner ears on precontrast 3D-FLAIR images, 11 of whom also showed high signal intensity on gadolin-ium-enhanced 3D-FLAIR images in the affected ear. Moreover, 7 of 27 patients who were MRI⫹ in precontrast 3D-FLAIR images also showed high signals on precontrast T1-weighted images, one of whom exhibited high signals on both pre- and postcontrast T1-weighted im-ages. High signals on only postcontrast 3D-FLAIR images were observed in 4 pa-tients. No patients exhibited high signals in the contralateral intact ear. Twenty-nine patients showed high signals in the cochleae, and 20 of them showed high signals in the vestibule. Two patients ex-hibited high signals only in the vestibule or semicircular canal (1 each).
Patients were classified into 5 catego-ries on the basis of PTA: 16 patients with mild HL, 24 with mod-erate HL, 15 with modmod-erately severe HL, 24 with severe HL, and 34 profound HL. The incidence of abnormalities on labyrinthine MR imaging was analyzed according to the initial hearing levels (Table 2). The abnormal rate was significantly lower (8%, 3 of 40) in patients with initial mild-to-moderate HL than in patients with initial profound HL (47%, 16 of 34).
[image:3.594.57.530.48.156.2]The initial/final hearing levels (91⫾25/73⫾27 dB HL) of the MRI⫹group were significantly worse than those (69⫾30/48⫾24 dB HL) of the MRI⫺group (Table 2). When one considers hearing improvement according to the Siegel criteria, the rate of complete or partial recovery in the MRI⫺group (34%) was significantly higher than that (10%) of the MRI⫹group (Fig 3); however, the overall FIG 2. Precontrast axial scans of 3D-FLAIR MR imaging in right inner ear of a 63-year-old man with right sudden sensorineural hearing loss with vertigo. Bright signals (arrows) are visible only in the right cochlea and vestibule at the level of the basal turn (A) and midturn (B) of the cochlea and vestibule, not in the left healthy cochlea and vestibule (open arrows).
Table 1: Clinical and demographic characteristics of patients with SSNHL All
(N= 113)
MRI− Group (n= 82)
MRI+ Group
(n= 31) PValue
Mean age (yr) 53⫾14 53⫾14 55⫾14 .634
Sex (male/female) 51:62 38:44 13:18 .675
DM (No.) (%) 11 (10) 7 (9) 4 (13) .490
HTN (No.) (%) 27 (24) 20 (24) 7 (23) .840
Vertigo (No.) (%) 30 (27) 21 (26) 9 (29) .713
Tinnitus (No.) (%) 82 (73) 61 (74) 21 (68) .480
Ear fullness (No.) (%) 53 (47) 39 (48) 14 (45) .820
Initial visit after onset (days) 7⫾10 7⫾10 9⫾9 .076
MRI after onset (days) 10⫾8 10⫾8 9⫾6 .804
ITSI before MRI (No.) (%) 16 (14) 11 (13) 5 (16) .713
Note:—DM indicates diabetes mellitus; HTN, hypertension; ITSI, intratympanic steroid injection.
Table 2: Initial and final audiologic results and classification by Siegel criteria in MRIⴙand MRIⴚgroups
All Cases (N= 113)
MRI− Group (n= 82)
MRI+ Group
(n= 31) PValue Initial audiogram (mean) (dB HL) 75⫾30 69⫾30 91⫾25 ⬍.001
Severity of initial HL (No.) (%) .005
Mild 16 (14) 15 (18) 1 (3)
Moderate 24 (21) 22 (27) 2 (6)
Moderately severe 15 (13) 10 (12) 5 (16)
Severe 24 (21) 17 (21) 7 (23)
Profound 34 (30) 18 (22) 16 (52)
Additional ITSI (No.) (%) 79 (70) 50 (61) 29 (94) .001
Final audiogram (mean (dB HL) 55⫾27 48⫾24 73⫾27 ⬍.001 Improvement of hearing (⌬PTA, dB) 20⫾24 21⫾23 18⫾24 .964
Improvement by Siegel criteria (No.) (%) .003
No improvement 50 (44) 38 (46) 12 (39)
Slight improvement 32 (28) 16 (20) 16 (52)
Partial recovery 18 (16) 17 (21) 1 (3)
Complete recovery 13 (12) 11 (13) 2 (6)
[image:3.594.55.378.212.337.2] [image:3.594.54.382.375.549.2]hearing improvement of the MRI⫹group (18⫾24 dB) was not significantly worse than that of the MRI⫺group (21⫾23 dB).
When analyzing the data from the patients with SSNHL with the initial severe and profound HL (n⫽58), the MRI⫹group showed a significantly reduced improvement compared with that of the MRI⫺group. The degree of hearing improvement in patients in the MRI⫹ group (23⫾24 dB) was significantly lower than that of patients in the MRI⫺group (38⫾27 dB). Moreover, the final PTA of the MRI⫹group (80⫾27 dB HL) was significantly higher than that of the MRI⫺group (60⫾23 dB HL) (Fig 4).
Ten patients showed low-frequency hearing loss at the initial PTA, according to the classification of Mazzoli et al.14Only 1
patient (10%) showed an MRI⫹finding. By the Siegel criteria,
7 (70%) recovered completely or partially, and another 3 (30%) showed no improvement. Patients with the low-fre-quency type showed a low incidence of abnormal findings on MR imaging and a better prognosis compared with patients with other types.
DISCUSSION
Although contrast-enhanced MR imaging has been used to rule out retrocochlear lesions in patients with SSNHL, modern MR imaging can also detect the presence of abnormalities on labyrin-thine MR imaging. It was previously reported that increased pro-tein concentrations are characterized by high signal intensity on 3D-FLAIR imaging,5,8,10,15which was reported to be more
sensi-tive than T1- and T2-weighted MR imaging.6,7Moreover,
3D-FLAIR imaging can detect the breakdown of the blood-labyrinth barrier as an enhancement of fluid signal in the inner ear and/or nerve signal after gadolinium injection, owing to its high sensitiv-ity to magnetic susceptibilsensitiv-ity.8,9Typically, the perilymph and
en-dolymph are isointense to CSF on all MR imaging sequences. It was reported that healthy subjects did not exhibit high signal in-tensity in the inner ear with or without gadolinium enhancement on 3D-FLAIR images until 10 minutes after gadolinium injection.16
In our study, 3D-FLAIR provided a diagnostic sensitivity for 27% (31 of 113) of patients with SSNHL who were otherwise healthy. We observed high signal intensity in the affected ears only, not in the contralateral intact ears, confirming the high re-liability of 3D-FLAIR MR imaging. Our abnormality rate on lab-yrinthine MR imaging (27%) was similar to those (26%–34%) of previous reports,9,17though others reported high abnormality
rates (57%– 65%).6,7We speculate that both inflammation and
hemorrhage might increase the protein content, resulting in pos-itive findings on 3D-FLAIR. Temporal bone histopathologic evi-dence indicated that SSNHL may be caused by viral cochleitis or cochlear neuritis rather than vascular etiologies.2
Intralabyrinthine hemorrhage might be differentiated from increased protein content when high signal intensities are observed in both T1 and 3D-FLAIR im-aging.6,18According to these criteria,
in-tralabyrinthine hemorrhage could be suspected in 6% (7 of 113) of patients in this study. Whether the abnormalities on labyrinthine MR imaging indicate creased protein content induced by an in-flammatory process or intralabyrinthine hemorrhage requires further clarification. In the current study, initial hearing levels in the MRI⫹group (91⫾25 dB HL) were significantly worse than those of the MRI⫺group (69⫾30 dB HL); this finding suggests that extensive dam-age to the inner ear structures correlates with a positive result on 3D-FLAIR. The incidence of abnormalities on labyrin-thine MR imaging was low (3, 8%) in 40 patients with initial mild-to-moderate p
FIG 3. Hearing improvement according to the Siegel criteria in the MRI⫹and MRI⫺groups. CR indicates complete recovery; PR, partial recovery; SI, slight improvement; NR, no recovery.
Inial PTA Final PTA PTA Inial PTA Final PTA PTA MR- group 46.1 40.2 5.9 98.8 60.5 38.3 MR+ group 58.9 58.2 0.7 103.5 81 22.5
0 10 20 30 40 50 60 70 80 90 100 110 120
Pur
e
-tone
a
v
e
rag
e
(dB
HL)
*p=0.004
*p=0.026 Inial mild to moderately
severe HL
Inial severe to profound HL
*p=0.024
*p=0.031
[image:4.594.51.283.222.395.2] [image:4.594.60.364.449.690.2]HL and increased to 47% (16 of 34) in patients with profound HL, which was a significant difference. These findings are comparable with those of previous reports in which the initial PTA exhibited a good correlation with FLAIR MR imaging findings and 3D-FLAIR hyperintensity significantly correlated with vertigo, sug-gesting extensive inner ear damage6; however, other studies
re-ported no significant differences in the initial PTA findings, regardless of abnormalities on MR imaging.7,9Differences in
study populations, time intervals between SSNHL onset and MR imaging, and masking effects induced by steroid treatment could explain these differences.6Objective criteria for the presence of
high signal intensity on MR images also need to be determined to mitigate any potential differences arising from this issue.
Regarding the prognostic value of abnormalities on labyrin-thine MR imaging, recent studies show inconsistent results. In-vestigations of 3D-FLAIR demonstrated that high signal intensi-ties in the cochlea on precontrast 3D-FLAIR images are associated with a poor prognosis for hearing7,9; however, another study
showed that hyperintense signals on 3D FLAIR or gadolinium-enhanced MR imaging were not significantly correlated with hearing improvement or posttreatment PTA.6
In our study, 3D-FLAIR MR imaging findings closely corre-lated with the severity of hearing loss. Furthermore, posttreat-ment hearing levels in the MRI⫹group were worse than those of the MRI⫺group. Moreover, the rate of complete or partial recov-ery in the MRI⫺group (34%) was significantly higher than that of the MR⫹group (10%) when hearing improvement was defined according to the Siegel criteria; however, the MRI⫹group might have experienced poor hearing outcomes because they had poorer initial hearing levels than the MRI⫺group, and patients with a high level of initial HL exhibited a poorer hearing prognosis.7,9
Our findings, in which the overall hearing improvement of the MRI⫹group (18⫾24 dB) was not significantly worse than that of the MRI⫺group (21⫾23 dB), support this hypothesis; thus, we analyzed the hearing improvement according to the initial hear-ing levels and observed that the hearhear-ing improvement of the MRI⫹group (23⫾24 dB) was significantly less than that of the MRI⫺group (38⫾27 dB) when the initial hearing loss was severe or profound (Fig 4). Our findings demonstrate that patients with SSNHL with mild or moderate initial HL rarely exhibited abnor-malities on labyrinthine MR imaging (8%, 3 of 40), which were without any significant prognostic value. By contrast, patients with SSNHL with initial severe or profound HL frequently exhib-ited abnormalities on labyrinthine MR imaging (40%, 23 of 58), which were significantly associated with a poor prognosis.
Similar findings were reported by using distortion product otoacoustic emissions (DPOAE) in patients with SSNHL.19The
function of the outer hair cells as measured by DPOAE, which indicates intact labyrinthine function, was relatively preserved in patients with initial mild-to-moderate HL, and their hearing re-covery was not associated with the DPOAE results. This finding is analogous to our findings in which labyrinthine involvement was rare and not related to hearing improvement in patients with initial mild-to-moderate HL; however, patients with preserved DPOAE and initial moderately severe-to-profound HL, who would be analogous to patients with initial severe-or-profound HL in the MRI⫺group in our study, had a good prognosis.
A large-scale quantitative study involving additional tests, in-cluding pure-tone audiometry and DPOAE, may help provide a detailed understanding of the pathophysiology of SSNHL and de-termine the prognostic value of abnormalities on labyrinthine MR imaging. In this study, we could not correlate MR imaging involvement of different inner ear structures with clinical symp-toms because of the small study population.
CONCLUSIONS
Abnormalities on labyrinthine MR imaging were found in 27% of patients with SSNHL. Notably, the initial HL in the MRI⫹group was worse than that of the MRI⫺group. In patients with initial severe and profound hearing loss, the presence of an abnormality on labyrinthine MR imaging was a poor prognostic factor. Fur-ther studies with a larger study population are needed to clarify the distribution of specific patterns of abnormalities on MR im-aging and their clear relationship with hearing improvement.
REFERENCES
1. Hughes GB, Freedman MA, Haberkamp TJ, et al.Sudden senso-rineural hearing loss.Otolaryngol Clin North Am1996;29:393– 405
Medline
2. Schuknecht HF, Donovan ED.The pathology of idiopathic sudden sensorineural hearing loss.Arch Otorhinolaryngol 1986;243:1–15
CrossRef Medline
3. Aarnisalo AA, Suoranta H, Ylikoski J.Magnetic resonance imaging findings in the auditory pathway of patients with sudden deafness. Otol Neurotol2004;25:245– 49CrossRef Medline
4. Weissman JL, Curtin HD, Hirsch BE, et al.High signal from the otic labyrinth on unenhanced magnetic resonance imaging.AJNR Am J Neuroradiol1992;13:1183– 87Medline
5. Cervantes SS, Barrs DM.Sudden sensorineural hearing loss associ-ated with intralabyrinthine hemorrhage.Otol Neurotol2015;36: e134 –35CrossRef Medline
6. Berrettini S, Seccia V, Fortunato S, et al.Analysis of the 3-dimen-sional fluid-attenuated inversion-recovery (3D-FLAIR) sequence in idiopathic sudden sensorineural hearing loss.JAMA Otolaryngol Head Neck Surg2013;139:456 – 64CrossRef Medline
7. Yoshida T, Sugiura M, Naganawa S, et al.Three-dimensional fluid-attenuated inversion recovery magnetic resonance imaging find-ings and prognosis in sudden sensorineural hearing loss. Laryngo-scope2008;118:1433–37CrossRef Medline
8. Sugiura M, Naganawa S, Teranishi M, et al.Three-dimensional flu-id-attenuated inversion recovery magnetic resonance imaging findings in patients with sudden sensorineural hearing loss. Laryn-goscope2006;116:1451–54CrossRef Medline
9. Lee HY, Jung SY, Park MS, et al.Feasibility of three-dimensional fluid-attenuated inversion recovery magnetic resonance imaging as a prognostic factor in patients with sudden hearing loss.Eur Arch Otorhinolaryngol2012;269:1885–91CrossRef Medline
10. Kim DY, Lee JH, Goh MJ, et al.Clinical significance of an increased cochlear 3D fluid-attenuated inversion recovery signal intensity on an MR imaging examination in patients with acoustic neuroma. AJNR Am J Neuroradiol2014;35:1825–29CrossRef Medline
11. Gu¨rkov R, Berman A, Dietrich O, et al.MR volumetric assessment of endolymphatic hydrops. Eur Radiol 2015;25:585–95 CrossRef Medline
12. Wilson WR, Byl FM, Laird N.The efficacy of steroids in the treat-ment of idiopathic sudden hearing loss: a double-blind clinical study.Arch Otolaryngol1980;106:772–76CrossRef Medline
13. Siegel LG.The treatment of idiopathic sudden sensorineural hear-ing loss.Otolaryngol Clin North Am1975;8:467–73Medline
non-syndromic hereditary hearing impairment. Audiol Med 2003;1: 148 –50CrossRef
15. Melhem ER, Jara H, Eustace S.Fluid-attenuated inversion recovery MR imaging: identification of protein concentration thresholds for CSF hyperintensity.AJR Am J Roentgenol1997;169:859 – 62CrossRef Medline
16. Naganawa S, Komada T, Fukatsu H, et al.Observation of contrast en-hancement in the cochlear fluid space of healthy subjects using a 3D-FLAIR sequence at 3 Tesla.Eur Radiol2006;16:733–37CrossRef Medline
17. Ryu IS, Yoon TH, Ahn JH, et al.Three-dimensional fluid-attenuated
inversion recovery magnetic resonance imaging in sudden senso-rineural hearing loss: correlations with audiologic and vestibular testing.Otol Neurotol2011;32:1205– 09CrossRef Medline
18. Noguchi K, Seto H, Kamisaki Y, et al.Comparison of fluid-attenu-ated inversion-recovery MR imaging with CT in a simulfluid-attenu-ated model of acute subarachnoid hemorrhage.AJNR Am J Neuroradiol2000; 21:923–27Medline