Aspects of binary image reconstruction from
Fourier amplitude data
V. L. Lo and R. P. Millane
Computational Imaging Group, Department of Electrical and Computer Engineering, University of Canterbury, Private Bag 4800, Christchurch, New Zealand.
Email: [email protected]
Abstract
The reconstruction of a binary image from undersampled Fourier amplitude data is considered. Binary, connectivity, and compactness constraints are discussed and shown to be sufficient to enforce a unique solution. An iterative projection algorithm is described for a realistic crystallographic application.
Keywords: Binary images, image reconstruction, phase retrieval, x-ray crystallography
1
Introduction
Phase retrieval is concerned with reconstructing an image from measurements of the amplitude, but not the phase, of its Fourier transform [1]. A common application is reconstruction of an ob-ject from incoherent measurements of its diffracted wavefield. Applications include astronomy, radar, and microwave, electron, and x-ray imaging. If the Fourier amplitude data are fully sampled, an image space support can be imposed, and the image can be reconstructed. However, if that is not possible then other a priori information must be incorpo-rated in order to reconstruct the image. Combining the a priori information with the data is a diffi-cult problem, but a class of algorithms known as Iterative Projection Algorithms (IPAs) have been shown to be effective in many cases [2, 3]. These algorithms use projection operators that involve making the minimum change to an estimate of the image to satisfy a constraint. The algorithms involve iteratively combining projections in various ways using the measured Fourier amplitude con-straint and additional image concon-straints. If the algorithm converges such that the image estimate satisfies all the constraints, then a suitable solution has been found.
We are consider here the image reconstruction prob-lem in protein x-ray crystallography, in which it is required to reconstruct the electron density of a large molecule from measurements of the ampli-tudes of x-rays diffracted by a crystalline (periodic) specimen [1, 4]. The diffraction pattern is directly related to the Fourier transform of the electron density of the molecule, and the 2D diffraction
978-1-4244-2582-2/08/$25.00 c2008 IEEE
patterns from various rotations of the crystal can be combined to form the 3D Fourier transform of the molecule. One period of the crystal called the unit cell. The crystalline nature of the specimen leads to constructive interference of the diffraction pattern at spatial frequencies which are multiples of the reciprocal of the unit cell dimensions, and destructive interference everwhere else. The con-structive interference improves the signal to noise ratio, but the destructive interference makes it im-possible to sample the Fourier data at greater than the Nyquist rate. This severely limits the appli-cation of the usual phase retrieval IPAs that de-pend critically on oversampled diffraction ampli-tudes and the corresponding image domain sup-port constraint. Since the Fourier domain samples are at the Nyquist rate, but only the amplitude data (but not the phase) is available, additional information is needed to reconstruct the image.
In protein crystallography additional information is usually obtained by collecting additional experi-mental data that are used to calculate initial phase estimates [1, 4]. Protein molecules are compact structures and it is often useful as a preliminary step to determine the boundary, or molecular en-velope, of the protein molecule. Here we address the problem of determining the molecular envelope from crystal x-ray diffraction amplitudes. We have recently reported on characteristics and algorithms for this problem and conducted 2D simulations [5, 6]. Here we review these results and then consider some practical considerations related to scaling of the data and present some 3D results.
dif-ferent electron densities, then the amplitudes that would be diffracted by the molecular envelope (a function equal to unity in the protein region and zero elsewhere) can be calculated. This is called the solvent contrast method [7]. We assume that such an experiment has been conducted and the data processed to provide the Fourier amplitudes of the molecular envelope. The problem is to recon-struct the molecular envelope using these derived diffraction amplitudes.
The constraints used in this problem are described in Section 2 and uniqueness of the solution is dis-cussed in Section 3. Reconstruction methods fol-low in Section 4, and simulation results are pre-sented in Section 5 with concluding remarks made in Section 6.
2
Constraints
Four basic constraints are used: (1) The Fourier amplitude (data) constraint, (2) the binary con-straint and (3) a connectivity concon-straint.
2.1
Fourier Amplitude Constraint
The Fourier amplitude constraint represents satis-faction of the Fourier amplitude data. The image is defined on a grid ofN pixels in image space. The Fourier amplitude data are the DFT of the image and exist on an N-point grid in Fourier space. The image and its Fourier transform are repre-sented as a point in the N-dimensional Euclid-ean space RN. The x-ray amplitudes cannot be measured at low resolution close to the origin of Fourier space. Diffraction data are also measured out to a maximum isotropic resolution. Therefore, the Fourier amplitude constraint applies within a circular (spherical) shell, and we denote the set of measured data points by Q. The number of data ism=|Q|, but as a result of Hermitian symmetry, the number of independent data ism/2. For typ-ical macromolecular envelope data, the measured resolutions are between about 40˚A to 7˚A, and we will use these values in the simulations. Most of the information on a connected binary image is contained in the low resolution data, so loss of low resolution data is more harmful than is loss of the higher resolution data when reconstructing molecular envelopes.
Takezto be the binary envelope function equal to 1 inside the protein and 0 elsewhere, andZ=F[z] to be the DFT of z. The measured Fourier ampli-tude dataM correspond to the DFT of a general two-valued function. The two-valued function can be transformed to a binary function with a scale factorsand an offsetd.
The appropriately processed data M are then re-lated to the envelope functionzby
z=sF−1[Meiφ(Z)] +d, (1)
whereF−1[·] denotes the inverse Fourier transform, φ(Z) denotes the phase ofZ, andi=√−1.
The dataMj are therefore related to|Z|by
|Zj|=
sMj if j= 0
sMj+d if j= 0, (2)
where j = 0 denotes the zero spatial frequency term. Since the origin term cannot be measured the unknown offsetdis of no significance.
The Fourier amplitude constraint set, denoted A, is therefore defined by
A={x:|Xj|=|Zj|=sMj, j∈Q}, (3)
where|Xj|are the amplitudes of the Fourier trans-form of x.
2.2
Binary and fill fraction constraint
The image (molecular envelope) is a binary func-tion, and thebinary constraint setB is defined by
B={x:xj∈(0,1), j= 1,2, ..., N}. (4)
The fraction of the unit cell filled by the molecule can be easily estimated experimentally. We there-fore consider an additional constraint on a binary image that we call thefill fraction constraint, that restricts the number of 1-pixels in the image to a fixed fractionf of the total number of pixels. This constraint setF is therefore defined by
F =
⎧ ⎨ ⎩x∈B:
N
j=1
xj =f N
⎫ ⎬
⎭. (5)
Since the zero frequency term is not measured in Q, there will not be any inconsistency between the amplitude data constraint at j = 0 and the fill fraction constraint.
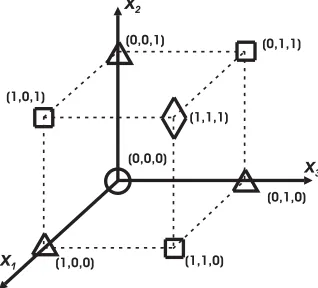
The binary constraint consists of the corners of a hypercube inRN. The fill fraction constraint is an (N−1)-dimensional hyperplane that is orthogonal to the (1,1,..,1) axis. Fig. 1 shows the binary and fill fraction constraint for a 3 pixel image.
2.3
Connectivity constraint
Figure 1: Binary and fill fraction constraints forN= 3. The binary constraints includes the points marked by the four symbols. The binary and fill fraction constraints are the points marked by the symbols
(fN= 0),(fN = 1),(fN= 2) and(fN = 3).
nor “holes” in the envelope. We call these the con-nected and simply connected constraints respec-tively. We define an object to be a set of 1-pixels in which every 1-pixel is connected to every other 1-pixel in the set through a path of pixel neigh-bourhoods.
The connectivity constraint is expected to help com-pensate for the loss of the low resolution Fourier amplitude data, since an incorrect low resolution magnitude is likely to lead to disconnected images.
2.4
Symmetry
Crystals usually have a known symmetry in which the electron density at each point in a crystal is equal to that at a set of symmetry related points. This is referred to as crystallographic or space group symmetry. Crystallographic symmetry translates to restrictions on, and relationships between, the amplitude and phases of the complex Fourier am-plitudes. The presence of crystallographic symme-try does not provide any additional information in the Fourier amplitudes.
The combined binary and connectivity image space constraint set is denotedI.
3
Uniqueness
In any image reconstruction problem, it is impor-tant to consider whether the data and constraints are sufficient to uniquely define the image. We have shown previously that a binary image is ex-pected to be uniquely defined by the undersampled Fourier amplitude data described above [6]. Loss of the low resolution data is expected to be trouble-some, but the connectivity constraint is expected to ease this problem.
The Fourier amplitude and binary connectivity con-straints alone still leave some unresolved ambigu-ities [6]. Most of these are of little significance except the ambiguity between the image f(m, n) and its negative−f(m, n). Let the negative of the binary image ofxbe denotedy, i.e.
y= 1−x. (6)
As a result of the periodic boundary conditions, if x is simply connected y will be connected and vice versa. Furthermore, it is easily seen that the amplitude data fory,|Yj|, are
|Yj|=
|Xj| if j= 0
1−f f
|X0| if j= 0, (7)
where f is the fill fraction of x. Note also that f(y) = 1−f(x) where f(x) denotes the fill frac-tion of imagex. Therefore, since|X0|is not mea-sured, the only constraint which can differentiate an image from its negative is the fill fraction f. Therefore, referring to Eq. 7, iff = 0.5, we cannot differentiate an image from its negative. Difficul-ties are therefore expected iff is close to 0.5.
An additional consideration is that for fill fractions close to 0.5 the total number of binary images, equal to NCfN, is a maximum for f = 0.5. The size of the constraint set that a reconstruction al-gorithm has to explore is therefore a maximum for f = 0.5.
4
Reconstruction algorithm
Once established that a unique solution exists, it only remains to find the solution. IPAs have proven to be useful for solving phase retrieval problems, and so are used here. An IPA is an algorithm that aims to find the intersection between two con-straint sets by mean of operations called projec-tions. The projection of a pointx∈RN onto a set A ⊂ RN, denoted PAx, is the point in A that is closest (in terms of Euclidean distance) tox, i.e.
PAx= argminx∈A x−x. (8)
The simplest, and most intuitively obvious IPA, often referred to as the Error Reduction (ER) al-gorithm, is defined by the iteration
xn+1=PIPAxn. (9)
A number of different projection algorithms have been developed that can, with varying degrees of success, avoid stagnation [3]. Here we use the Dif-ference Map (DM) algorithm which is defined by the iteration [2]
xn+1=xn+β[PA((1 + 1/β)PIxn+ (1/β)xn) −PI((1−1/β)PAxn−(1/β)xn)],(10)
where β = 0 is a parameter usually set such that 0.7 ≤ |β| ≤ 1. The DM algorithm has the desir-able property that it does not stagnate at a near-intersection, but moves towards, and then away from, a point closest to both constraint sets, and continues to explore the parameter space. It is therefore quite effective at avoiding stagnation. The iterates x do not necessarily fall in the solution space, so that a projection, usually onto the more restrictive set, must be made to obtain the final solution. The Fourier and image space projections are described below.
4.1
Fourier amplitude projection
The Fourier amplitude projectionPA is
PAx=F−1[ ˜PAF[x]], (11)
where ˜PAis the corresponding projection in Fourier space, i.e.
˜ PAXj=
sMjexp(iφ(Xj)) if j ∈Q
Xj if ∈/ Q. (12)
Due to the loss of low (and high) resolution ampli-tudes, it is not possible to calculate the scale factor sdirectly. The scale factor was therefore estimated by placing an ellipsoid in each of the asymmetric units (symmetry related regions in the unit cell) as a rough model of the molecule, with the size of the ellipsoids chosen to ensure that the overall fill fraction is correct. Then the estimate ˆsofsis then given by
ˆ
s= j∈Q|Wj|
2
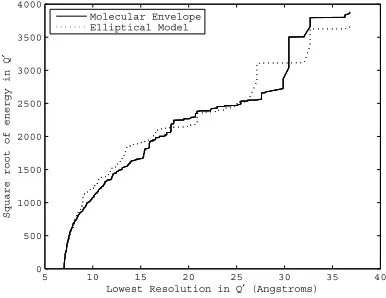
j∈Q|Mj|2, (13) where Q is the set of structure factors within a spherical shell in Fourier space, and Wj are the Fourier magnitudes of the ellipsoid model. Fig-ure. 2 shows a plot of the square root of total energy inQ (j∈Q|Xj|2) as a function of the
low resolution limit ofQ with the maximum res-olution set at 7˚A for an actual molecular envelope (see Section 5) and the ellipsoid model. This plot indicates that the ellipsoid model is a reasonable model of the envelope in terms of the summed Fourier intensities, for minimum resolutions less that 25˚A. We therefore used for Q a spherical shell between 25˚A and 7˚A resolution.
5 10 15 20 25 30 35 40
0 500 1000 1500 2000 2500 3000 3500 4000
Lowest Resolution in Q′ (Angstroms)
Square root of energy in Q
′
[image:4.612.313.506.31.180.2]Molecular Envelope Elliptical Model
Figure 2: Square root of the energy inQas a function of the lowest resolution.
4.2
Image space projection
We combine the binary and fill fraction constraints and the projection onto the intersection of these two sets, denotedPBF, is given by
PBFxj=
0 xj∈/S(f)
1 xj∈S(f), (14)
where S(f) is the set of the f N largest values of
x.
A rigorous projection onto the set of connected im-ages would result in a tenuous as opposed to a com-pact image [6]. A suitable approximate projection is to retain objects larger than a threshold size, de-notedl, and remove the remaining objects [6]. This projection encourages connectivity and compact-ness. The connectivity projection, denoted PC, is then defined by [6]
PCxj =
1 if j∈L(l)
0 if j /∈L(l), (15)
where L(l) denotes the set of pixels that belong to objects with more than l pixels. Defining the threshold by l =αCf N, with the constant αC 0.1, was found to be effective. Since the image is compact and connected, the maximally restrictive 4-pixel (2D) or 6-pixel (3D) neighbourhood is used. Because the other constraints cannot distinguish between circularly shifted versions of each image, the neighbourhoods also wrap around the edges of the unit cell for consistency.
The simply connected projection, denoted PSC, is implemented as
PSCx= 1−PC(1−x), (16)
In principle, the required crystallographic symme-try, if applied initially, will be exactly retained as the iterations proceed. However, in practice this may drift due to rounding errors. Therefore, the correct crystallographic symmetry is retained by applying the appropriate relationships to the Fourier amplitudes and phases at each iteration.
The full image space projection, denoted PI, is then given by
PIx=PSCPCPBFx. (17)
This projection tends to be enforce connectivity and compactness, and as the algorithm proceeds, the image eventually becomes a single object.
Iff is exactly equal to 0.5, there will be a unique-ness problem as described above, and the algo-rithm can converge to the negative of the solution. Nevertheless there is still convergence, and it will generally be evident that the negative of the enve-lope has been obtained. However, if f is close to but not equal to 0.5, the iterates can be held in the bowl of attraction created by the constraints, but be unable to converge due to the fill fraction constraint, thus slowing convergence. This effect was found to be significant in some cases and was overcome by a modification to the algorithm as follows. Every p iterations the image is inverted and the algorithm continued for q iterations us-ing both images, after which the image with the smallest Fourier amplitude error is selected and the algorithm continued. The values p= 300 and q= 50 iterations were found to be suitable.
5
Results
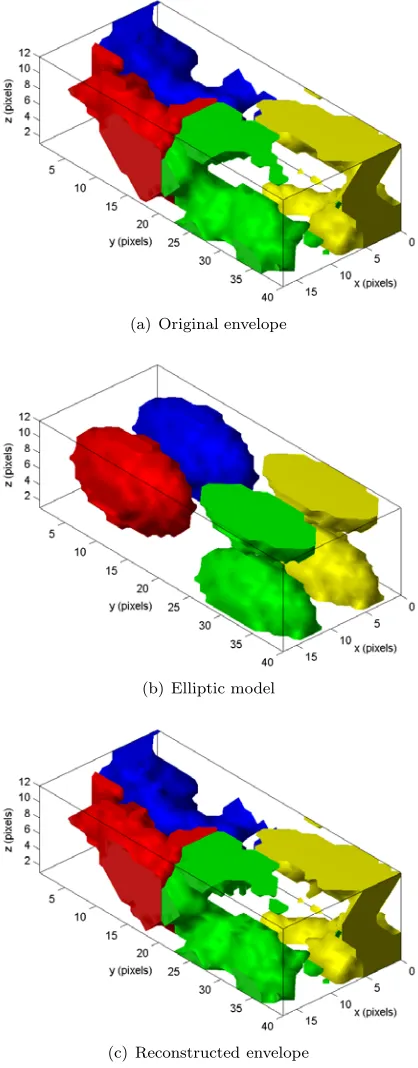
The DM algorithm was implemented using the pro-jections PA and PI as described above. The al-gorithm was tested by simulation on a molecular envelope derived from a solved protein structure taken from the Protein Data Bank (PDB). The protein used was the Alkaline protease from P. aeruginosa [8]. The crystal lattice is orthogonal (orthorhombic) with unit cell dimensions 77.2× 176.7×51.1˚A. There are four molecules in each unit cell related by crystallographic symmetry (sp-ace group P212121). The molecular envelope was derived using standard methods [9] with an aver-aging radius of 8˚A. The fill fraction is f 0.35. The envelope was represented on an 18×40×12 sampling grid which gives a grid spacing of 4.3˚A and approximately 9×10³degrees of freedom. The scale factor was set at 0.01, and when estimated as described gave a value of about 0.0095, depending on the noise. The envelope within the unit cell is shown in Fig. 3(a) where the four molecules are represented by different grey levels for clarity. The elliptic model used to calculate the scale factor is
shown in Fig. 3(b). The Fourier magnitudes were calculated by the DFT, the scale factor estimated and applied, 2% Gaussian noise added, and the magnitude data retained within a resolution shell between 40 and 7˚A. The algorithm was started with a random binary image with the correct fill fraction.
(a) Original envelope
(b) Elliptic model
[image:5.612.311.520.113.647.2](c) Reconstructed envelope
Figure 3: Initial, actual, and reconstructed protein envelopes.
105iterations. The normalized rms error between the measuredMjand reconstructed|Xj|/sFourier magnitudes was calculated at each iteration to mon-itor convergence. The DM algorithm tended to wander around the solution space before converg-ing quickly to the solution, and then movconverg-ing away again, since there was no true intersection due to the noise. The solution with the smallest rms error was used to calculate the solution by applying the constraintPI. The Fourier space and image space normalized errors were approximately 13%. The reconstructed envelope is shown in Fig. 3(c) and is seen to be a quite faithful representation of the true envelope.
6
Conclusions
Reconstruction of a compact binary image from limited Fourier amplitude data is expected to have a unique solution. An iterative projection algo-rithm is developed to reconstruct the molecular envelope of a protein from undersampled Fourier amplitude data of the envelope. The amplitude data in the Fourier domain are used as a constraint, and the binary, fill fraction, and connectivity con-straints are combined to form an appropriate im-age domain projection operator. The algorithm is shown to be effective for synthetic data using a real protein envelope and a realistic noise level.
7
Acknowledgements
We are grateful to Dr. Richard Kingston, Uni-versity of Auckland, for discussion. VLL is the recipient of a New Zealand Tertiary Commission Top Achiever Doctoral Scholarship.
References
[1] R. P. Millane, “Phase retrieval in crystallogra-phy and optics,” J. Opt. Soc. Am. A, vol. 7, pp. 394–411, 1990.
[2] V. Elser, “Phase retrieval by iterated projec-tions,” J. Opt. Soc. Am. A, vol. 20, pp. 40–55, 2003.
[3] R. P. Millane, “Iterative projection algorithms for solving inverse problems,” Proc. Oceans 2003, pp. 2714–2719, CD-ROM, IEEE, 2003.
[4] J. Drenth,Principles of X-ray Crystallography. Springer-Verlag, 1994.
[5] V. L. Lo and R. P. Millane, “Iterative pro-jection algorithms with a binary constraint,”
Proc. Image and Vision Computing New Zea-land, pp. 109–114, 2007.
[6] V. L. Lo and R. P. Millane, “Reconstruction of compact binary images from limited fourier amplitude data,” J. Opt. Soc. Am. A, vol. 5, pp. 277–283, 2008.
[7] C. W. Carter, K. V. Crumley, D. E. Cole-man, F. Hage, and G. Bricogne, “Direct phase determination for the molecular envelope of tryptophanyl-trna synthetase from bacillus stearothermophilus by x-ray contrast varia-tion,” Acta Cryst., vol. A46, pp. 57–68, 1990.
[8] H. Miyatake, Y. Hata, T. Fujii, K. Hamada, K. Morihara, and Y. Katsube, “Crystal-structure of the unliganded alkaline protease from pseudomonas-aeruginosa IFO3080 and its conformational-changes on ligand binding,” J. Biochemistry, vol. 118 (3), pp. 474–479, 1995.