warwick.ac.uk/lib-publications
Permanent WRAP URL:
http://wrap.warwick.ac.uk/111326/
Copyright and reuse:
This thesis is made available online and is protected by original copyright.
Please scroll down to view the document itself.
Please refer to the repository record for this item for information to help you to cite it.
Our policy information is available from the repository home page.
SOME EXPERIMENTS WITH A MULTISECTORAL INTERTEMPORAL
OPTIMIZATION MODEL FOR SRI LANKA
By
DELAPALAGE STEPHEN WIJESINGHE
THESIS SUBMITTED FOR THE DEGREE OF DOCTOR
OF PHILOSOPHY TO THE UNIVERSITY OF WARWICK.
DEPARTMENT OF ECONOMICS
UNIVERISTY OF WARWICK
COVENTRY
In this study a Multisectoral Intertemporal Optimization model is
posited and used to study the optimal*development path for Sri Lanka (under
certain conditions and assumptions) so as to attempt to identify the binding
constraints for the country's development. Experiments are carried out on the model to examine the relative importance of domestic savings and foreign
exchange and also to highlight the distributional implications of economic
development along the optimal path. In addition an attempt is made to examine the use of formal techniques for planning the sectoral and temporal
allocation of resources for development through an investigation of the
feasibility of Sri Lanka's Public Investment Programme 1980-1984.
Economy-wide development planning models of an optimization nature
have mostly been concerned with the optimization of a single objective such as consumption or income. However, development planning can better
be considered as a problem of decision making with multiple objectives. Yet, no attempt has been made to analyse the multiple objective situation
formally, except for a few analytical models of dual economy which took
the distributional objective into account. In this respect, the present
study represents an improvement over the existing models. First, considering
only the two objectives of consumption and its distribution, a social welfare function is specified and used as the objective function of the optimization
model, and second, recent developments in Multiple Objective Decision methods
are employed to resolve the problem imposed by the multiplicity of objectives.
The results of the experiments shed reasonable doubt on the feasibility of the Public Investment Programme 1980-1984. It is shown that the
importance of additional domestic savings is limited as the economic development of Sri Lanka is highly constrained by the lack of foreign
exchange. It also is shown that on an optimal path of development,
objectives of economic growth and distribution are not conflicting;
development along an optimal path does not change the relative income shares
of the rich and the poor substantially. It is suggested that fiscal measures can be used to improve the income share of the poor and pointed
i
TABLE OF CONTENTS
List of Tables
Acknowledgements
Declaration
Page
CHAPTER
1 Introduction 1
1.1 Basic Features and Problems of the Economy
of Sri Lanka 2
1.2 Economic Policy Reforms in 1977 9
1.3 Nature and the Scope of the Study 12
1.4 Organization of the Study 23
2 Economy-Wide Models of Development Planning 25
2.1 Introduction 25
2.2 Aggregate Consistency Models 26
2.3 Multisectoral Consistency Models 31
2.3.1 Static Open Loop Models 32
2.3.2 Closing the System for Investment 34
2.3.2.1 Static Version 35
2.3.2.2 Dynamic Version 38
2.3.3 Closing the System for Consumption 42
2.4 Computable General Equilibrium (CGE) Models 45
2.5 Multisectoral Optimization Models 49
Page CHAPTER
3 A Multisectoral Intertemporal Optimization Model
for Sri Lanka 55
3.1 The Model 61
3.1.1 Objective Function 61
3.1.2 Income Relationships 72
3.1.3 Production Accounting Relationships 74
3.1.4 Capacity Constraints 76
3.1.5 Investment Requirements 77
3.1.6 Labour Constraints 78
3.1.7 Balance of Payments Constraints 79
3.1.8 Composition of Imports 79
3.1.9 Savings Constraints 81
3.1.10 Initial Capital Stock and Capital-in-Process 82
3.1.11 Terminal Requirements 83
3.2 Solutions and Shadow Prices 85
4 A Data Base for the Sri Lanka Model 107
4.1 Data Requirements 107
4.2 Classification of Sectors 109
4.3 Production Data 112
4.3.1 Interindustry Flow Coefficient Matrix 113
4.3.2 Capital Coefficient Matrix 116
4.3.3 Lag Proportion Matrices 118
4.3.4 Imports 120
4.3.5 Labour Requirements and Labour Force Available 122
4.3.6 Stock Coefficients 125
4.4 Data for Estimation of Incomes 125
4.4.1 Income Coefficients for the Poor and the
Rich Households and for Other Institutions 128
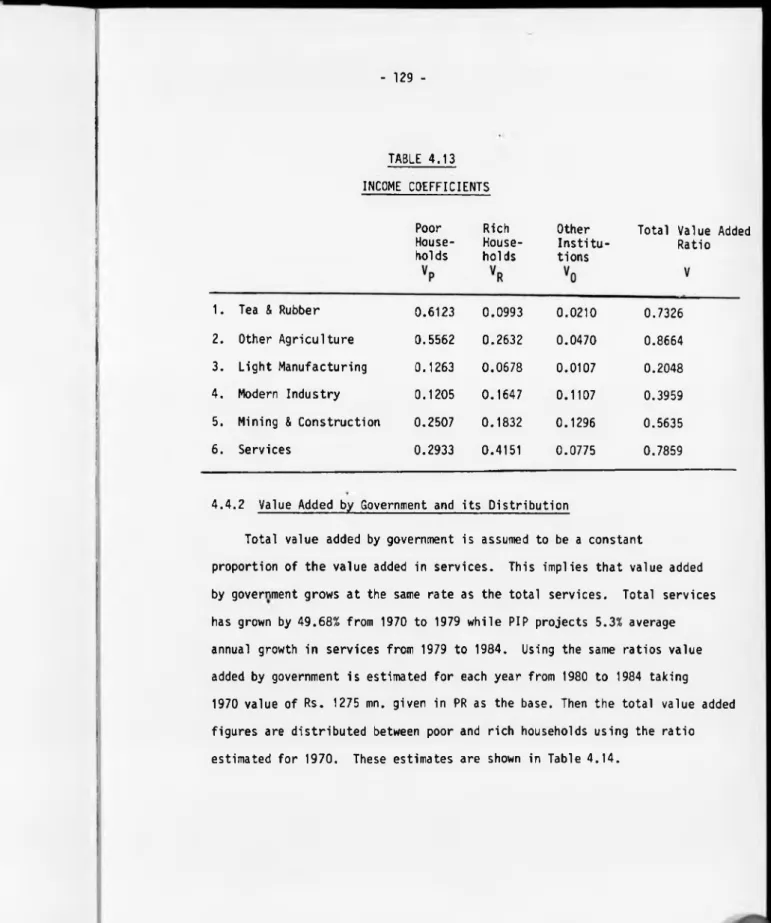
4.4.2 Value Added by Government and its Distribution 129
4.4.3 Number of Poor and Rich Households 130
4.4.4 Government Revenue 131
4.5 Demand Data
4.5.1 Consumption by Poor and Rich Households 132
4.5.2 Government Consumption 133
4.5.3 Exports 134
4.5.4 Public Investment on Social and Economic
Overhead Capital 141
4.5.5 Net Foreign Capital Inflows 143
4.6 Initial and Terminal Capital Stocks 144
4.7 Concluding Remarks 149
5 Basic Features of the Model Solutions 151
5.1 Introduction 151
5.2 Gross Domestic Outputs 154
5.3 Capital Stocks 162
5.4 Imports 175
6 Macro Economic Comparisons of the Reference and
Other Alternative Solutions 180
6.1 Introduction 180
CHAPTER
Page
6.2 Reference Solution 182
6.3 Alternative Reference Solution 185
6.4 Availability of Domestic Savings Increased by
Removing Income Subsidy on the Poor 191
6.5 Sensitivity of the Results for changes in the
Savings Ratios 197
6.6 Sensitivity of the Results to changes in the
Availability of Foreign Financial Assistance 202
6.7 Exports of Other Agriculture Increased by Rs.250
mn in each year at market prices 210
6.8 Sensitivity of the Results to changes in
Non-Competitive Import Coefficients 217
6.9 Sensitivity of the Results for a Reduced Level
of Targets for Terminal Capacities 221
7 Distributional Implicationsof the Model Solutions 227
7.1 Reference Solution 227
7.2 Alternative Reference Solution 233
7.3 Solution with Reduced Targets 237
7.4 An Overview of the Results so far 240
7.5 Solution with No Taxes and Subsidies on
Households 243
7.6 Sensitivity of the Results for Some Changes
in the Income Coefficients for the Poor
V
-8 Multiple Objective Decision Methods 261
8.1 Introduction 261
8.2 Possible Objectives of Economic Development 263
8.3 Importance of Multiple Objective Approach 271
8.4 General Features of Multiple Objective Decision
Methods 273
8.5 Basic Concepts in MOD Methods 275
8.5.1 The Pay-Off Matrix 275
8.5.2 Efficient Solutions 278
8.6 Generating Techniques 279
8.7 Compromise Solutions 284
8.8 Interactive Multiple Objective Programming
Methods 288
8.8.1 A Brief Survey of Interactive Methods 290
8.8.2 Interactive Programming by Imposing
Side-Conditions 294
8.9 Hierarchical Optimization Method 297
8.10 Concluding Remarks 300
9 Multiple Objective Decision Methods : An Application
in Economy-Wide Development Planning 302
9.1 Evaluation of each of the Objectives
Individually 305
vi
-CHAPTER
9.2 A Unified Solution : Hierarchical Programming
Method 316
9.3 A Unified Solution : Interactive Programming
Method 327
9.4 A Note on the Distributional Implications 338
10 Conclusions 341
10.1 Public Investment Programme 1980-1984 341
10.2 Domestic Savings and Foreign Exchange 344
10.3 Distributional Implications 350
10.4 Multiplicity of Objectives 351
10.5 Extension of this Study 353
• Page
vu
-LIST OF TABLES.
TABLE PAGE
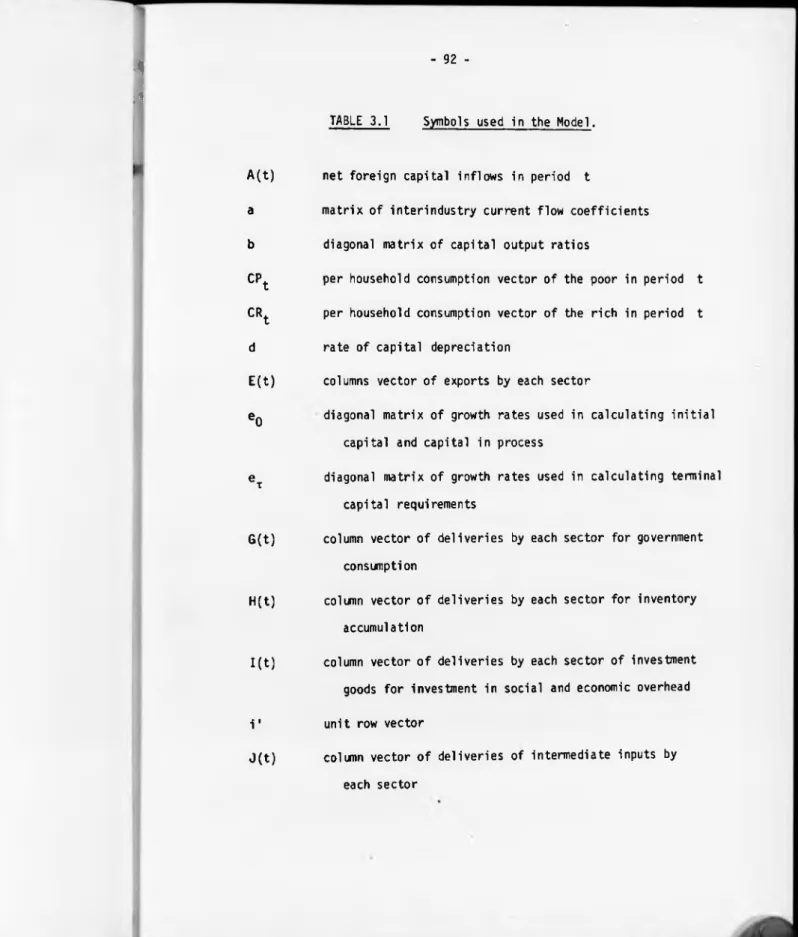
Symbols used in the Model
The Model
The Model after Substitutions
Tableau for the Model
4.1 Correspondence between 12 Sectors and 48 Sectors of
Production Activities in Pyatt and Roe Study 111
4.2 Sri Lanka Social Accounts Matrix (SAM) 114 ■5*5 ■
4.3 Modified Social Accounts Matrix for Sri Lanka 115
4.4 Interindustry Flow Coefficient Matrix 116 1
4.5 Capital Coefficient Matrix
117
1
R, *• •'•V'4.6 Capital Proportion Matrix P 118 I
lx 1..
4.7 Lag Proportion Matrices P 1 and P2 119 11 ‘V ■**
: 4.8 Non-Competitive Imports and Non-Competitive
Import Coefficients, m , for 1970 and 1979 121 1I
4.9 Employment and Labour Output Ratios i , in 1970 123 1li
r
4.10 Projected Labour Force 1980-1984 124 1■*V ' f
4.11 Government Employees 127 115 *
4.12 Average Incomes 127 1
4.13 Income Coefficients 129 I
4.14 Value Added by Government and its Distribution 130 I IIP
-4.15 Tax Rates 131 I
4.16 Consumption Proportions out of Disposable Incomes 133
J
TABLE 4.18 4.19 4.24 4.25 5.2 5.3
Export Projections given in the Public Investment
Programme 135
Exports: Annual Average Growth Rates (in real terms)
Implicit in the Public Investment Programme 136
Average Annual Price Changes 137
Composition of Commodity Exports - 1979 138
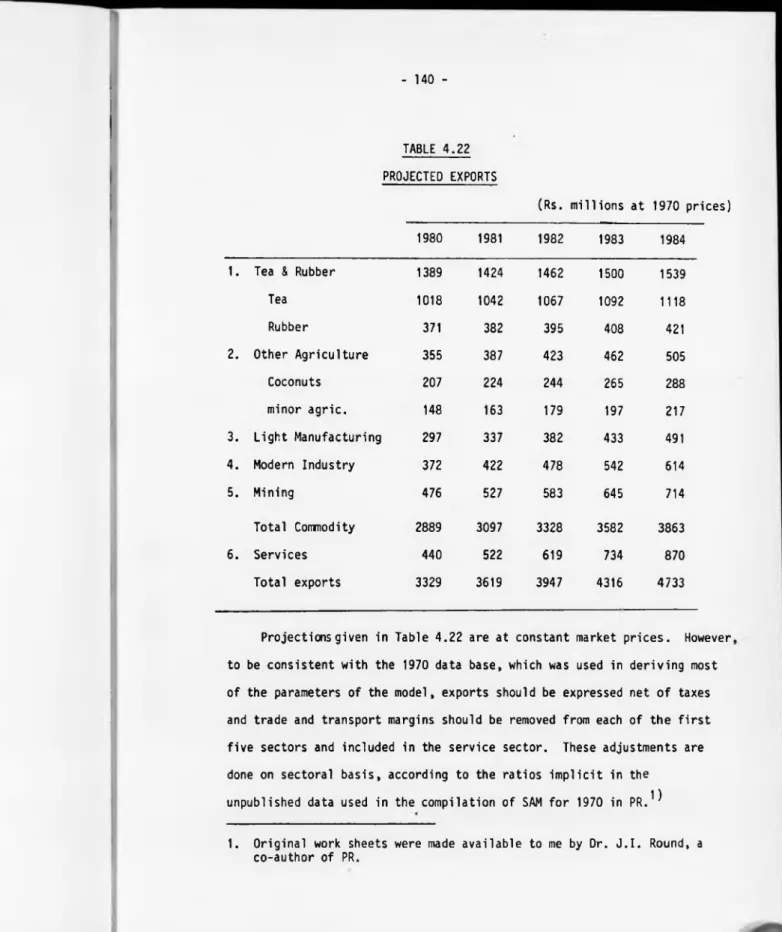
Projected Exports 140
Projected Exports at Producer Prices, E(t) and
Export Tax, t^E(t)
Projected Deliveries for Social and Economic
Overhead Investment
Gross Domestic Product (New Series) - Central Bank's
Estimates for 1970, 1979 and Implied PIP Projections
for 1984
Gross Value of Output in 1970, 1979 and 1984
Gross Domestic Outputs and Sectoral Growth Rates
in the Reference Solution 155
Gross Domestic Outputs and Sectoral Growth Rates
in the Alternative Reference Solution 158
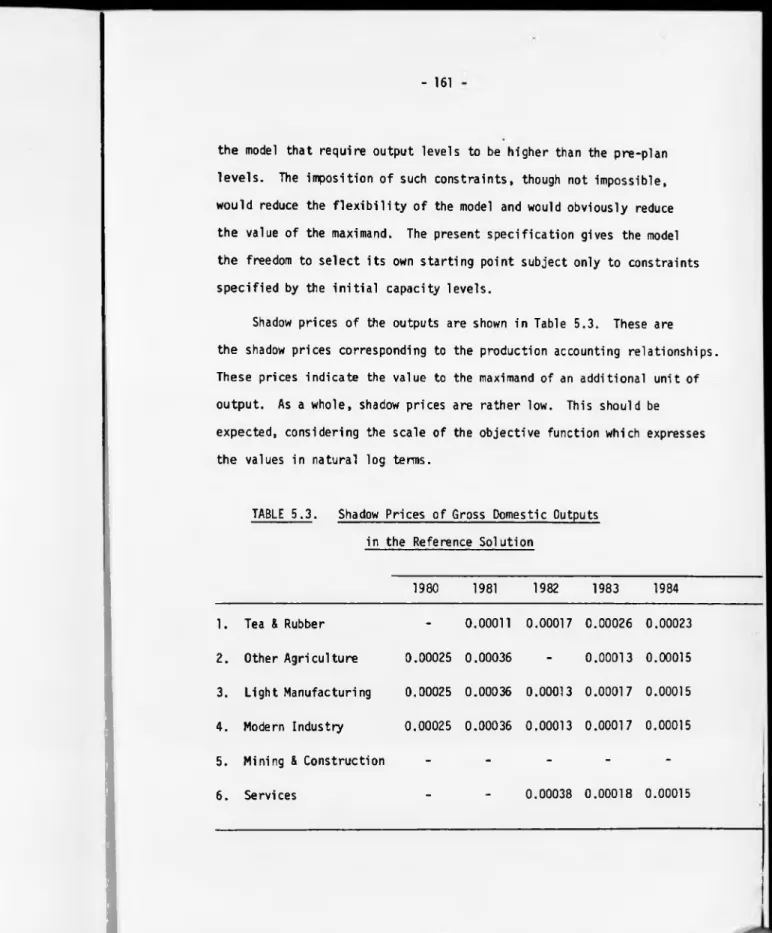
Shadow Prices of Gross Domestic Outputs in the
Reference Solution 161
Available Capital Stock in the Reference Solution 163
Capital Stock Used in the Reference Solution 164
1 4 1 I' ■]
w
• ■ 1 1
1 4 3 1
IB
1 bE*; «. l r 4 « < '
I i
1 4 6 1
1 4 9 1
1 |< I f 1
’4
- ix
5.6 Ratio of Capital Stock Used to total capital
in the Reference Solution 165
5.7 New Capital Added in the Reference Solution 166
5.8 Available Capital Stock in the Alternative
Reference Solution 167
5.9 Capital Stock Used in the Alternative Reference
Solution 168
5.10 Ratio of Capital Stock Used to total capital in the
Alternative Reference Solution 169
5.11 New Capital Added in the Alternative Reference
Solution 170
5.12 Shadow Rental Prices of Capital in the Reference
Solution 173
5.13 Shadow Prices of New Capital in the Reference
Solution 174
5.14 Ratio of Completed Initial Capital in Process to
Initially Available Capital in Process in the
Reference Solution 176
5.15 Details of Imports in the Reference Solution 177
5.16 Details of Imports in the Alternative Reference
Solution 178
6.1 Shadow Price of Foreign Exchange in the Reference
Solution 182
6.2 Macro Economic Aggregates of the Reference Solution 183
6.3 Macro Economic Aggregates of the Alternative
Reference Solution
6.4 Macro Economic Aggregates of the Solution with No Public
Overhead Investment and No Income Subsidy on the
Poor Households
6.5 Macro Economic Aggregates of the Solution with No Public
Overhead Investment and Reduced Ratio of Savings by
the Poor Households
6.6 Macro Economic Aggregatesof the Solution with No Public
Overhead Investment when Expected Foreign Financial
Inflows are Reduced by 47.81% per year
6.7 Macro Economic Aggregates of the Solution with No Public
Overhead Investment when Expected Net Foreign Financial
Inflows are Increased by Rs 250 mn per year
6.8 Value of the Objective Function at Different levels
of Foreign Financial Assistance
6.9 Macro Economic Aggregates of the Solution with No Public
Overhead Investment when Exports of Other Agriculture
Increased by Rs 250 mn p.a. at market prices
6.10 Changes in the Key Macro-Economic Aggregates when the
Availability of Foreign Exchange is Increased by
Rs 250 mn per year
6.11 Discounted Sum of Outputs in the Solutions with an
increased Availability of Foreign Exchange through
xi
TABLE PAGE
6.12 Macro Economie Aggregates of the Solution with
No Public Overhead Investment when Non Competitive
Import Coefficients are fixed at Estimates made
for 1970 218
6.13 Competitive Imports 219
6.14 Discounted Sum of Outputs in the Solutions with 1979
and 1970 Non Competitive Import Coefficients 220
6.15 Macro Economic Aggregates of the Solution with No
Public Overhead Investment and Reduced Targets 222
6.16 Macro Economic Aggregates of the Solution with 100% of
Public Overhead Investment and Reduced Targets 223
7.1 Incomes and Utilities of the Poor and the Rich
Households in the Reference Solution 228
7.2 Incomes and Utilities of the Poor and the Rich Households
in the Alternative Reference Solution 234
7.3 Incomes and Utilities of the Poor and the Rich Households
in the Solution with No Public Overhead Investment and
Reduced Targets 238
7.4 Incomes and Utilities of the Poor and the Rich Households
in the Solution with No Public Overhead Investment and
No Taxes and Subsidies on Households 246
7.5 Comparison of Results in the Solutions with and without
7.6 Discounted Sum of Outputs in the Solutions with and
without Income Taxes and Subsidies on Households
7.7 Incomes and Utilities of the Poor and the Rich
Households in the Solution with No Public Overhead
Investment and No Taxes and Subsidies on Households,
when the Income Coefficient for the Rich in Modern
Industry Increased by 25% Reducing the corresponding
Coefficient for the Poor
7.8 Comparison of Results under the Two Different
Technologies in Modern Industry
7.9 Incomes and Utilities of the Poor and the Rich Households
in the Solution with No Public Overhead Investment and
No Taxes and Subsidies on Households when Income
Coefficients of the Poor and the Rich in Other
Agriculture are Interchanged
7.10 Comparison of Results under the Two Different
Technologies in Other Agriculture
9.1 Pay-off Matrix
9.2 Sectoral Composition of Domestic Output under the
Individual Optimization of the Objectives of Total
Income, Poor Income and Total Employment
9.3 Sectoral Composition of Domestic Output under the
Individual Optimization of the Objectives of Total
Income, Industrial Output and Balance of Payments TABLE
249
252
255
257
260
305
309 PAGE
- xiii
9.4 Hierarchical Programming Results with 6-| = = 0.96
9.5 Sectoral Composition of Domestic Output
at each Stage of the Hierarchical Programming
with = e2 = 0.96
9.6 Hierarchical Programming Results with B-| = B2 = °-98
9.7 Sectoral Composition of Domestic Output at each
Stage of the Hierarchical Programming with
3-, = e2 = 0.98
9.8 Interactive Programming Results
9.9 Distances between Maximum and Minimum Attainable
Values of the Objectives
9.10 Sectoral Composition of Domestic Output in the
Fourth Compromise Solution
9.11 Income Shares of the Poor Households in the
Different Approaches of Multiple Objective
Programming TABLE
320
321
323
325
329
335
337
Acknowledgements
In presenting this thesis, I would like to acknowledge my gratitude
to Dr. J.I. Round, my major supervisor, for his inspiration and invaluable
guidance throughout the study; and to Professor N.H. Stern and Dr. S.K.
Nath, for frequent discussions and constant encouragement. I am most
indebted to them for their generous assistance.
I am particularly grateful to my employer, the Central Bank of Ceylon,
for granting me necessary financial assistance and leave to undertake this
study; and to the British government for granting me fee reductions under
the Overseas Research Students-Fees Support Scheme.
The computer time for the study was supported in full through the
facilities of the Computer Unit of the University of Warwick. My thanks
are due to the staff of the Computer Unit, especially to Mr. Keith Halstead
for helping me on many occasions.
Finally my appreciation is extended to Mrs. Peta McAllister and her
XV
Declaration
I declare that this thesis is based on original research
carried out by me and that the research material has not been
published elsewhere nor presented to any other institution.
Research work of other authors whenever used or referred to have
INTRODUCTION.
In this study a Multisectoral Intertemporal Optimization model
is posited and used to study the optimal development path for Sri Lanka
(under certain conditions and assumptions) so as to attempt to identify
the binding constraints for the country's development. A multiplicity
of development objectives can be incorporated into the optimization model.
This multiplicity of objectives can create certain problems and various
methods are investigated to overcome them. Experiments are carried out
on the model, to examine the relative importance of domestic savings
and foreign exchange and also to highlight the distributional implications
of economic development along the optimal development path.
The aims of this introductory chapter are, first, to introduce the
basic features and problems of Sri Lankan economy which have a direct
bearing on the model design, and secondly, to introduce the nature and
2
-1.1 Basic Features and Problems of the Economy of Sri Lanka.
Sri Lanka has been rated highly among developing countries on
her achievements in the field of social welfare. It is well-known
that she has been a forerunner in the provision of social welfare.
Sri Lanka has a system of free education and health services and
consumer subsidies which is unmatched anywhere in the South Asia.^
Successive Governments in Sri Lanka have been committed to continuing
a policy of providing extensive welfare services. According to one 21
writer, ' Sri Lanka occupies a unique position in the world economy
because, except for a few countries such as Sweden, the welfare services
experienced by Sri Lanka continuously since independence in 1948 are
unparalleled. This scheme of social welfare services has achieved its
intended effects of raising the health and educational standard of the
community and improving the living standard and distribution of incomes.^
However, there has not been a significant increase in the productive
capacity and the slow rate of growth in output has imposed a formidable
constraint on the country's ability to actively pursue its welfare services.^
1. Jones and Selvaratnam (1972 pi).
2. Karunatilake (1975).
3. "Sri Lanka has an exceptionally good record in relation to its per capita income, on life expectancy, infant mortality, fertility and literacy .... In each case Sri Lanka's social indicators relative to its income, were the best among 59 countries". Isenman (1980 p.239). According to Ahluwalia et al (1979), Sri Lanka was the only country of the thirty six countries for which data were available where the marginal share of income accuring to the bottom 60% of the population
(between 1963 and 1973 in the case of Sri Lanka) was higher than 50%.
In 1980 the Gross National Product (GNP) of Sri Lanka was an
estimated Rs 61814 million at current factor cost prices^. With a
population of 14738 thousand, this represents a per capita income of
only Rs 4194, that is £108. By any standard, this level of income is
low, particularly as real (at 1970 prices) GNP in 1980 was only
Rs 19405 million which represents a per capita income of only Rs 1317,
that is only £59.^ In the period 1970 to 1980, real GNP grew at an
average annual rate of 4.33% while the population grew at an average
annual rate of 1.65%, representing only 2.68% average annual growth rate
in per capita real GNP. This rate was highly affected by the relatively
rapid developments in the economy after the introduction of new economic
policies in November 1977."^ Until 1978, growth rate was even lower, in
the period 1970-77, the average annual rate of growth in per capita
real GNP was only 1.49%. The growth performance of Sri Lanka,
particularly until 1978, has really been a disappointment. As Morawetz
(1980) reported, in the period 1950-75, per capita real GNP grew only at
an average annual rate of 1.6% which is well below the average annual
growth rate of 3.0% recorded for all developing countries1234 ^ as a whole.
Under the British rule, export-oriented plantation agriculture was
introduced into the Sri Lankan economy and ever since it has been an
economy dependant on the rest of the world. As a dependant economy it
1. Data referred to in this chapter are, unless mentioned otherwise, those estimated by the Central Bank of Ceylon and published in its Annual Reports and Review of the Economy.
2. This is at the exchange rate implicit under the Foreign Exchange Entitlement Certificate Scheme in 1970, which was 55% higher than the official parity rate.
has high ratios of exports and imports to Gross Domestic Product (GDP).
As Dahanayake (1977 p.10) has reported the export share of GDP in 1950
was 38.1% and has tended to decline over time, largely due to the absence
of any significant growth of export earnings of the country. This share
dropped to 22.33% in 1972, but gradually improved up to 33.81% by 1977
reflecting largely the favourable prices received for the main export
commodities.
The Sri Lankan economy highly depends upon three primary connodities,
tea, rubber and coconuts, for its foreign exchange earnings. In 1970,
more than 88% of the total commodity exports were from these three major
exports. In recent years, there seems to have been a tendency for the
share of these major exports to decline. In 1977 it was 74.27% and
declined to 57.85% by 1980. However, it is still a substantial share
and therefore the economy has to depend quite highly on these three major
exports. Yet, the development of these three commodities is rather dis
appointing. The volume of exports of these commodities has tended to
decline, even though there has been some improvement in prices since
early 1970's. In recent years the export of industrial products seems
to have grown at a relatively higher rate. Their share of total commodity
exports rose to 31.82% in 1980 compared to 14.18% in 1977. However, a
large portion of this consists of Textiles and Garments (10.50%), and
Petroleum products (17.36%). It is a good sign that the economy is
diversifying its exports and reducing the dependency on three major
textiles and garments and petroleum products could be very low, as their
import content is substantially high.1 2)
Slow growth in export earnings represents a formidable problem
for Sri Lankan economy as it restricts the import capacity of the country.
The economy depends on imports not only for its requirements of intermediate
and investment goods but also for essential consumer goods. High dependency
on imports is evidenced by a high ratio of imports to GDP. After the mid
fifties the import ratio has tended to exceed the export ratio of the
economy. In the 1970's it was only in 1977 that the import ratio fell
below the export ratio.^ Since 1977 with the liberalization of imports,
the ratio of imports has been increasing substantially, with a very high
ratio of 55.07% in 1980 compared to exports ratio of 32.69%.
An important feature in Sri Lanka's imports has been the high
proportion of consumer goods in total cormiodity imports. In the period
1970-75, with the exception of 1974, consumer goods formed more than 50%
of the total commodity imports; and of these consumer goods, three main
foodstuffs - rice, flour and sugar - alone amounted to more than one
quarter of the total commodity imports. Since 1978, the share of
consumer goods has been declining thereby representing higher shares of
intermediate and investment goods. In 1980, the share of consumer goods
1. "... in view of high prices to be paid for crude oil imports, the net foreign exchange gain from bunkering and naphtha exports are not that conspicuous in relation to gross earnings from such exports. Similar situation prevails with respect to the exports of textiles and garments whose imports content is substantial." Central Bank of Ceylon (1980 p.152).
6
-was 29.4% of which rice, flour and sugar -was 13.2%. This recent
tendency is not due to a reduction in the expenditure of consumer goods
imports, but is due to the increases in imports of intermediate and
investment goods. Rationalization of the consumer subsidy programne
made it possible to keep the growth of imports of consumer goods at a
lower rate, while the increased level of economic activity recorded
under the new economic policies required a high growth in imports of
intermediate and investment goods.
As the economy is so highly dependent on imports, it is vulnerable
to the movements in international commodity prices. Since 1955 - until
about 1972, there had been a steady downward trend in both tea and rubber
prices while the import prices continued to rise, leading to a massive
deterioration in the terms of trade. Since about 1972, there has been a
significant rise in the prices of Sri Lanka's major exports, but it has
been followed by a sharp rise in the prices of essential imports, under
lining the vulnerability of Sri Lankan economy to the developments in
commodity market. The termsof trade (with 1978 = 100) fell to 57 in
1975 compared to 94 in 1972; it improved to 101 in 1977 but fell steadily
to 58 in 1980.
Slow growth in export earnings relative to the expenditures on
imports caused balance of payment difficulties which has been a major
problem for the economy since the late 1950's. Since 1957, the current
account of the balance of payments has been in deficit except only in
quota restrictions and a complete ban on imports of certain luxury
goods. These controls prevailed until the liberalization of imports
in November 1977. The controls had been successful in restricting
imports in the aggregate, but it caused a significant deterioration in
the standards of consumption and by restricting the availability of
intermediate imports hindered the development of manufacturing industries,
despite the incentives associated with higher level of protection.
As pointed out in Pyatt et al (1973 pp. 31-32) Sri Lanka's social
welfare programme interacted with the balance of payment position in
three ways. First by depressing the incentives for increased food
production it contributed to a large import bill for basic foodstuffs.
Second, by diverting investment into projects with long construction period
and low productive returns, e.g. schools, it slowed the expansion of
manufacturing output. Finally by boosting real incomes, the welfare
programme generated an 'artificially' high level of demand for consumer
goods which reacted back in balance of payments.
In the face of these balance of payments difficulties, the economy
could not maintain a reasonable level of investment and domestic savings.
In the period 1970-77, although the ratio of investment to GDP had been
fluctuating it remained low. It was 18.95% in 1970 but dropped to 13.74%
in 1973 and gradually rose to 16.21% in 1976. It was 14.45% in 1977, but
since 1978 it has been increasing steadily recording 35.70% in 1980. The
8
-but it has remained well below the investment ratio, except in the years
1965 and 1977 when the current account of the balance of payment was in
surplus. In 1980, the savings ratio was 13.41% compared to 14.18% in
1970. Even though the investment ratio has been increasing since 1978,
there has been no improvement in the savings ratio in spite of the fact
that Sri Lanka has made genuine attempts to raise the level of savings.
In order to encourage savings, the branch net work of the commercial
banks was expanded and the National Savings Bank was established in
1972 which amalgamated the functions of a number of small savings
institutions. Interest rates were raised in 1972, 1977 and again in
1980.
The effects of the low ratio of investment and savings were reflected
in slow rate of growth in output and high rate of unemployment in the
labour force.
Unemployment has been a continuing problem in the economy since the
late 1950's. Between 1963 and 1973, the estimated unemployment rate in
the workforce increased from 13.8% to 24.0%.^
These estimates simply indicate the magnitude
of the problem. Preliminary data of the Consumer Finance and
Socio-21
Economic Survey of 1978 indicated a drop in unemployment rat« to 15.3%, '
yet this still is a substantial rate and therefore unemployment remains
a critical problem in the economy. A high level of public expenditure on
education has compounded the problem by making the labour force highly
educated while the developments in the economy were not sufficient to
absorb it, thus creating a high rate of unemployment among educated
peopled ^
To sum up, Sri Lanka has managed to achieve a remarkable position
in the field of social welfare without a reasonable growth in real
national product. Therefore there has been a failure to resolve the
interrelated problems of balance of payments and unemployment.
1.2 Economic Policy Reforms in 1977.
Until late 1977, economic policies pursued by Sri Lanka were mostly
inward looking and socialist o r i e n t e d . M a i n t e n a n c e of social welfare
services received high priority, and therefore in the interest of
consumers, prices of a number of commodities were controlled and prices
of imported goods were kept artificially low by maintaining an overvalued
exchange rate. An overvalued exchange rate implies that exports were
discouraged. However, cheap imports could not be made freely available
because the availability of foreign exchange was limited. Therefore an
excessive system of import and exchange controls was imposed. The final
outcome of this, as Dahanayake (1979 p. 36) pointed out, was a misallocation
of resources as the prospective industrialists had to either lobby and bribe
for their quotas or abandon new investments.
1. e.g. In 1973 the estimated rate of unemployment among those with G.C.E. (O.L.) was 47.4% and that with G.C.E. (A.L.) was 44.4%. Respective figures in 1978 was 29.2% and 31.7% - see Central Bank of Ceylon (1979 p. 42 Table 1.15).
2. See Dahanayake (1977) for a review of economic policies in the period 1956-72. There was not any major change in economic policies until late 1977.
The present government which came into power in July 1977,
introduced a package of policies in November 1977, which could be
considered as growth and employment oriented. This policy package
included:^'
- freeing the economy from most of the controls that prevailed
earlier, in order to promote competition and ensure efficiency
in resource allocation and production, i.e.
i. the liberalization of imports and payments
ii. the lifting of price controls and greater reliance
on the market mechanism
iii. the removal of excessive admi’strati ve controls
- floating of the exchange rate
- extensive incentives to foreign and local private capital to
participate in domestic investment
- rationalization of consumer subsidy programme to confine
subsidies to the low income groups and thereby to minimize
the public expenditure thereon
- interest rate reforms to encourage greater savings.
These policies were introduced to revitalize the economy. Their
aim was economic growth and employment generation largely through private
sector participation. It is still too early to evaluate the long and
medium term effects of these policies. However, available data suggests
an increased level of activity in the economy. It recorded a relatively
high growth rate of 8.20% in 1978, 6.23% in 1979 and 5.52% in 1980 in
real GNP compared to annual average growth rate of 3.05% recorded for
the period 1970-77. Rate of unemployment also dropped from 24.0% in
1973 to 15.3% in 1978. However, income distribution has worsened in
1978; the income share of the poor has declined; Gini ratio has
increased from 0.41 in 1973 to 0.49 in 1978.^ Even the relatively
higher growth rates recorded in 1978, 1979 and 1980 may only reflect
immediate reactions to liberalization of the highly controlled economy
and therefore one may suspect how well this growth has been founded in
the economy. For example, it is worth noting the following, extracted
from the Public Investment 1980-1984 (Ministry of Finance and Planning
(1980 p.6)):
"Economic growth in 1979 has come mainly from construction,
trade and transport: the higher level of activity in these
sectors did not stem from increased activity in agriculture
and agriculture processing but were largely related to increased
imports following liberalization... the growth impulses
working in the economy were not sufficiently well-founded in
domestic agriculture."
This statement is equally valid for the developments in 1980 as
well. The importance of it should be evaluated in the light of the
1. This is according to the preliminary data of the Consumer Finance and Socio-Economic Survey of 1978. See Central Bank of Ceylon
12
-fact that agriculture contributes to the one third of the GDP, one
half of total employment and more than 60% of the cormiodity exports.
1.3 Nature and the Scope of the Study.
Since the late 1950's the Sri Lankan authorities have attempted,
without any success, to plan the economic development of the country
11
21
at a national level. ' A Ten Year Plan ' was prepared and published
in 1959, but was not implemented. Failure to implement the Ten Year
Plan resulted in the introduction of the Short-Term Implementation 31
Programme ' in 1962, covering only a period of two years, 1962/3 to
1963/4. However, targets of this implementation programme were not
fully realised. After the implementation programme of 1962, no
development plan was introduced at national level until 1971. However,
the Ministry of Planning and Economic Affairs was established in 1965
and it presented a number of sectoral programmes of action on an annual
basis, mainly for agriculture and public sector industry. Private sector
industry was regulated through the allocation of foreign exchange
requirements by the Foreign Exchange Budget Committee. In 1971, a 41
Five Year Plan ' was presented covering the period 1972-76. A keen
interest was taken in implementing it, yet in face of the oil price
crisis and food shortages, the plan was abandoned and a crash programne
was started to grow more food. 1
1. For a detail review of planning experience in Sri Lanka see Karunatilake (1971) and Sirisena (1976). 2. National Planning Council (1959).
The planners in Sri Lanka, bascially viewed economic growth along
the lines of Harrod-Domar type of growth models. As a result, the planners
thought of planning in terms of volume of investment. However, economic
»
development depends not only on the volume of investment, but also on
its efficient allocation. This problem of optimal resource allocation
has not been accorded sufficient and systematic attention in economy-wide
development planning in Sri Lanka. However, in 1970, with the assistance
of the UNDP a medium term planning model was constructed based on an
input-output table. This was the first time a model was used to obtain
consistent estimates. In 1971, an ILO mission1^ developed a Three
Sector Model to demonstrate aspects of the trade-off between full
employment and income distribution strategies. There has also been an
attempt to develop a ten-sector optimization model. The basic structure
of this model is presented in Jayawardane (1970) but the results were
not published. As far as can be ascertained, this model has never been
improved further and has now been abandoned completely. The five year
Plan presented in 1971, does not indicate the influence of a formal
planning model.
The present economic policy of the country relies heavily on the
market forces. It is expected that market forces will generally govern
the savings and investment decisions. As stated in the Central Bank of
Ceylon (1979b p.283)
"In a market economy where the private sector is bound to play a
21
leading role in the realisation of these objectives, ' the necessary 12
1. International Labour Office (1971).
2. Rapid growth, especially in terms of income generation, employment creation and export development.
14
-motivations are provided through appropriate manipulation in the monetary
and fiscal policies of the government and therefore the need for
sophisticated development plans become less important."
However, a Five Year Public Investment Programme^ was presented
in 1980 for the period 1980-84 and it contains targets for savings,
investment and government revenue as well as projections of sectoral
outputs. These projections have been prepared basically on an informal
and judgmental basis.^
Given these targets and projections, we believe that it is a mis-
judgment to consider 'sophisticated' (whatever it means) development
plans as less important. Without using an economy-wide development
planning model, it is not possible to test the consistency of the
targets and projections specified in the Public Investment Programme.
(PIP hereafter.) Government believes that it could provide the
necessary motivation for growth, but to which sectors is the government
going to provide incentives? Which sectors are to be given relatively
more emphasis? To answer these questions, we should study the optimal
development path of the economy. It cannot be done systematically
without using an optimisation model. 12
1. Ministry of Finance and Planning (1980).
The present study is an attempt to demonstrate the importance of
using a formal planning technique. A multisectoral intertemporal
optimization model is presented and employed to examine the consistency
and feasibility among targets and projections given in PIP. However,
testing the consistency and feasibility of PIP is not the sole purpose
of our study. A number of experiments are undertaken in the model to
gain more insight into the structure of the economy and to understand
the binding constraints for development. In particular, the importance
of domestic savings and foreign financial assistance, implications of
public overhead investment and distributional implications of development
are investigated. The model is specified in such a way as to facilitate
these purposes.
The model specified in this study is basically inspired by the
Target Model presented in Eckaus and Parikh (1968) and retains most of
the important features of that model. However, our model deviates
substantially from the model of Eckaus and Parikh especially with respect
to the specification of the objective function, savings constraint and
the treatment of public overhead investment. These new features are
highlighted in the chapter 3 where the model is presented.
Capital formation is an essential resource requirement for economic
development and therefore the importance of savings and investment has
been well identified. However, in some developing countries an increase
in domestic savings may not necessarily lead to a corresponding increase
16
-imports. These countries can not increase investment without foreign
exchange as they depend heavily on imports for their requirements of
investment and intermediate goods for development. Therefore, the
availability of foreign exchange becomes a limiting factor for development.
As we have seen in section 1.1, Sri Lanka has faced the problem of foreign
exchange shortages since the late 1950's . Except for the last few years,
the level of investment has been low. Despite the measures taken to
promote domestic savings, the level of domestic savings has been lower
than the level of investment in most of the years. Under these conditions,
it is important to understand the role and interaction of domestic savings
and availability of foreign exchange. In this respect, experiments are
made in the model to examine the following two issues.
(a) Does availability of domestic savings impose a binding
constraint on further growth in Sri Lanka? Given a reasonable ratio of
savings by rich and poor households, would it be possible to generate
sufficient level of savings by following an optimal path of development?
To what extent could economic growth be promoted by taking measures to
increase the overall savings ratio and how far is that extent of growth
limited by the lack of foreign exchange? What are the implications if
the overall savings ratio was lower than the existing level?
Even though the overall savings ratios estimated for the past years
may seem low, it does not necessarily mean that the economy's savings
potentials are also low. Because, according to Two Gap theory^, if a
country's exante Trade Gap is dominating the exante Savings Gap, there
is a possibility that the level of realised savings could fall below the
exante level. Further, there is some statistical evidence to suggest
that an inflow of foreign financial assistance could adversely affect
domestic savings.^ Therefore some experimental resultsfrom the model
devised in this study are analysed to identify the dominating gap for
Sri Lankan economy, thereby providing some evidence to justify or refute the
hypothesis that inflow of foreign financial assistance would adversely
affect domestic savings.
(b) Does availability of foreign exchange impose a binding
constraint on further growth in Sri Lanka? If it does, how far could
economic growth be promoted by increasing the availability of foreign
exchange? The availability of foreign exchange could be increased
either through increased availability of foreign financial assistance
or by an increase in exports. The importance of an increased availability
of foreign exchange through these two channels are examined separately
and their differences are highlighted. By parametrically varying
the amount of foreign financial assistance available, its productivity
is also analysed.
The Public Investment Programme presents a target for an ambitious
level of investment on economic and social overheads.^ Given the limited
availability of resources, it is useful to examine the implications of
such an investment programme on the developments within the planning period.
1. For a critical survey, see Bartels (1975).
18
-We do not question the importance of at least some of the overhead
investments. Yet, if these investments impose a heavy burden on the
economy and consequently reduce substantially the level of income
attainable within the planning period, it might be worth considering
the rephasing of the overhead investments. Therefore, the implication
of overhead investments are examined parametrically varying the level
of public overhead investments.
Economy-wide development planning models of optimisation nature
have always been concerned with the optimisation of a single objective
such as consumption or income.^ However development planning can better
be considered as a problem of decision-making with multiple objectives.
Even though various objectives of economic development have
been well recognised, no attempt has been made to analyse the multiple
objective situation formally. Adelman and Sparrow (1966) having experi
mented with four objectives separately, conclude that optimal economic
profiles are fairly sensitive to differences in objectives. However
no attempt was made to provide a plausible solution for multi-objective
problems or no formal attempt made to provide sufficient information for
the decision maker (DM) to make his final judgement. Karl A. Fox (1966),
commenting on Adelman and Sparrow's work, suggested choosing a linear
combination of objectives. However, how to decide the weight assigned
to each objective has not been discussed.
1. "All mathematical planning models simplify the objectives of development inordinately. For lack of data on policy makers' judgements as well as for computation simplicity even the most ambitious do not go beyond a model in which the sole objective is maximisation of discounted present value of aggregate consumption. Dasgupta et al (1972 p .131. )
In this respect, our study represents a major improvement over the
existing models. Two alternative approaches are followed to take into
account the multiplicity of objectives. First, considering only the
two objectives of consumption (or income) and its distribution, a social
.welfare function is specified and used as the objective function of the
optimisation model; and second, recent developments in Multiple
Objective Decision (MOD) methods are employed to resolve the problem
imposed by the multiplicity of objectives.
The social welfare function specified in this study, not only takes
into account the two objectives of consumption (income) and its dis
tribution, but also resolve the problem imposed by the linearity of
objective function in the existing models.^ It defines social welfare
in terms of the weighted sum of the indirect utility functions of an
average poor and rich household, with weights proportioned to the number
of households in each group. Also the utility functions used are con
sistent with the linear expenditure systems for the poor and rich house
holds specified and incorporated within the model. Moreover, the use of
this social welfare function enables us to examine the distributional
implications of development on an optimal path.
The importance of this should be evaluated considering the well-
known hypothesis regarding the relationship between growth and income
inequality, and the past experience of growth in developing countries,
particularly in Sri Lanka. Kuznets (1955) presents the wellknown 1
20
-hypothesis that as a low income country develops, the extent of income
inequality tends to increase at first, then become stable before it
begins to decrease, while Paukert (1973) and Ahluwalia (1974) provide
some evidence to support this hypothesis. This suggests that, on
average, a developing country will tend to follow a general path.
However, this does not mean that all the developing countries will
necessarily follow this general path. In fact there are developing
countries which have managed to improve the relative distribution as
well as experiencing economic growth,1 ^ and according to Ahluwalia
(1974 p.13), there is little firm empirical basis for the view that
higher rate of growth inevitably generates greater inequality. Within
this argument about growth and income inequality, Sri Lanka has improved
the relative distribution of income from 1963 to 1973 with relatively
slow rate of economic g r o w t h s . H o w e v e r , by 1978, relative income
distribution appears to have changed in favour of the rich, with a higher
rate of economic growth than in the earlier period. The earlier development
in income distribution has been attributed to income transfer policies123^
and the structure of production4 ^ which prevailed in that period, while
1. See the country studies presented in Chereny et al (1974 pp.253-290). 2. Lee (1977a and 1977b) attempts to argue that there has not been an
improvement in the distribution of incomes from 1963 to 1973. However, Karunatilake (1978) and Lakshman (1976) has refuted his argument.
3. "Sri Lanka is perhaps the most notable case of a government that has used a substantial portion of revenue generated largely by taxing primary exports to subsidise the consumption of poor... This policy has led to a considerable improvement in income distribution, literacy and life expectancy but it has been at the cost of a diminishing rate of growth of GNP and growing unemployment". Chenery (1979, p .35.) 4. Jayawardena (1974 pp.274-77) examines the contribution of production
Dahanayake (1979) has attempted to explain'the later development in
terms of the Kuznets' hypothesis.
Within this background of argument and historical experience, it
is interesting to analyse the distributional implications of economic
growth on an optimal path. It would shed light to our understanding of
the past developments and would provide some guideline as to how income
distribution might be improved without sacrificing economic growth.
By varying the weights assigned to utilities of the poor and rich, one
experiment is to see whether it is possible to change the income share
of poor and rich substantially by means of production planning. The
results of these experiments are analysed to see whether there is a trade
off between growth and equality, that is whether the income share of poor
households declineswith growth on an optimal path. We also examine the
effects of income transfer policies on economic growth and income
distribution.
The above approach of specifying a social welfare function is not
always practical, particularly if there are a number of objectives,
because the specification of weights becomes a critical problem.
Specification of weights requires value judgements from the political
authorities and they may not be in a position to articulate their
preference among objectives. Underthis circumstance:, we believe that
it is possible to make a good use of recent developments in Multiple
Objective Decision methods.
There has been a substantial development in Multiple Objective
Decision Methods recently.1 ^ Some applications of these methods have
22
-been made in public sector decision-making for such areas as water
resource planning, transportation planning, manpower planning in some
organisations and financial planning of firms. However, in economy-wide
development planning only two applications could be found. In these two
applications a special branch of multple objective decision method,
that is, Goal Programming, has been used for Korea (Yoon and Hwang (to
be published))^ and Thailand (Tantasuth, 1975). Only Tantasuth's work
is available for our reference. In that application we believe that the
model is not quite complete: inter-industry transactions have not been
taken into account. However, one disadvantage of Goal programming is that it
requires the DM to specify the minimum level of achievement which he
desires for each goal.
Our study demonstrates the applicability of two specific MOD methods
in economy-wide development planning: Hierarchical Programming and
Interactive Programming. These two methods appear to be especially
attractive considering the preference information which is required from
the decision maker. The Interactive Programming method requires no
information from the decision maker regarding his preference on objectives
a priori and requires only local preferences on a given provisional
solution, while the Hierarchical Programming method requires the decision
maker to rank objectives according to their importance to him. Moreover, both
of the methods are attempted to highlight the relative importance of one
method over the other. Individual optimization of each of the objectives
would indicate the conflicting or complementary nature of the objectives. 1
Conflicting objectives would suggest different strategies of development.
Given these different strategies, a unified or compromise strategy of
development is derived using the MOD methods.
1.4 Organization of the Study.
Different type of economy-wide development planning models are
briefly introduced in chapter 2. The main theme of this chapter is to
highlight the important features and weakness of each type of planning
models and to defend our choice of an optimising economy-wide planning
model.
The model is presented in chapter 3. It highlights some undesirable
elements of existing optimising models and emphasises the improvements
in the specification of the present model. Having presented the required
data for the application of the model for Sri Lanka in chapter 4, results
of the various experiments undertaken in the model are presented and
analysed in chapters 5, 6 and 7.
In chapter 8, multiple objectives of economic development are
identified and MOD methods are introduced and reviewed. This chapter
concludes by highlighting the importance of Interactive and Hierarchical
programing methods, while chapter 9 demonstrates the applicability of
these two methods in economy-wide development planning. The complementary
and conflicting nature of the objectives and the strategy of development
suggested by each of them is generally discussed. Finally, Hierarchical
24
-of development. Given the experience gained by applying these two
methods, it also evaluates each of the methods to indicate which of
them is more useful as a practical planning technique.
Economy-wide Models of Development Planning.
2.1 Introduction.
This chapter introduces different types of development planning
models. The main theme is to emphasise the important features of each
type of model and to discuss their potential applications and limitations.
This would provide background information in selecting a certain type
of model to handle a particular situation faced by the development planner.
Development planning models can be categorised,broadly, into the following
four types.
1. Aggregate consistency models.
2. Multisectoral consistency models.
3. Computable General Equilibrium models.
4. Multisectoral optimization models.
Each type of model is reviewed in the following section. However, we
do not intend to provide a complete survey of planning models. Taylor (1975)
provides a comprehensive survey of the model of the first two and last
types. Manne (1974) provides a crticial survey of multisectoral models,
giving some suggestions on planning of income distribution. Computable
general equilibrium models are a later development and are discussed
extensively in Adelman and Robinson (1978) and Dervis, de Melo and
Robinson (1982). Therefore we introduce each type of model very briefly
25
-CHAPTER 2 .
Economy-wide Models of Development Planning.
2.1 Introduction.
This chapter introduces different types of development planning
models. The main theme is to emphasise the important features of each
type of model and to discuss their potential applications and limitations.
This would provide background information in selecting a certain type
of model to handle a particular situation faced by the development planner.
Development planning models can be categorised,broadly, into the following
four types.
1. Aggregate consistency models.
2. Multisectoral consistency models.
3. Computable General Equilibrium models.
4. Multisectoral optimization models.
Each type of model is reviewed in the following section. However, we
do not intend to provide a complete survey of planning models. Taylor (1975)
provides a comprehensive survey of the model of the first two and last
types. Manne (1974) provides a crticial survey of multisectoral models,
giving some suggestions on planning of income distribution. Computable
general equilibrium models are a later development and are discussed
extensively in Adelman and Robinson (1978) and Dervis, de Melo and
Robinson (1982). Therefore we introduce each type of model very briefly
2.2 Aggregate Consistency Models.
Aggregate consistency models make use of the simple relationships
between macro-economic aggregates such as Gross National Product,
Consumption, Savings and Investment, at least to provide a forecast
of GNP over the planning period. Perhaps the most widely used model
in this respect is the well known Harrod-Domar model. At least at the
beginning of the planning exercise, planners in developing countries used
this model to arrive at some consistent forecast. The Harrod-Domar model
itself was not presented as a planning model. However, development
planners usually use the following relationship which is a slight
modification of the basic Harrod-Domar equation, for planning purposes.^
n + p = sa - 6
where n = expected rate of growth of labour force
p = rate of growth of productivity
s = average (marginal) savings rate
a = output capital ratio
and 6 = rate of depreciation.
Then they attempt to answer the question, whether or not the economy
is able to absorb the expected employment growth, given historical data
on savings and depreciation rate and output capital ratio. For many
developing countries the answer to this question is negative. The whole
27
-economic policy problem starts there.
In some countries Harrod-Domar type models were used explicitly
as the framework for plan formulation (e.g. by Tinbergen for the first
Turkish Plan). In some other countries this type of model is implicit
in the plan documents. As it was pointed out by Bhagwati and Chakravarty
(1969), the First Indian Five Year Plan has used a variant of Harrod-
Domar model. The only difference was the distinction between the
average and marginal propensity to save. Making that distinction it
was shown that an economy which decides to save more on the margin than
on the average can hope to do better and better over time in terms of
its rate of growth.
Models of this type are useful in indicating the basic macro-
economic relationships that any more complex models would equally have
to satisfy. Also they could be used as a simple mechanism for computing
the external assistance that may be necessary for supplementing domestic
savings to sustain a projected growth rate in income.^
However, such models have some unsatisfactory features:
(i) They concentrate mainly on flow equilibrium and assume
that there are no structural difficulties in transforming savings into 1
investment. This in fact ignores the real constraints in the economy.
(ii) By assuming a constant marginal propensity to save
for the economy, such models ignore the fundamental choice problem of
planning overtime which requires weighting of present versus future
gainsJ^
(iii) Finally such models assume that economic growth
depends entirely upon volume of investment and therefore they ignore
the importance of efficient allocation of investment.
The importance of investment allocational problem was emphasised
by Mahalanobis (1953, 1955) presenting an ingenious way to handle the
problem. He presented two models, to rationalize the investment
allocation given in the Second Indian Five Year plan. Both of his models
emphasise the importance of investing in capital goods industries.
His two sector model is very similar to one developed independently
by Feldman in the Soviet Union in the 1920's and later revised by Domar
(1957). In this model current investment flow (1^) is divided into
two parts, XkIt and Xc It where X^ indicates the proportion of
investment going to the capital goods sector and Xc the corresponding
proportion for the consumption sector.^ Now it is clear that
l t ' !t-l = Xk6kIt-l 12
1. Bhagwati and Chakravarty (1969 p.5).
Using these two relationships he derived a complete solution for outout
as,
M c + t
H -
¥ u °o< % ‘ >t
H ( i * V k > - 1 ) 1
where <Xq = Iq/Yq , the initial investment income ratio.
It is clear from this solution that the asymptotic rate of growth
of the system is given by x ^ where X^ is the critical allocation
ratio which indicates the proportion of capital goods output which is
devoted to the further production of capital goods. Therefore a higher
X^ would always have a favourable effect on asymptotic growth rate of
the system. However if Sc > , then a higher value of X^ would
imply a lower immediate increment in consumption. Therefore there is
implicit in the choice of X^ a choice of alternative time stream of
consumption.
He considered the allocation ratio of current investment going into
investment goods sector as a policy variable. Then it was shown that a
higher X^ would mean a higher savings rate on the margin and hence a
greater rate of growth of output or consumption. However this model seems
to have been used merely to provide the rationale for a shift in industrial
investment towards building up a capital goods base. The precise choice
of the proportion of investment in capital goods sector during the
second plan, appears to have been arbitrary; if there were specific
His second model breaks down total investment flow into following
four sectors.
1. Capital goods sector.
2. Factory products of consumer goods.
3. Household products of consumer goods
including agriculture.
4. Sector producing services.
Then given the total investment, the problem was to allocate the
total between the sectors in such a way that specified increase in
income (AY) and employment (AN) were reached. The policy variables
were the shares of investment going to each sector, denoted by A., Ag,
Aj and A^ .
Now since there are only two objectives, AY and AN , the model
is determined only if one of the three independent A's was exogenously
determined. Mahalanobis gave a pre-assigned value to the A for the
capital goods sector and solved the system to assign investment among
the three remaining sectors. However as Komiya (1959) pointed out,
the Mahalanobis' solution was inefficient in that it was situated in the
interior of the feasibility locus between incremental income and
incremental employment. Therefore greater employment and/or income
could have been obtained by merely reallocating the given investment
![TABLE 3.2. The Model: 1. Objective Function Maximize: T (1.1) W = ^ C n d n * RYR(t)) + (l-n)(ln ♦pYP(t))]/(1+w)t-l Subject to: 2](https://thumb-us.123doks.com/thumbv2/123dok_us/9888788.490113/121.876.45.801.19.975/table-model-objective-function-maximize-ryr-pyp-subject.webp)
![TABLE 3.3. The Model after substitution. 1. Objective function Maximize (1.0) W = i Cn In ^(l-tR){V^X(t) + VCR(t)J + 't’p + (1 -n)ln up-(l-tp ){VpX(t) + Vffp(t)}]/p+w)t-l Subject to: 2](https://thumb-us.123doks.com/thumbv2/123dok_us/9888788.490113/125.876.11.805.23.940/table-model-substitution-objective-function-maximize-vffp-subject.webp)