ORIGINAL RESEARCH
Apparent Diffusion and Fractional Anisotropy of
Diffuse Intrinsic Brain Stem Gliomas
H.J. Chen A. Panigrahy G. Dhall J.L. Finlay M.D. Nelson, Jr. S. Blu¨ml
BACKGROUND AND PURPOSE: DIBSGs have the worst prognosis among pediatric brain tumors with no improvement of outcome for several decades. In this study, we determined whether diffusion imaging could improve patient stratification and our understanding of the impact of therapies.
MATERIALS AND METHODS: Nine baseline and 24 follow-up DTI studies performed in 9 patients on a 1.5T clinical MR imaging scanner were reviewed. ADC and FA were measured for the whole lesion and at 5 anatomic levels: the rostral medulla, caudal pons, midpons, rostral pons, and caudal midbrain. Reference data were obtained from 8 controls with normal brain stem, 6 patients with medullo-blastoma, and 7 patients with pilocytic astrocytoma.
RESULTS: ADC was higher in untreated DIBSG than in normal brain stem and medulloblastoma (1.14⫾0.18 [⫻10⫺3mm2/s] versus 0.75⫾0.06 and 0.56⫾0.05, bothP⬍.001). FA was lower in DIBSG than in normal brain stem (0.24⫾0.04 versus 0.43⫾0.02,P⬍.001) but was higher than that in pilocytic astrocytoma (0.17⫾0.05,P⬍.05). Lower baseline ADC and higher FA correlated with a worse clinical course. Correlations were more significant at the caudal midbrain than in other regions. ADC decreased and FA increased after RT. Changes of FA after RT at the caudal midbrain correlated with event-free survival.
CONCLUSIONS:Baseline ADC and FA of DIBSG revealed hypocellular tumors with extensive edema. Diffusion changes after therapy implied reduced edema but did not support a significant response to therapy. The significance of diffusion properties varied with anatomic locations, the caudal midbrain being particularly important.
ABBREVIATIONS:ADC⫽apparent diffusion coefficient; ADCCM ⫽ADC at the caudal midbrain; ADCLesion ⫽ mean ADC of whole lesion calculated from the 5 anatomic regions examined; ADCmax⫽largest ADC value measured in the 5 anatomic regions examined; ADCmin⫽lowest ADC value measured in the 5 anatomic regions examined; ADCMP⫽ADC at the mid pons; ADCRP⫽ ADC at the rostral pons; AVA⫽Avastin (bevacizumab); Bsl⫽baseline; CP⫽carboplatin;⌬ADC⫽ change of ADC between the baseline study and the study immediately after completion of RT; ⌬FA ⫽change of FA between baseline study and study immediately after completion of RT; ⌬TEFS⫽event-free survival after therapy;⌬TSurvival⫽survival time after diagnosis; DIBSG⫽diffuse intrinsic brain stem glioma; DTI⫽diffusion tensor imaging; ETO⫽etoposide; FA⫽fractional anisotropy; FACM⫽FA at the caudal midbrain; FALesion⫽mean FA of the whole lesion calculated from the 5 anatomic regions examined; FAmax⫽largest FA value measured in the 5 anatomic regions examined; FAmin⫽lowest FA value measured in the 5 anatomic regions examined; GT⫽ gadolinium-texaphyrin; IRI⫽irinotecan (Camptosar); n.d.⫽not determined; RT⫽radiation therapy; Early post-RT⫽within 3 months of completion of RT; Late post-RT⫽ ⬎3 months after completion of RT; TEM⫽temozolomide (Temodar); WHO⫽World Health Organization
D
IBSG accounts for approximately 15% of childhood cen-tral nervous system tumors1-3and 80% of all brain stem gliomas.4These tumors are inoperable and highly resistant toradiation therapy and chemotherapy. Because biopsies are not generally performed, the biology and status of these tumors in individual subjects are unknown and physicians have limited means for patient stratification and timely evaluation of the effectiveness of their therapies.
MR imaging is considered the criterion standard for diag-nosing DIBSG. However, standard features such as lesion size or contrast accumulation at presentation generally do not correlate with disease course.5-8On the other hand, it has been reported that diffusion MR imaging provides informa-tion that complements conveninforma-tional pre- and postcontrast anatomic imaging in gliomas in adults.9-13Specifically, the ADC has been reported to be a useful clinical prognostic biomarker for survival in patients with malignant supratento-rial astrocytoma14-16 and a more sensitive indicator for re-sponse to therapy than conventional imaging techniques.15,16 DTI is a variant of diffusion imaging by which the direc-tionality of the diffusion of water molecules can be probed. A readily obtained parameter is the FA, which describes to Received February 17, 2010; accepted after revision April 15.
From the Department of Radiology (A.P., M.D.N., S.B.) and Childrens Center for Cancer and Blood Diseases (G.D., J.L.F.), Childrens Hospital Los Angeles, Los Angeles, California; Rudi Schulte Research Institute (S.B.), Santa Barbara, California; Department of Radiological Sciences (H.J.C.), David Geffen School of Medicine, University of California, Los Angeles, Los Angeles; and Department of Radiology (A.P.), Children’s Hospital of Pittsburgh, University of Pittsburgh Medical Center, Pittsburgh, Pennsylvania.
This work was supported by grants from Ian’s Friends Foundation, the Thrasher Research Fund, the National Childhood Cancer Foundation/NIH/NCI (phase 1 and pilot consortium grant), and the Rudi Schulte Research Institute.
Paper previously presented at: 94th
Scientific Assembly and Annual Meeting of the Radiological Society of North America, November 30-December 5, 2008; Chicago, Illinois.
Please address correspondence to Stefan Blu¨ml, PhD, Department of Radiology, Childrens Hospital Los Angeles, MS 81, 4650 Sunset Blvd, Los Angeles, CA 90027; e-mail: [email protected]
Indicates open access to non-subscribers at www.ajnr.org
DOI 10.3174/ajnr.A2179
BRAIN
ORIGINAL
what extent water diffusion occurs anisotropically (for ex-ample along the nerve fibers). In previous studies, it was re-ported that anisotropic diffusion in pontine tumors was sig-nificantly lower than that in control tissue. This was attributed to tumor infiltration and the destruction of the highly direc-tional white matter fiber tracts.17-19The goals of our study were to evaluate whether ADC and FA measurements before therapy and after treatment can improve initial patient strati-fication, assess the response to therapy, and improve our un-derstanding of the impact of current therapies.
Materials and Methods
Patients and Control Subjects
ADC and FA maps obtained from 9 patients with DIBSG were evalu-ated. All patients had a baseline DTI study before treatment and at least 1 follow-up study after therapy, and a total of 33 DTI studies were analyzed. Diagnoses of DIBSG were established on the basis of the initial MR imaging findings and the clinical course typical for this disease. One patient underwent a pretreatment biopsy at a different hospital immediately before being referred to this institution for therapy. The lesion in this patient also underwent postmortem ination at the time of death. No other biopsies or postmortem exam-inations were performed for the remaining subjects. The medical records of all patients were reviewed to determine⌬TSurvivaland
⌬TEFS(Table 1).
“Closest-to-normal” control data were obtained from 8 age-matched subjects with no brain stem pathology (3 girls, 5 boys; 8.0⫾ 2.7 years of age). These subjects had unrelated indications for MR imaging, which included headaches, seizures, and ruling out tumors (negative), with all findings being interpreted as normal. In addition, ADC and FA maps of 6 patients with medulloblastoma (3 girls, 3 boys; 7.2⫾4.1 years of age) and 7 patients with pilocytic astrocytoma (2 girls, 5 boys; 5.5⫾5.4 years of age) were analyzed to obtain refer-ence data from other pediatric tumors. Subgroups of patients and controls were enrolled in prospective research projects approved by the institutional review board. Parental consent and assent of subjects older than 8 years of age were obtained. For the remaining subjects, the institutional review board waived the review of already existing data and the requirement to obtain consent.
Data Acquisition and Analysis
Acquisition.All subjects were scanned by using a 1.5T MR imag-ing system (Signa LX; GE Healthcare, Milwaukee, Wisconsin). All
diffusion measurements were integrated into the standard imaging protocol. An echo-planar sequence with a TE of 85 ms, 5- to 7-mm section thickness, 20- to 26-cm FOV, 128⫻128 matrix size, 25 di-rections, and a b-value of 1000 s/mm2was used for all measurements.
Software provided by the manufacturer was used to calculate ADC and FA maps. The maps were then stored and reviewed by using the hospital PACS system.
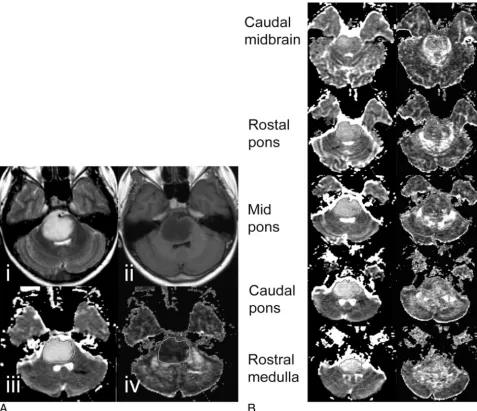
Analyses.ADC and FA values of the brain stem gliomas were measured at 5 different axial levels of the brain stem: the caudal midbrain, rostral pons, mid pons, caudal pons, and rostral medulla (Fig 1). To ensure consistency and consensus, 1 author (H.J.C.) out-lined the regions and at least 1 board-certified neuroradiologist (A.P. and/or M.D.N.) subsequently confirmed them. Areas with necrosis and cystic degeneration were excluded to the extent possible. Previous studies have shown the importance of measuring ADCminof a lesion,
which was set in this study to the lowest ADC measured in any of the 5 anatomic areas. We also analyzed the FAminand FAmaxobtained
from the lowest and highest FA of any of the 5 regions, respectively, as well as the ADCmax. Also reviewed were ADCLesionand FALesionas well as the mean value for single anatomic regions (eg, ADCRPand FACM).
⌬ADCand⌬FAbetween baseline and an MR imaging study conducted
immediately after completion of radiation were correlated with⌬TEFS
after therapy.
Control data from subjects with normal MR imaging findings of the brain stem were obtained in the same fashion. ADC and FA values from medulloblastoma and pilocytic astrocytoma were obtained by marking solid areas of the tumors in representative images.
Statistics
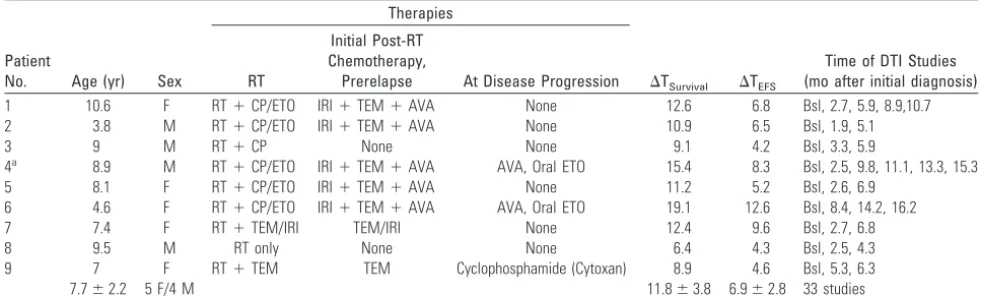
[image:2.594.52.543.59.207.2]ADC and FA values are reported in mean values and SDs. Unpaired 2-tailed Studentttests were used to determine significant differences between measurements in DIBSG and controls, medulloblastoma, and pilocytic astrocytoma. An analysis of variance test was used to determine the significance of variations of ADC and FA over different anatomic regions. Linear regression analysis was used to analyze the correlation between survival time and initial diffusion properties of the lesions. The time course of ADC and FA in this disease was deter-mined at 3 time points: at baseline; at an early post-RT period, which included the scan immediately after completion of RT and the next follow-up scan within 3 months; and at a late post-RT period there-after. The cutoff of 3 months after completion of therapy between the 2 post-RT periods was selected to ensure an approximately equal number of studies within each period to maximize statistical power. Table 1: Demographics of patients with DIBSG included in this study
Patient
No. Age (yr) Sex
Therapies
⌬TSurvival ⌬TEFS
Time of DTI Studies (mo after initial diagnosis) RT
Initial Post-RT Chemotherapy,
Prerelapse At Disease Progression
1 10.6 F RT⫹CP/ETO IRI⫹TEM⫹AVA None 12.6 6.8 Bsl, 2.7, 5.9, 8.9,10.7
2 3.8 M RT⫹CP/ETO IRI⫹TEM⫹AVA None 10.9 6.5 Bsl, 1.9, 5.1
3 9 M RT⫹CP None None 9.1 4.2 Bsl, 3.3, 5.9
4a 8.9 M RT⫹CP/ETO IRI⫹TEM⫹AVA AVA, Oral ETO 15.4 8.3 Bsl, 2.5, 9.8, 11.1, 13.3, 15.3
5 8.1 F RT⫹CP/ETO IRI⫹TEM⫹AVA None 11.2 5.2 Bsl, 2.6, 6.9
6 4.6 F RT⫹CP/ETO IRI⫹TEM⫹AVA AVA, Oral ETO 19.1 12.6 Bsl, 8.4, 14.2, 16.2
7 7.4 F RT⫹TEM/IRI TEM/IRI None 12.4 9.6 Bsl, 2.7, 6.8
8 9.5 M RT only None None 6.4 4.3 Bsl, 2.5, 4.3
9 7 F RT⫹TEM TEM Cyclophosphamide (Cytoxan) 8.9 4.6 Bsl, 5.3, 6.3
7.7⫾2.2 5 F/4 M 11.8⫾3.8 6.9⫾2.8 33 studies
Linear regression analysis was also used to determine whether there was a correlation between⌬TEFSand changes of diffusion properties
immediately after therapy. ReportedPvalues were not corrected for multiple comparisons.
Results
Baseline ADC and FA in DIBSG versus Normal Brain Stem, Medulloblastoma, and Pilocytic Astrocytoma
The mean ADCLesionat baseline of DIBSG was 1.14⫾0.18 (⫻10⫺3mm2/s). This was significantly higher than the mean ADC of normal brain stem in controls obtained from com-parable regions (0.75⫾0.06,P⬍.001). Baseline ADCLesionof DIBSG was also significantly higher than mean ADC of cellu-lar (WHO grade IV) medulloblastoma (0.56⫾0.05,P⬍.001) but was comparable with that of hypocellular (WHO grade I) pilocytic astrocytoma (1.14⫾0.27, not significant) (Table 2). Across different anatomic regions, the baseline ADCs in DIBSG were 1.19⫾0.21 (rostral medulla), 1.24⫾0.24 (cau-dal pons), 1.20⫾0.19 (mid pons), 1.09⫾0.16 (rostral pons), and 0.99⫾0.18 (caudal midbrain). There was no statistically
significant difference in baseline ADCs at different anatomic levels (analysis of variance).
The baseline FALesionof DIBSG was 0.24⫾0.04 and was significantly lower than the mean FA of normal brain stem in the controls (0.43 ⫾ 0.02, P ⬍ .001). Baseline FALesionof DIBSG was not significantly different from the mean FA of medulloblastoma (0.24⫾0.10, not significant.). On the other hand, FALesionwas significantly higher than the mean FA of pilocytic astrocytoma (0.17⫾0.05,P⬍.05) (Table 2). Across different anatomic regions, the baseline FA values in DIBSG were 0.25⫾0.05 (rostral medulla), 0.23⫾0.06 (caudal pons), 0.22 ⫾ 0.05 (mid pons), 0.23 ⫾ 0.04 (rostral pons), and 0.29⫾0.06 (caudal midbrain). FA values at different ana-tomic levels of the lesions were not significantly different.
Correlation of Baseline ADC and FA with⌬TSurvival A significant positive linear correlation (R2⫽0.46,P⬍.05) between baseline ADCLesionand survival and a negative linear correlation (R2⫽0.46,P⬍.05) between FA
[image:3.594.56.534.42.453.2]with outcomes (R2⫽0.54,P⬍.05 andR2⫽0.55,P⬍.05, respectively).
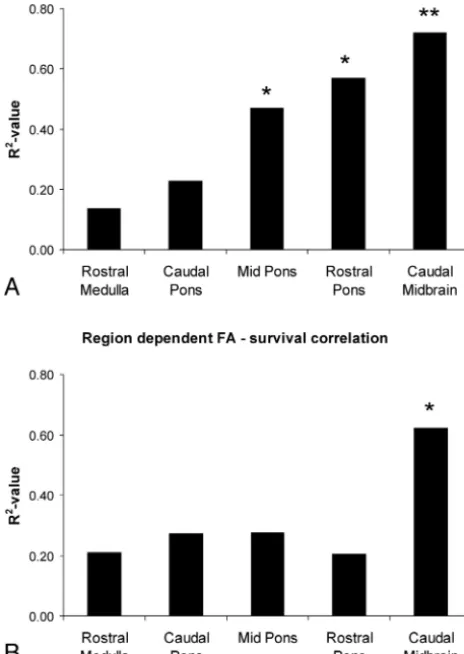
Of the 5 anatomic regions analyzed, ADCCM and FACM showed the most significant correlation with survival (ADCCM: R2⫽0.72,P⬍.005 and FA
CM:R2⫽0.62,P⬍.05) (Fig 2C, -D). ADCMPand ADCRPalso correlated with survival, though to a lesser extent than at caudal midbrain (Fig 3A). FA mea-surements outside the caudal midbrain did not correlate with outcome (Fig 3B).
Time Courses of ADC and FA
All except 1 patient (subject 6) had a DTI study performed within 3 months after completion of radiation therapy (3.3⫾1.7 months after initial diagnosis). ADCLesionat this early post-RT period was 0.91⫾0.10 (⫻10⫺3mm2/s), which was significantly different from the baseline ADCLesion (1.14⫾0.18,P⬍.005). Thereafter, at the late post-RT period (9.7 ⫾ 3.6 months after initial diagnosis), no significant change was observed (0.91 ⫾ 0.10) (Table 2 and Fig 4). FALesionincreased significantly from initially 0.24⫾0.04 to 0.32⫾0.08 (P⬍.05) during the early post-RT period. During
the late post-RT period, FAmeanwas 0.29⫾0.05, which was not significantly different from baseline (Table 2 and Fig 4).
Correlation of⌬TEFSwith⌬ADCand⌬FA
Seven subjects had DTI studies performed before and im-mediately after RT (within 2 weeks of completion of RT). No significant correlations between⌬ADC and⌬TEFS were ob-served for whole lesion ADC. There were also no significant correlations between⌬ADC and⌬TEFSin individual regions and for minimum or maximum ADC. A statistically signifi-cant positive correlation between⌬FAin the caudal midbrain and⌬TEFS(R2⫽0.69,P⬍.05) was noted (Fig 5).⌬FAat other anatomic levels did not correlate with⌬TEFS.
Discussion
[image:4.594.59.533.68.143.2]Most childhood brain stem gliomas are diffuse intrinsic tu-mors that involve the pons and other adjacent brain stem sites.2,20-22 These tumors are considered inoperable due to their location, regardless of their histology, and carry the worst prognosis of tumors in pediatric neuro-oncology. Conven-tional treatment for this disease is radiation therapy, which
Table 2: ADC (ⴛ10ⴚ3mm2/s) and FA measurements in patients with DIBSG at various stages of the disease, in controls, and in untreated
medulloblastoma and pilocytic astrocytoma
DIBSGa ADC
mean FAmean ADCmin FAmin ADCmax FAmax
Baseline 1.14⫾0.18 0.24⫾0.04 0.96⫾0.17 0.20⫾0.05 1.29⫾0.22 0.30⫾0.05 Early post-RTb 0.91⫾0.10c 0.32⫾0.08d 0.77⫾0.09d 0.25⫾0.07 1.03⫾0.12c 0.42⫾0.09d
Late post-RTe 0.91⫾0.10c 0.29⫾0.05 0.84⫾0.08 0.24⫾0.05 0.98⫾0.1c 0.34⫾0.08
Controls 0.75⫾0.06f 0.43⫾0.02f 0.69⫾0.04f 0.33⫾0.06f 0.83⫾0.11f 0.50⫾0.02f
Medulloblastoma 0.56⫾0.05f 0.24⫾0.10 n.d. n.d. n.d. n.d.
Pilocytic astrocytoma 1.14⫾0.27 0.17⫾0.05d n.d. n.d. n.d. n.d.
a
ADC decreased and FA increased significantly between baseline and the early post-RT period. Thereafter, no significant differences were observed. At baseline, DIBSG had significantly higher ADC than the brain stem of controls and medulloblastoma. Also, baseline FA was lower than the FA of brain stem of controls and higher than FA of pilocytic astrocytoma.
b
From 11 scans performed within 3 months of completion of RT (3.3⫾1.7 months after initial diagnosis).
cP⬍.005. d
P⬍.05.
eFrom 13 scans performed⬎3 months after completion of RT (9.7⫾3.6 months after initial diagnosis). f
P⬍.001 versus baseline DIBSG, unpairedttest.
[image:4.594.134.451.206.452.2]will result in a transient benefit for more than half of patients. To date, the addition of radiosensitizers, chemotherapy, or immunotherapy to radiation therapy has not demonstrated any improvement in survival.20,21,23,24Because biopsies are usually not obtained, physicians know little about the
patho-logic status or the impact of therapy. Also, monitoring with standard MR imaging is frequently not useful. Initial features, such as lesion size and contrast accumulation as well as changes observed on MR images, often do not correlate with progression, whereas in some patients, obvious clinical dete-rioration was observed despite no changes on MR imaging.6,25 This lack of appropriate monitoring tools compromises pa-tient stratification and slows down clinical research, and there has been no improvement in mean survival time during the past several decades. In an effort to improve this situation, the overall objective of this research was to evaluate whether diffusion MR imaging and DTI can provide much-needed quantitative biomarkers of disease status and response to therapy.
Diffusion Properties of DIBSG at Initial Presentation
ADC mapping has been shown to provide important prog-nostic information in malignant supratentorial astrocytoma in adults. Specifically, tumors with particularly low ADCmin values had the worst clinical courses.14,26This observation is likely explained by the fact that increased tumor cellularity distinguishes grade IV glioblastoma from lower grade gliomas on pathology (among other features such as high vascularity and high mitotic index). Highly cellular tumors or areas of particularly high cellularity restrict diffusion, resulting in low ADC measurements. Consistent with these findings in adults with gliomas, patients with DIBSG with lower ADC at presen-tation generally did worse in this study. However, all DIBSGs are relatively hypocellular lesions. For example, the mean ADC of DIBSG was significantly higher (with no overlap) than the mean ADC of high-grade (WHO IV) hypercellular medulloblastoma. The diffusion in DIBSG was also signifi-cantly less restricted than that in normal brain stem.
Also observed was a negative correlation between initial FA and survival times, indicating that patients with tumors with higher baseline anisotropic water diffusion are at higher risk for rapid disease progression. In the normal brain stem, water diffusion is highly directional due to white matter tracts, Fig 3.Shown are theR2values of the linear correlation analyses between ADC (A) and
FA (B) for the 5 anatomic regions. Correlation coefficients are highest and the most significant correlation is noted for the caudal midbrain. ADCMPand ADCRPalso correlate
with survival, albeit to a lesser extent than at the caudal midbrain. FA measurements outside the caudal midbrain do not correlate with outcome.
Fig 4.ADC decrease and FA increase significantly between baseline and the early post-RT period. Thereafter no significant changes are observed.
Fig 5.A statistically significant positive correlation between⌬FAin the caudal midbrain
[image:5.594.53.285.62.389.2] [image:5.594.305.533.73.253.2] [image:5.594.53.286.455.627.2]and FA in our controls with normal brain stem was approxi-mately twice as high as that in DIBSG. Our initial hypothesis was that a reduction of FA in DIBSG would correlate with the extent of tumor infiltration and destruction of anisotropic normal tissue as previously suggested17-19and that lower FA would predict a poorer clinical course. However, our results clearly rejected this hypothesis. We observed a negative corre-lation (instead of a positive one) between initial FA and sur-vival length, indicating that patients with tumors of higher baseline anisotropic water diffusion are at higher risk for rapid disease progression.
Changes of ADC and FA after Therapy
In adult gliomas, a posttreatment increase of ADC was a pre-dictor of a more favorable clinical course.15,16,27-29Therefore, the changes after RT hoped for by the treating clinicians—in terms of diffusion properties—are an increase of ADC (and a drop of FA). These changes would be consistent with increased extracellular space caused by cell death, which in turn might suggest a reduction of tumor volume before changes on con-ventional MR imaging.15,16,27-29However, the opposite was observed in this study. There was a significant⬇20% reduc-tion of ADC, whereas FA increased by⬇30% between base-line and the early posttreatment phase. With ADC and FA as surrogates for tissue status at the microscopic level, this find-ing would suggest that lesions after RT are apparently more cellular with less extracellular fluid accumulation. It is possible that the observed diffusion characteristics were a result of competing effects, such that cell death and increased diffusion may have been more than compensated for by the reduction of extracellular space (therefore reduced diffusion). However, in recent MR spectroscopy studies, metabolic indicators for a significant response to therapy (decreased metabolite con-centrations, particularly choline, and increased lipids due to cell membrane breakdown) were generally not observed.30 Therefore, the often-noted reduction of lesion volume after therapy is less likely to be caused by a loss of tumor cells. More likely is a tumor volume reduction due to reduced vasogenic edema consistent with the transient clinical improvement in DIBSG.
In this study, ADC decreased after RT in all patients with DIBSG. However, the extent of the decrease did not correlate with⌬TEFSafter therapy. Indeed, there was a tendency toward longer survival in patients in whom a more substantial drop of ADC was observed, though significance was not reached.
A significant positive correlation between⌬FAand⌬TEFS was observed at the caudal midbrain level. In other words, patients with the most pronounced change from isotropic to-ward anisotropic diffusion had the longest⌬TEFS. All patients in our study received steroids at the time of diagnosis, with the intention of removing extracellular water and reducing peritumoral edema. Several studies have shown significant de-creases in ADC in both peritumoral edema and the solid com-ponent of the tumors between 48 and 72 hours after steroid administration.31,32 In addition, a recent study has shown significant ADC drop in gliomas treated by Avastin (bevaci-zumab), whose antitumoral effect is still controversial.33,34 Therefore, our interpretation is that vasogenic edema has been met effectively with anticancer therapy and steroids, by
im-proving the vascular structure and the leakiness of blood vessels.
ADC and FA of Individual Anatomic Regions
Our study indicates that diffusion characteristics at the caudal midbrain are most relevant in respect to prognoses. Baseline ADC and FA in the caudal midbrain showed the most sig-nificant correlation with overall survival. In addition, of all posttherapy changes, only⌬FAat the caudal midbrain level correlated with⌬TEFS. This observation suggests that a careful analysis of all substructures involved is of importance for optimal patient management. The reason for the significance of the caudal midbrain is unclear. It could be that micro-environmental factors (“seed and soil”) cause tumors involv-ing caudal midbrain structures to be particularly infiltrative or to transition, with a higher likelihood, from lower grade to higher grade lesions. It has also been shown that tumors orig-inating from different locations vary in their genetic profile,9 and the caudal midbrain may be associated with more malig-nant subtypes.
Is There an Added Value in Measuring FA?
A standard diffusion-weighted MR imaging scan is very fast and can be accomplished typically within 1 minute of total scanning time. DTI, particularly with a large number of diffu-sion directions, can take several minutes. This may stress young patients because of the high noise level during a longer period. However, in a previous study, it was demonstrated that FA was more sensitive than ADC in demonstrating tumor in-filtration in supratentorial gliomas.35In this study, we found that only⌬FA(in the caudal midbrain) correlated with⌬TEFS. While the number patients enrolled in this study was small and prospective confirmation is clearly needed, this finding indicates that there might be added value in performing more complex DTI studies instead of diffusion-weighted imaging alone.
Limitations
Apart from the small number of patients enrolled, a result of the low incidence of the disease, a number of other limitations of this study need to be acknowledged. First, histologic confir-mation of the tumor type was available only in 1 subject, whereas no biopsies or postmortem examinations were avail-able for the remaining subjects. Therefore a definitive correla-tion of diffusion changes with tumor biology was not possible at this point.
leveled off to the extent possible in individual patients. With DTI performed typically every 3 months, there is the possibil-ity of underdetected changes in ADC and FA, particularly dur-ing initial RT.
Finally, for advanced imaging such as DTI to become useful for patient management in clinical settings, methods need to be used that are both robust and reproducible. However, approaches for obtaining mean ADC, ADCmin, ADCmax, mean FA, FAmin, and FAmaxare variable and sensitive to user bias. For example, in 1 study the ADCminwas obtained from 5 to ten 40- to 60-mm2regions of interest within solid com-ponents of the tumor on the ADC maps.14Other groups ob-tained ADCminby placing regions of interest in the solid tumor components on each contiguous section and selecting the lowest ADC value by visual inspection.26,36 In our study, we outlined the solid tumor component at 5 readily recogniz-able anatomic levels and obtained ADC and FA values for these regions. Obtaining ADC and FA from these relatively large areas will result in an overestimation (underestimation) of ADCmaxand ADCminand FAmaxand FAmin. On the other hand, this method is fast and involves only a minimum of subjectivity (avoiding cystic, necrotic, and hemorrhagic areas) and is thus robust and reproducible.
Conclusions
ADC and FA values of diffuse intrinsic brain stem gliomas at presentation were consistent with tumors with extensive edema formation. There was a significant correlation between initial diffusion characteristics and survival. Patients with tu-mors with higher diffusivity and more isotropic diffusion tended to live longer. After therapy, diffusion was more re-stricted and became more anisotropic. This is not consistent with a significant response to therapy and may mainly reflect reduced edema. Of the posttherapeutic changes, only⌬FAin the caudal midbrain correlated with event-free survival. This suggests that anatomic considerations are important when reviewing DTI data and demonstrates the added value of performing DTI.
Acknowledgments
We thank Julia Castro and Arabhi Nagasunder for assistance with the review of medical records and manuscript prepara-tion and Jane Tavare for help with the statistical analyses.
References
1. Smith MA, Freidlin B, Ries LA, et al.Trends in reported incidence of primary malignant brain tumors in children in the United States.J Natl Cancer Inst
1998;90:1269 –77
2. Freeman CR, Farmer JP.Pediatric brain stem gliomas: a review.Int J Radiat Oncol Biol Phys1998;40:265–71
3. Hargrave D, Bartels U, Bouffet E.Diffuse brainstem glioma in children: critical review of clinical trials.Lancet Oncol2006;7:241– 48
4. Donahue KM, Burstein D, Manning WJ, et al.Studies of Gd-DTPA relaxivity and proton exchange rates in tissue.Magn Reson Med1994;32:66 –76 5. Albright AL, Packer RJ, Zimmerman R, et al. Magnetic resonance scans
should replace biopsies for the diagnosis of diffuse brain stem gliomas: a report from the Children’s Cancer Group.Neurosurgery1993;33:1026 –29, discussion 1029 –30
6. Barkovich AJ, Krischer J, Kun LE, et al.Brain stem gliomas: a classification system based on magnetic resonance imaging.Pediatr Neurosurg1990;16: 73– 83
7. Laprie A, Pirzkall A, Haas-Kogan DA, et al.Longitudinal multivoxel MR
spectroscopy study of pediatric diffuse brainstem gliomas treated with radio-therapy.Int J Radiat Oncol Biol Phys2005;62:20 –31
8. Liu AK, Brandon J, Foreman NK, et al.Conventional MRI at presentation does not predict clinical response to radiation therapy in children with diffuse pontine glioma.Pediatr Radiol2009;39:1317–20
9. Jbabdi S, Mandonnet E, Duffau H, et al.Simulation of anisotropic growth of low-grade gliomas using diffusion tensor imaging.Magn Reson Med2005;54: 616 –24
10. Gupta RK, Cloughesy TF, Sinha U, et al.Relationships between choline mag-netic resonance spectroscopy, apparent diffusion coefficient and quantitative histopathology in human glioma.J Neurooncol2000;50:215–26
11. Kono K, Inoue Y, Nakayama K, et al.The role of diffusion-weighted imaging in patients with brain tumors.AJNR Am J Neuroradiol2001;22:1081– 88 12. Sugahara T, Korogi Y, Kochi M, et al.Usefulness of diffusion-weighted MRI
with echo-planar technique in the evaluation of cellularity in gliomas.J Magn Reson Imaging1999;9:53– 60
13. Gauvain KM, McKinstry RC, Mukherjee P, et al.Evaluating pediatric brain tumor cellularity with diffusion-tensor imaging.AJR Am J Roentgenol2001; 177:449 –54
14. Murakami R, Sugahara T, Nakamura H, et al.Malignant supratentorial astro-cytoma treated with postoperative radiation therapy: prognostic value of pretreatment quantitative diffusion-weighted MR imaging.Radiology2007; 243:493–99
15. Ross BD, Moffat BA, Lawrence TS, et al.Evaluation of cancer therapy using diffusion magnetic resonance imaging.Mol Cancer Ther2003;2:581– 87 16. Mardor Y, Roth Y, Lidar Z, et al.Monitoring response to convection-enhanced
taxol delivery in brain tumor patients using diffusion-weighted magnetic res-onance imaging.Cancer Res2001;61:4971–73
17. Helton KJ, Phillips NS, Khan RB, et al.Diffusion tensor imaging of tract in-volvement in children with pontine tumors.AJNR Am J Neuroradiol2006; 27:786 –93
18. Field AS, Alexander AL, Wu YC, et al.Diffusion tensor eigenvector directional color imaging patterns in the evaluation of cerebral white matter tracts al-tered by tumor.J Magn Reson Imaging2004;20:555– 62
19. Beppu T, Inoue T, Shibata Y, et al.Measurement of fractional anisotropy using diffusion tensor MRI in supratentorial astrocytic tumors.J Neurooncol2003; 63:109 –16
20. Cohen ME, Duffner PK, Heffner RR, et al.Prognostic factors in brainstem gliomas.Neurology1986;36:602– 05
21. Albright AL, Guthkelch AN, Packer RJ, et al.Prognostic factors in pediatric brain-stem gliomas.J Neurosurg1986;65:751–55
22. Halperin EC, Wehn SM, Scott JW, et al.Selection of a management strategy for pediatric brainstem tumors.Med Pediatr Oncol1989;17:117–26
23. Cohen M, Duffner P.Brainstem glioma.In: Cohen M, Duffner P, eds.Brian Tumors in Children. New York: Raven; 1984:156 –72
24. Edwards MS, Wara WM, Urtasun RC, et al.Hyperfractionated radiation ther-apy for brain-stem glioma: a phase I-II trial.J Neurosurg1989;70:691–700 25. Nelson MD Jr, Soni D, Baram TZ.Necrosis in pontine gliomas: radiation
in-duced or natural history?Radiology1994;191:279 – 82
26. Higano S, Yun X, Kumabe T, et al.Malignant astrocytic tumors: clinical importance of apparent diffusion coefficient in prediction of grade and prog-nosis.Radiology2006;241:839 – 46
27. Ananthnarayan S, Bahng J, Roring J, et al.Time course of imaging changes of GBM during extended bevacizumab treatment.J Neurooncol2008;88:339 – 47 28. Kauppinen RA.Monitoring cytotoxic tumour treatment response by diffu-sion magnetic resonance imaging and proton spectroscopy.NMR Biomed
2002;15:6 –17
29. Chenevert TL, McKeever PE, Ross BD.Monitoring early response of experi-mental brain tumors to therapy using diffusion magnetic resonance imaging. Clin Cancer Res1997;3:1457– 66
30. Panigrahy A, Nelson MD Jr, Finlay JL, et al..Metabolism of diffuse intrinsic brainstem gliomas in children.Neuro Oncol2008;10:32– 44. Epub 2007 Nov 14 31. Sinha S, Bastin ME, Whittle IR, et al.Diffusion tensor MR imaging of
high-grade cerebral gliomas.AJNR Am J Neuroradiol2002;23:520 –27
32. Bastin ME, Carpenter TK, Armitage PA, et al.Effects of dexamethasone on cerebral perfusion and water diffusion in patients with high-grade glioma. AJNR Am J Neuroradiol2006;27:402– 08
33. Rieger J, Ba¨hr O, Mu¨ller K, et al.Bevacizumab-induced diffusion-restricted lesions in malignant glioma patients.J Neurooncol2010;99:49 –56
34. Jain R, Scarpace LM, Ellika S, et al.Imaging response criteria for recurrent gliomas treated with bevacizumab: role of diffusion-weighted imaging as an imaging biomarker.J Neurooncol2010;96:423–31
35. Stadlbauer A, Ganslandt O, Buslei R, et al.Gliomas: histopathologic evaluation of changes in directionality and magnitude of water diffusion at diffusion-tensor MR imaging.Radiology2006;240:803–10