Managerial Use of Factor Analysis
for Identifying Stability of Yield
Parameters and Morphological
Characters in Barley Trials
Dr. Ahmed Abdullah
Damascus University, Syria
Abstract
This paper aims to demonstrate the usefulness of factor analysis for managing barley trials. It shows whether the relationship between barley yield parameters and morphological characters were affected by genotype and environment. The objectives of this study were to determine whether or not the interrelationship between barley yield parameters (total plant yield, grain yield, straw yield and thousand grain weight), and the morphological characters (vegetative duration, plant height, length of growing season and leafiness) was stable in each hybrid (hybrid 1, hybrid 2 and hybrid 3) and each of two areas in Syria by using factor analysis. The study also aimed to ascertain whether the relationship between yield parameters and morphological characters was affected by genotype environment interaction. There were three hybrids in each of the two Syrian areas: Tel Hadya and Breda. Each hybrid had 102 families. Correlation and factor analysis indicated that the interrelationship for yield parameters, except TGW, was stable, while the interrelationship between morphological characters was not stable. Factor analysis was applied to barley breeding data to determine the relationships between yield parameters and morphological characters. The results demonstrate that this relationship was stable in Tal Hadya, but not stable in Breda. The genotype and the environment influenced the relationship between yield parameters and morphological characters. Consequently, the relationship between yield parameters and morphological characters will not be suitable for forecasting yield.
1. Introduction
Barley is one of the best cereals for cultivation in dry and semi-dry areas. It is the world’s fourth most important cereal in terms of production, (after wheat, rice, and maize) and is the second most important (after wheat) in the Middle East and North Africa (Amabile et al., 2014). The effective management of barley production is complicated by a number of contingency factors, which makes it almost unpredictable. Therefore, the formative use of factor analysis was introduced by the author in order to ensure that all influencing barley growth factors are evaluated using a unified framework.
Syria is one the major cereal-producing countries of the Middle East. However, the country’s water supply is becoming progressively scarce, and the future demand for water threatens to surpass available resources. Thus, much research has been focused on increasing barley yields. Factor analysis was envisaged to be the most suitable tool to support the efficient processing of outcomes of barley trials and associated with it managerial decision making towards choosing better yields of barley cultivation.
In 1901, Pearson discovered a new method in multivariate analysis: this method was factorial analysis. However, it is Spearman, who devoted more than 40 years of his life to the development of factor analysis, who is regarded as the father of the subject (Harman 1976). Factor analysis is one of the techniques used for reducing a set of variables to a lower number of unobserved variables called factors (Johnson and Wichern, 2006), and it has been used for decision-making in many business and management related areas. For example, Kalutara et al. (2012) used factor analysis to establish a decision-making framework for the sustainable management of community buildings in Australia. In 2003, Pett, Lakey et al. published a book on the use of factor analysis for research instrument development in health care.
Factor analysis has also been making its way to agricultural science to inform decision-making of multiplicity of conditions affecting growth of crops. It has been used, for example, to study the relationships between several site variables and corn yields in the fields of five producers (Mallarino et al. 1999). The main results were that the set of measured factors allowed for explanation of yield variability. Factor analysis was applied to the data to observe the effects of the genetics of beans on yield in order to increase yield and improve quality (Nasser 2002). Statistical analysis of agronomic traits could be informative in selecting parents for generation of new varieties or breeds because agronomic traits are a reflection of gene effects. The use of factor analysis provides reliable information for the calculation of genetic distance and gives a complete picture of genetic variability contributed by each trait (Parvathaneni et al., 2011).
the yield of dry beans through the analysis of plant variables. Factor analysis was applied to 22 morphological and yield-determining traits of 16 cultivars and strains of dry beans. Denis and Adams, 1978, applied factor analysis to indicate that plants height, numerous nodes, leaves, and reproductive structures were the most important variables affecting yield.
Factor analysis has also been used with breeding programmes. For example, Smith et al., 2001, used many kinds of analysis, including factor analysis, to study the genetics of barley. They used a large set of barley data from South Australiain different trials to reduce the number of factors and to see how the variance and co-variance changed. In 2002, Volis et al. employed factor analysis to reduce 20 measured morphological and phonological traits of wild barley before using multiple regression analysis. The study of Volis et al. (2002) showed that, for high water, nutrients (as variables) and ecotype plant size (RF1 as a factor) significantly affected plant fitness, whether estimated by reproductive biomass or by yield. In 1999, Bertholdsson used factor analysis to find the best barley for malt. He discovered a type of barley with low and stable grain protein content (GPC) suitable for use with malt. In a similar way, Parvathaneni et al. (2011) used factor analysis to understand the morphological and molecular diversity among the genotypes of cucumber.
It is important to study the divergence and genetic relationships among the barley accessions since the characterisation of genetic variability helps to identify better genotypes which could be used in hybridisations as parents and improves quality of agricultural products (Amabile et al., 2014). The use of factor analysis in this context can help to reduce a large set of traits to a smaller but meaningful set of traits, thereby allowing researchers and practitioner to identify trait that contributes to maximum variability since genetic improvements largely depends on the magnitude of genetic variation (Parvathaneni et al., 2011).
The goal of this research is to observe the most influential choices in studying the interrelationship between yield parameters, the interrelationship between morphological characters and the relationship between yield parameters and morphological characters for barley trials, and also to see whether this interrelationship was stable for each of the yield parameters and morphological characters. Factor analysis was also used to determine whether the relationship between yield parameters and morphological characters was stable, or whether genotype environment interaction had affected this relationship in order to organise the most effective parameters for the optimal harvesting of barley.
2. Materials and Methods
2.1. Materials
Eight parameters were registered. Total plant yield: A plot of barley, two metres square was harvested from each experimental plot after removing the border rows. Total plant yield was recorded and expressed as kg.ha-1. Grain yield was measured after mechanically separating grain from straw, expressed as kg.ha-1; straw yield (kg.ha-1); thousand grain weight (TGW); vegetative duration (the number of days from germination until 50% ear emergence); plant height (cm) was estimated by taking the mean of three random samples from each experimental plot; length of growing season (the number of days from germination to harvest); and leafiness (divided into five scores: score 1: very low leafiness; score 2: low; score 3: medium; score 4: high; and score 5: very high).
2.2. Statistical methods
Factor analysis was used to find the interrelationship among parameters and to study the stability of this relationship. The principal component factor analysis method is probably the most widely used with factor analysis (Kollo and von Rosen, 2006). It was used to calculate eigenvalue, factor loading, the communalities, the unique (error) variance and cumulative proportion. Other methods are used in combination with factor analysis, for example, maximum likelihood methods (Johnson and Wichern, 2006).
• The eigenvalues
λ
: The factors with eigenvalues greater than 1.00 are considered significant, while all factors with eigenvalues less than 1.00 are considered insignificant, and are disregarded (Child, 1990; Härdle and Hlávka, 2007; Johnson and Wichern, 2006). It is given by the equation:0
=
− I
A
λ
(1)Where AK×K is a matrix and IK×Kis an identity matrix,
λ
1 ≥λ
2 ≥...≥λ
k ≥0E is called eigenvectors of the matrix A associated with the eigenvalue
λ
(Child 1990) when:E
AE=
λ
(2)• The factor loadings: the correlations between variables and factors are called factor loadings (Manly and Alberto 2016). It is given by the equation:
k i
where e
lˆi i (i) 1,2,...,
2 / 1 )
( =
λ
= (3)Where:
λ
is an eigenvalue and e(1),...,e(k)are the eigenvectors ofR−ψˆ(The reduced correlation matrix).• The communalitieshi2: The communality for a measured variable reflects how much of the variance of a given measured variable is useful in delineating the factor as a set. It is the sum of squared factor loading for that variable, and the value of communality is between 0.0 and 1.0 (Kline, 1984). It is given by the equation:
== − =
k
i ij ii
i l
h
1 2
2 ˆ
ˆ 1
ˆ ψ (4)
k i where h l i k i ij
ii 1 ˆ 1 1,2,...,
ˆ 2 1 2 = − = − =
= ψ (5)• Cumulative proportion (total % of variance; R2):the variance which is explained by each factor (Hair et al. 2005). For example: the variance which is explained by first factor is:
. ˆ 1 parameters of number is k where k λ
The cumulative proportion is given by:
k j where k j ≤ + +
+
λ
λ
λ
ˆ1 ˆ2 ... ˆ(6)
3. Results and Discussion
Factor analysis was used to study the interrelationship between yield parameters (total plant yieldx1, grain yieldx2, straw yieldx3, TGWx4) and the interrelationship between
morphological characters (vegetative durationx5, plant heightx6, length of growing
season x7 and leafinessx8). This use of Factor analysis utilised correlation matrix between variables to determine which sets of variables would cluster together (Dillon et al. 1984).
3.1. The interrelationship among variables in Tel Hadya
The simple correlation matrix between parameters for hybrid 1 is given as:
− − − − − − − = 1 049 . 0 290 . 0 108 . 0 089 . 0 214 . 0 162 . 0 210 . 0 1 133 . 0 265 . 0 324 . 0 105 . 0 020 . 0 450 . 0 1 304 . 0 026 . 0 322 . 0 256 . 0 323 . 0 1 319 . 0 230 . 0 161 . 0 218 . 0 1 046 . 0 057 . 0 058 . 0 1 588 . 0 884 . 0 1 897 . 0 1 * * * * 8 * * * * * * 7 * * * * * * * 6 * * * * * 5 4 * * * * 3 * * 2 1 8 7 6 5 4 3 2 1 x x x x x x x x x x x x x x x x r
** Correlation is significant at the 0.01 level (2-tailed) * Correlation is significant at the 0.05 level (2-tailed)
According to the above simple correlation matrix, it can be seen that the total plant yield was strongly correlated to grain yield and straw yield (r=0.897, 0.884, P<0.05 respectively). Grain yield was significantly correlated to straw yield ((r=0.588, P<0.05). Grain yield was not correlated to vegetative duration (r=-0.161, P>0.05) while total plant yield, straw yield and TGW had a significant weak correlation with vegetative duration (r=-0.218,-0.230, 0.319, P<0.05 respectively). Plant height is significantly correlated to all parameters except TGW and vegetative duration (r=0.026, 0.108, P>0.05 respectively) (Mohammadi, et al. 2012). Leafiness is also
factor was TGW, vegetative duration and length of growing season. The third factor was plant height and leafiness. The result for applying principle component factor analysis with SPSS program is given by Table 1. According to Table 1, Hybrid 1, there were three factors considered only because eigenvalue four (λˆ4 =0.805) was less than 1.
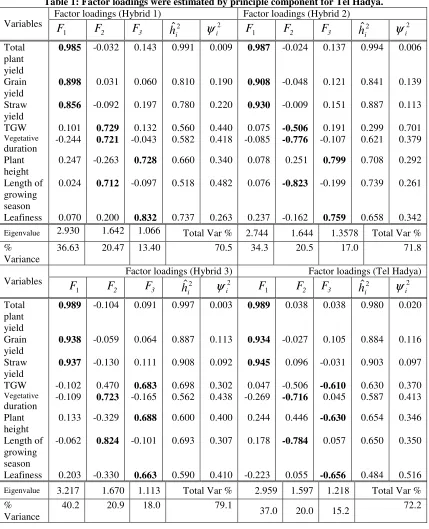
Table 1: Factor loadings were estimated by principle component for Tel Hadya.
Factor loadings (Hybrid 1) Factor loadings (Hybrid 2) Variables
1
F F2 F3 hˆi2
2
i
ψ F1 F2 F3 hˆi2
2
i
ψ
Total plant yield
0.985 -0.032 0.143 0.991 0.009 0.987 -0.024 0.137 0.994 0.006
Grain yield
0.898 0.031 0.060 0.810 0.190 0.908 -0.048 0.121 0.841 0.139 Straw
yield
0.856 -0.092 0.197 0.780 0.220 0.930 -0.009 0.151 0.887 0.113 TGW 0.101 0.729 0.132 0.560 0.440 0.075 -0.506 0.191 0.299 0.701
Vegetative
duration -0.244
0.721 -0.043 0.582 0.418 -0.085 -0.776 -0.107 0.621 0.379 Plant
height
0.247 -0.263 0.728 0.660 0.340 0.078 0.251 0.799 0.708 0.292 Length of
growing season
0.024 0.712 -0.097 0.518 0.482 0.076 -0.823 -0.199 0.739 0.261
Leafiness 0.070 0.200 0.832 0.737 0.263 0.237 -0.162 0.759 0.658 0.342
Eigenvalue 2.930 1.642 1.066 Total Var % 2.744 1.644 1.3578 Total Var %
% Variance
36.63 20.47 13.40 70.5 34.3 20.5 17.0 71.8 Factor loadings (Hybrid 3) Factor loadings (Tel Hadya) Variables
1
F F2 F3 ˆ2
i
h ψi2 F1 F2 F3 hˆi2
2
i
ψ
Total plant yield
0.989 -0.104 0.091 0.997 0.003 0.989 0.038 0.038 0.980 0.020
Grain yield
0.938 -0.059 0.064 0.887 0.113 0.934 -0.027 0.105 0.884 0.116 Straw
yield
0.937 -0.130 0.111 0.908 0.092 0.945 0.096 -0.031 0.903 0.097 TGW -0.102 0.470 0.683 0.698 0.302 0.047 -0.506 -0.610 0.630 0.370
Vegetative
duration -0.109
0.723 -0.165 0.562 0.438 -0.269 -0.716 0.045 0.587 0.413 Plant
height
0.133 -0.329 0.688 0.600 0.400 0.244 0.446 -0.630 0.654 0.346 Length of
growing season
-0.062 0.824 -0.101 0.693 0.307 0.178 -0.784 0.057 0.650 0.350
Leafiness 0.203 -0.330 0.663 0.590 0.410 -0.223 0.055 -0.656 0.484 0.516
Eigenvalue 3.217 1.670 1.113 Total Var % 2.959 1.597 1.218 Total Var % %
Variance
40.2 20.9 18.0 79.1
The first factor accounted for about 36.63% of total variance, while 20.47% and 13.40% of total variance were explained by factor two and factor three respectively. The total variance, which is significantly underpinned by three factors, was 70.5% (Table 1). According to factor loading for Hybrid 1, the first factor correlated with total plant yield (0.985), grain yield (0.898) and straw yield (0.856). The second factor correlated with TGW (0.729), vegetative duration (0.721) and length of growing season (0.712). The third factor correlated with plant height (0.728) and leafiness (0.832). All loading factors for hybrid 1 have a positive loading on the factors. 99.1% of variance for total plant yield, 81% of variance for grain yield and 78% for straw yield are explained by the three factors, but most of this variance is explained by the first factor. Also 56%, 58.2%, 51.8% of variance for TGW, vegetative duration and length of growing season is respectively explained by three factors, while 66%, 73.7% of variance for plant height and leafiness is explained by these factors (Walton 1972).
Most of the numbers in the residual matrix were very small (less than 0.2 consistent with Kline, 1994) except for the covariance between vegetative duration and length of growing season (25%) and 28% of covariance between length of growing season and leafiness (Table 2). According to the conducted factor analysis, the morphological characters did not affect yield parameters because yield parameters (except TGW) and morphological characters had not grouped together in one factor. These results contradict the findings of (Fonge et al. 2016).
The results for applying factor analysis for each hybrid (hybrid 2 and hybrid 3) and Tel Hadya are given by Table 1. Table 1 shows that there were only three factors in each field (hybrid 2, hybrid 3 and Tel Hadya) because the eigenvalue four (λˆ4) was less than 1 (Manly, 1994). The variance value explained by this model ranged from 71.8% (hybrid 2) to 79.1% (hybrid 3), and the cumulative variances (R2) were statistically significant. For three fields (hybrid 2, hybrid 3 and Tel Hadya), it can be seen that there were three factors. The first factor (for all fields) strongly connected with total plant yield, grain yield and straw yield. This factor explains variance ranging from 34.3% for hybrid 2 and 40.2% for hybrid 3 (Table 1). The second factor, which accounted for about 20.5% of the variation, was strongly correlated with vegetative duration and length of growing season for three fields (Table 1). TGW correlated with the second factor only for hybrid 2 (Walton 1972). However, the communality
vegetative duration, length of growing season and plant height were stable and more than 60%.
[image:8.595.87.509.214.484.2]The residual, indicated by Table 2, was small; however, the residual covariance between leafiness and plant height was nearly 25%. The covariance between TGW and leafiness was 28.4% for Tel Hadya. Also the residual indicated that TGW and leafiness were not stable (Table 2). In conclusion, the interrelationship between yield parameters (except TGW) and the interrelationship between morphological characters were not affected by genotype.
Table 2: The residual matrix correspondence to factors (hybrid 1,2,3 and Tel Hadya respectively)
Hybird1 − − − − − − − − − − − − − − − − 0 015 . 0 381 . 0 016 . 0 174 . 0 008 . 0 042 . 0 029 . 0 0 119 . 0 247 . 0 185 . 0 040 . 0 017 . 0 032 . 0 0 022 . 0 097 . 0 057 . 0 001 . 0 032 . 0 0 177 . 0 053 . 0 038 . 0 051 . 0 0 000 . 0 065 . 0 038 . 0 0 190 . 0 010 . 0 0 006 . 0 0 8 7 6 5 4 3 2 1 8 7 6 5 4 3 2 1 x x x x x x x x x x x x x x x x Hybrid 2 − − − − − − − − − − − − − − − − 0 023 . 0 282 . 0 023 . 0 182 . 0 004 . 0 041 . 0 027 . 0 0 118 . 0 251 . 0 181 . 0 039 . 0 014 . 0 028 . 0 0 018 . 0 094 . 0 054 . 0 006 . 0 028 . 0 0 179 . 0 063 . 0 023 . 0 042 . 0 0 005 . 0 058 . 0 031 . 0 0 193 . 0 009 . 0 0 003 . 0 0 8 7 6 5 4 3 2 1 8 7 6 5 4 3 2 1 x x x x x x x x x x x x x x x x Hybrid 3 − − − − − − − − − − − − − − − − − 0 029 . 0 270 . 0 061 . 0 194 . 0 013 . 0 024 . 0 019 . 0 0 063 . 0 153 . 0 171 . 0 000 . 0 024 . 0 010 . 0 0 118 . 0 057 . 0 024 . 0 010 . 0 020 . 0 0 254 . 0 045 . 0 003 . 0 029 . 0 0 044 . 0 044 . 0 010 . 0 0 130 . 0 021 . 0 0 021 . 0 0 x x x x x x x x x x x x x x x x 8 7 6 5 4 3 2 1 8 7 6 5 4 3 2 1 Tel Hdya − − − − − − − − − − − − − − − 0 001 . 0 239 . 0 099 . 0 284 . 0 055 . 0 092 . 0 076 . 0 0 148 . 0 190 . 0 149 . 0 031 . 0 068 . 0 050 . 0 0 094 . 0 091 . 0 031 . 0 061 . 0 048 . 0 0 183 . 0 064 . 0 041 . 0 054 . 0 0 040 . 0 015 . 0 030 . 0 0 070 . 0 019 . 0 0 018 . 0 0 x x x x x x x x x x x x x x x x 8 7 6 5 4 3 2 1 8 7 6 5 4 3 2 1
3.3. The interrelationship among variables in Breda
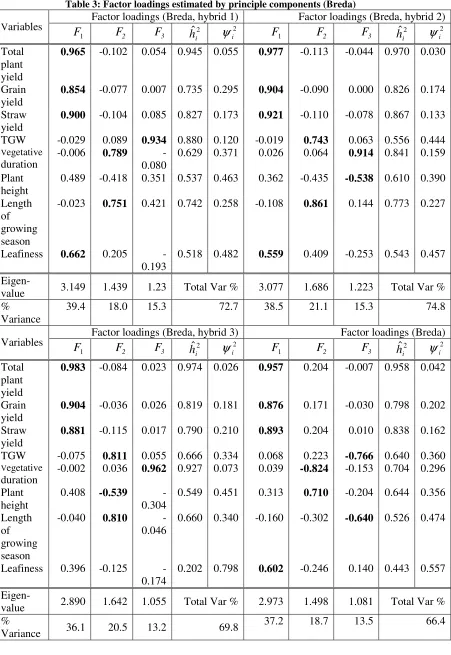
Table 3: Factor loadings estimated by principle components (Breda)
Factor loadings (Breda, hybrid 1) Factor loadings (Breda, hybrid 2)
Variables
1
F F2 F3 ˆ2
i
h ψi2 F1 F2 F3 hˆi2
2
i
ψ
Total plant yield
0.965 -0.102 0.054 0.945 0.055 0.977 -0.113 -0.044 0.970 0.030
Grain yield
0.854 -0.077 0.007 0.735 0.295 0.904 -0.090 0.000 0.826 0.174
Straw yield
0.900 -0.104 0.085 0.827 0.173 0.921 -0.110 -0.078 0.867 0.133
TGW -0.029 0.089 0.934 0.880 0.120 -0.019 0.743 0.063 0.556 0.444
Vegetative
duration
-0.006 0.789 -0.080
0.629 0.371 0.026 0.064 0.914 0.841 0.159
Plant height
0.489 -0.418 0.351 0.537 0.463 0.362 -0.435 -0.538 0.610 0.390
Length of growing season
-0.023 0.751 0.421 0.742 0.258 -0.108 0.861 0.144 0.773 0.227
Leafiness 0.662 0.205 -0.193
0.518 0.482 0.559 0.409 -0.253 0.543 0.457
Eigen-value 3.149 1.439 1.23 Total Var % 3.077 1.686 1.223 Total Var % %
Variance
39.4 18.0 15.3 72.7 38.5 21.1 15.3 74.8
Factor loadings (Breda, hybrid 3) Factor loadings (Breda) Variables
1
F F2 F3 hˆi2
2
i
ψ F1 F2 F3 hˆi2
2
i
ψ
Total plant yield
0.983 -0.084 0.023 0.974 0.026 0.957 0.204 -0.007 0.958 0.042
Grain yield
0.904 -0.036 0.026 0.819 0.181 0.876 0.171 -0.030 0.798 0.202
Straw yield
0.881 -0.115 0.017 0.790 0.210 0.893 0.204 0.010 0.838 0.162
TGW -0.075 0.811 0.055 0.666 0.334 0.068 0.223 -0.766 0.640 0.360
Vegetative
duration
-0.002 0.036 0.962 0.927 0.073 0.039 -0.824 -0.153 0.704 0.296 Plant
height
0.408 -0.539 -0.304
0.549 0.451 0.313 0.710 -0.204 0.644 0.356
Length of growing season
-0.040 0.810 -0.046
0.660 0.340 -0.160 -0.302 -0.640 0.526 0.474
Leafiness 0.396 -0.125 -0.174
0.202 0.798 0.602 -0.246 0.140 0.443 0.557
Eigen-value 2.890 1.642 1.055 Total Var % 2.973 1.498 1.081 Total Var % %
Variance 36.1 20.5 13.2 69.8
The total variance, explained by three factors, for total plant yield, grain yield and straw yield, is indicated in Table 4. The three factors explained more than 73% of variance, although most of the variance was explained by the first factor. All the variables were stable except leafiness, because the variance, which was explained by three factors, was 20.2% (hybrid 3), and 69.8 for hybrid 2 69.8% (Table 3).
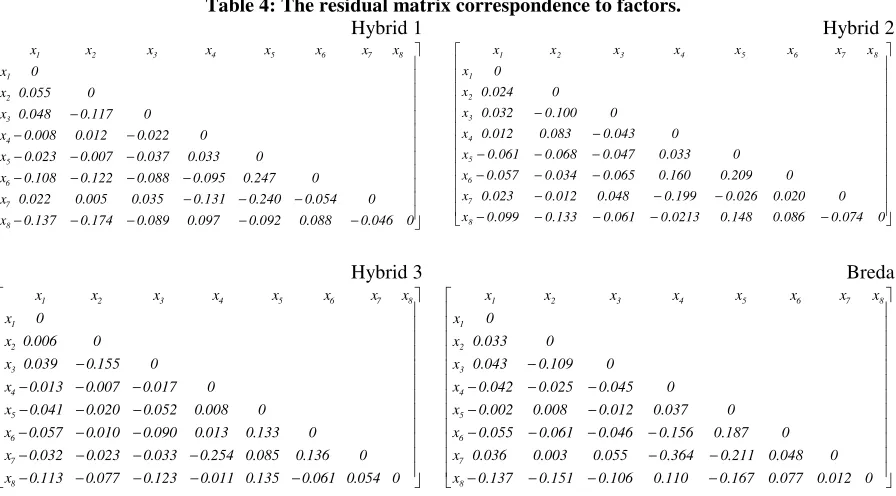
[image:10.595.76.524.258.506.2]The residual, indicated by Table 4, was small, but the residual covariance between length of growing season and TGW was nearly 34% (hybrid 3 and Breda). Also, the residual covariance between vegetative duration and duration of growing season and plant height was about 24% (hybrid 1). In conclusion, the interrelationship between yield parameters was not affected by genotype (except TGW), while the interrelationship between morphological characters was affected by genotype.
Table 4: The residual matrix correspondence to factors.
Hybrid 1 Hybrid 2
− − − − − − − − − − − − − − − − − − 0 046 . 0 088 . 0 092 . 0 097 . 0 089 . 0 174 . 0 137 . 0 0 054 . 0 240 . 0 131 . 0 035 . 0 005 . 0 022 . 0 0 247 . 0 095 . 0 088 . 0 122 . 0 108 . 0 0 033 . 0 037 . 0 007 . 0 023 . 0 0 022 . 0 012 . 0 008 . 0 0 117 . 0 048 . 0 0 055 . 0 0 x x x x x x x x x x x x x x x x 8 7 6 5 4 3 2 1 8 7 6 5 4 3 2 1 − − − − − − − − − − − − − − − − 0 074 . 0 086 . 0 148 . 0 0213 . 0 061 . 0 133 . 0 099 . 0 0 020 . 0 026 . 0 199 . 0 048 . 0 012 . 0 023 . 0 0 209 . 0 160 . 0 065 . 0 034 . 0 057 . 0 0 033 . 0 047 . 0 068 . 0 061 . 0 0 043 . 0 083 . 0 012 . 0 0 100 . 0 032 . 0 0 024 . 0 0 x x x x x x x x x x x x x x x x 8 7 6 5 4 3 2 1 8 7 6 5 4 3 2 1 Hybrid 3 Breda − − − − − − − − − − − − − − − − − − − 0 054 . 0 061 . 0 135 . 0 011 . 0 123 . 0 077 . 0 113 . 0 0 136 . 0 085 . 0 254 . 0 033 . 0 023 . 0 032 . 0 0 133 . 0 013 . 0 090 . 0 010 . 0 057 . 0 0 008 . 0 052 . 0 020 . 0 041 . 0 0 017 . 0 007 . 0 013 . 0 0 155 . 0 039 . 0 0 006 . 0 0 x x x x x x x x x x x x x x x x 8 7 6 5 4 3 2 1 8 7 6 5 4 3 2 1 − − − − − − − − − − − − − − − − 0 012 . 0 077 . 0 167 . 0 110 . 0 106 . 0 151 . 0 137 . 0 0 048 . 0 211 . 0 364 . 0 055 . 0 003 . 0 036 . 0 0 187 . 0 156 . 0 046 . 0 061 . 0 055 . 0 0 037 . 0 012 . 0 008 . 0 002 . 0 0 045 . 0 025 . 0 042 . 0 0 109 . 0 043 . 0 0 033 . 0 0 x x x x x x x x x x x x x x x x 8 7 6 5 4 3 2 1 8 7 6 5 4 3 2 1
3.4. Stability of the relationship between variables
To study the stability of the relationships, factor analysis was used to identify how the parameters (total plant yield x1, grain yield x2, straw yield x3, TGW x4, vegetative duration
5
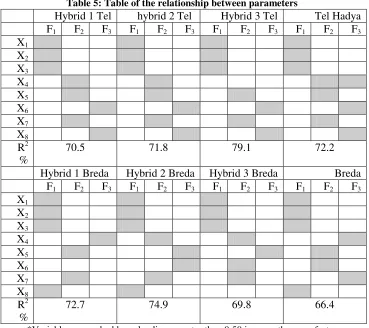
duration with a different factor. For hybrid 2 (Breda), the plant height grouped with vegetative duration in factor 3, while in Breda, this correlate between them showed in factor 3. Plant height was connected to TGW and length of growing season for hybrid 3 (Table 5). The relationship between yield parameters and morphological characters was affected by location. The factors in Tel Hadya and Breda did not have the same group of parameters. For example, in Tel Hadya, leafiness did not correlate with yield parameters (total plant yield, grain yield and straw yield), while in Breda it correlated with yield parameters. Vegetative duration was grouped with length of growing season in Tel Hadya, while in Breda the length of growing season was grouped with TGW. Consequently, the relationship between yield parameters and morphological characters had been affected by genotype environment interaction.
Table 5: Table of the relationship between parameters*
Hybrid 1 Tel hybrid 2 Tel Hybrid 3 Tel Tel Hadya F1 F2 F3 F1 F2 F3 F1 F2 F3 F1 F2 F3
X1
X2
X3
X4
X5
X6
X7
X8
R2 %
70.5 71.8 79.1 72.2
Hybrid 1 Breda Hybrid 2 Breda Hybrid 3 Breda Breda F1 F2 F3 F1 F2 F3 F1 F2 F3 F1 F2 F3
X1
X2
X3
X4
X5
X6
X7
X8
R2 %
72.7 74.9 69.8 66.4
*Variables so marked have loadings greater than 0.50 in more than one factor.
4. Conclusions
The discussed use of Factor analysis enabled the effective management of barley production, which otherwise was almost unpredictable due to a high number of contingency factors. The formative use of factor analysis developed in this study allowed for identification and evaluation of all influencing growth of barley factors in a form of the unified framework.
and Breda). The interrelationships between yield parameters (total plant yield, grain yield and straw yield) were stable in each hybrid and each area. The communalities for yield parameter were high (>0.85); while the interrelationship between morphological characters was stable in Tel Hadya, this is not in the case of Breda. More specifically, the relationship between yield parameters and morphological characters were stable in Tel Hadya; however, this relationship was not stable in Breda. Consequently, the relationship between parameters (yield parameters and morphological characters) was affected by genotype and environment. The discussed use of factor analysis would help decision-makers to determine and/or optimise the most effective parameters for cultivating barley in the pre-specified conditions.
The main research limitation of the study was that the relationship for each hybrid was not clear because the sample size for each hybrid was insufficient. The directions for future research include: a) supporting the study of the genotype-environment interaction with the use of Partial Least Squares analysis, and b) extending the locations and seasons to introduce a more indicative data set.
Acknowledgements
The author gratefully acknowledges the provision of a PhD grant from the University of Damascus, Syria. The author is also grateful for the fellowship grant provided by CARA (the Council for At-Risk Academics).
5. References
1. Amabile R. F., Faleiro F. G., Capettini F., Sayd R. M., Peixoto J. R. and Guercia R. F. (2014), “Characterization and genetic variability of barley accessions (Hordeum vulgare L.) irrigated in the savannas based on malting quality traits”, Journal of the Institute of Brewing, Vol. 120, No. 4, pp. 404–414. https://doi.org/10.1002/jib.179
2. Bertholdsson, N. (1999),"Characterization of malting barley cultivars with more or less stable grain protein content under varying environmental conditions", European Journal of Agronomy, Vol. 10, No. 1, pp. 1-8. https://doi.org/10.1016/S1161-0301(98)00043-4
3. Child, D. (1990), The essentials of factor analysis, London: Cassell Educational.
4. Denis, J. & Adams, M. (1978),"A Factor Analysis of Plant Variables Related to Yield in Dry Beans. I. Morphologic Traits", Crop Science, Vol. 18, No. 1, pp. 74-78. https://doi.org/10.2135/cropsci1978.0011183X001800010020x
5. Dillon, W. R. G., Dillon, M. W. R. and Goldstein, M. (1984), Multivariate analysis
methods and applications. New York: Wiley.
6. Fonge, B., Bechem, E. and Awo, E. (2016),"Fertilizer rate on growth, yield, and nutrient concentration of leafy vegetables", International Journal of Vegetable Science, Vol. 22, No. 1, pp. 274-288. https://doi.org/10.1080/19315260.2015.1005726
7. Hair, J., Anderson, R. E. and Tatham, R. L. (2005), Multivariate data analysis, Upper Saddle River: Prentice Hall International.
8. Härdle, W. and Hlávka, Z. (2007), Multivariate statistics, Berlin: Springer.
10.Johnson, R. A. and Wichern, D. W. (2006), "Multivariate Analysis", In: S. Kotz, C. B. Read, N. Balakrishnan, B. Vidakovic and N. L. Johnson (ed.): Encyclopedia of Statistical Sciences, https://doi.org/10.1002/0471667196.ess6094
11.Kline, P. (1984). An easy guide to factor analysis. New York: Routledge.
12.Kollo, T. and von Rosen, D. (2006), Advanced multivariate statistics with matrices, Netherland: Springer Science & Business Media.
13.Mallarino, A., Oyarzabal, E. and Hinz, P. (1999),"Interpreting within-field relationships between crop yields and soil and plant variables using factor analysis". Precision Agriculture, Vol. 1, No. 1, pp.15-25. https://doi.org/10.1023/A:1009940700478
14.Manly, B. F. and Alberto, J. A. N. (2016), Multivariate statistical methods: a primer, Boca Raton: CRC Press.
15.Mohammadi, M., Sharifi, P., Karimizadeh, R. and Shefazdeh, M.K., (2012), "Relationships between grain yield and yield components in bread wheat under different water availability (dryland and supplemental irrigation conditions)". Notulae Botanicae
Horti Agrobotanici Cluj-Napoca, Vol. 40, No 1, pp. 195-200.
http://dx.doi.org/10.15835/nbha4017350
16.Nasser, M. (2002), Applied Multivariate analysis and SPSS in Statistical Analysis. Syria: Damascus University.
17.Parvathaneni, R.K., Natesan, S., Devaraj, A.A. and Muthuraja, R. (2011), "Fingerprinting in cucumber and melon (Cucumis spp.) Genotypes using morphological and ISSR markers", Journal of Crop Science and Biotechnology, Vol. 14, No. 1, pp. 39–43. https://doi.org/10.1007/s12892-010-0080-1
18.Pett, M.A., Lackey, N.R. and Sullivan, J.J., (2003), Making sense of factor analysis: The use of factor analysis for instrument development in health care research. USA: Sage.
19.Smith, A., Cullis, B. and Thompson, R. (2001),"Analyzing variety by environment data using multiplicative mixed models and adjustments for spatial field trend", Biometrics, Vol. 57, No. 1, pp.1138-1147. https://doi.org/10.1111/j.0006-341X.2001.01138.x
20.Volis, S., Mendlinger, S. and Ward, D. (2002), "Differentiation along a gradient of environmental productivity and predictability in populations of Hordeum spontaneum Koch: multilevel selection analysis", Biological Journal of the Linnean Society, Vol. 75, No. 1, pp. 313-318. https://doi.org/10.1046/j.1095-8312.2002.00020.x
21.Walton, P. (1972),"Factor analysis of yield in spring wheat (Triticum aestivum L.)", Crop Science, Vol. 12, No. 1, pp.731-733.