TECHNICAL UNIVERSITY OF CLUJ-NAPOCA
ACTA TECHNICA NAPOCENSIS
Series: Applied Mathematics, Mechanics, and Engineering Vol. 63, Issue I, March, 2020
THE INFLUENCE OF THE GEOTHERMAL GRADIENT IN THE
GEOLOGICAL FORMATIONS
Costin Viorel VLĂȘCEANU, Marius STAN
AbstractThe paper presents some preliminary data concerning geothermal gradient distribution in the
Moesic Platform, using the temperature measurements done in oil exploration and production wells. Also, they are presented the main problems of geothermal conductivity of rocks measurements in the laboratory conditions. Knowing the geothermal gradient and thermal conductivity of rocks it is possible to estimate the heat flow, one of the main parameters for the thermal state of geological formation characterization.
1. AREA’S POSITIONING
The geometrical researches of the last years have taken on a great extent due to the multiple implications of knowing the influence and distribution of the temperature in rocks, as well as the thermal flux in both scientific and practical problems.
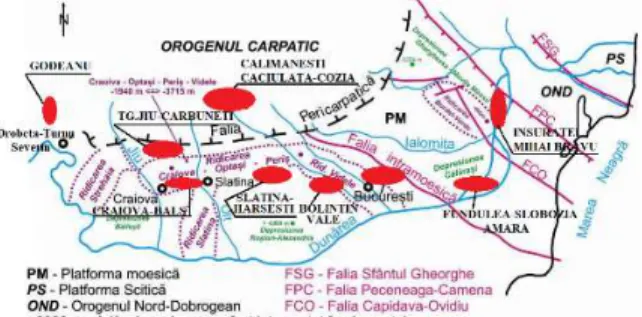
The research aims to present data on the distribution of the geothermal gradient in the Moesian Platform Figure 1 [1], based on the temperature measurements performed in the hydrocarbon exploration and exploitation wells and the main elements of thermal conductivity measurement of rocks under laboratory conditions. Given the fact that the geothermal gradient and the thermal conductivity of the rocks are known, can be determinated the geothermal flow, the main characterization of the thermal regime of the geological formations.
Figure 1 Geological map with geothermal potential
Moesian Platform (processed with the autocad program) Based on the production data from the Moesian Platform available, an overview was made regarding the geothermal potential of the platform. Such as the areas marked with red are possible future exploitation fields, from the geothermal point of view.
2. DEFINITION OF CONCEPTS
- Thermal conductivity (λ) is the property of the environment to transmit thermal energy. From a quantitative point of view, thermal conductivity expresses the amount of heat dQ that flows at a time dτ through a parallelipiped of cross section
S and length l, whose opposite sides are at temperatures t1 and respectively t2:
=
.° . ă (1) The inverse of thermal conductivity is called thermal resistivity:
= (2) The two sizes depend on the density, temperature and structure of the rock. Usually, the thermal conductivity increases with density, humidity and permeability of rocks.
= = ă (3)
where: δ – density of the environment. From equation (3) it follows that the thermal diffusion is a function that depends on the same factors as the thermal conductivity. This parameter is important when assessing the attainment of the stabilized thermal regime, after drilling a well for conducting temperature measurements under favorable conditions.
- Thermal flow is defined as a vector like that: ⃗ = − #$%& ( = − Δ( (4)
with components:
* = − +*+ ; ,= − +,+ ; - = − ++- (5)
- Geothermal flow represents the heat flow that propagates from the inside to the Earth’s surface. It is defined by the following relationship:
# = − ++- (6) - The Geothermal gradient represents the variation of temperature with depth:
. = - (7) The geothermal gradient is determined by the heat flow and thermal conductivity of the rocks: . = −/ (8) Assuming the constant thermal flux, the high thermal conductivities of the rocks determine small geotermal gradients, and the small thermal conductivities of the rocks determine large geothermal gradients. Generally speaking, the geothermal gradient is expressed by temperature variation (°C)/100 m:
. = 100
2 2 (9)
where: t2, t1 – represents the values of the
pemperature measured at the depths H2, H1;
- Geothermal step (the inverse of the geothermal gradient) and represents the distance in meters vertically (in depth) for which a temperature variation of 1 °C.
3 =2 2 (10)
3. RESULTS AND DISCUSSIONS
3.1. The geothermal gradient
The temperatures measurement of wells can have multiple uses: establishing the lithological
nature of the geological formations in the exploitation of useful mineral substances, evaluation of formations according to geophysical logs data, solving problems related to the use of heat resources.
The temperatures distribution is a consequence of thermal flux vertical convection and vertical and lateral diffusion. The relation according with this distribution may be computed is:
3 = 4∅6 + 1 − ∅ 68%9 (11)
where:
T – rock fluid system temperature;
Ø – porosity;
cf – fluid specific heat;
cma – mineral matrix specific heat.
Thus, the temperature variation model is linked with fluids and mineral matrix specific heat. Thermal flux from the inner layers will easy increase the temperature of the deeper formations because they have a smaller porosity and a smaller fluid content so they need a smaller energy consumption in order to achieve a greater temperature. Reaching more porous upper layers the necessary amount for energy to heat same of rock is higher so the temperature will decrease quicker in the shallower formations. That explains why on different depth intervals we may have different temperature variation models. Usually temperature gradient is calculated as a function of temperature variation with depth, but the real process is from depth to surface not from surface to dipper layers.
In the case of the formations evaluation and the calculation of the geothermal flow, the geothermal gradient is of particular importance. This is determined based on the maximum temperatures recorded in the wells during the investigation or testing of the formations.
It is estimated that the rest time required to restore the thermal balance is approximately three times the drilling time of the well (Bullard, 1947).
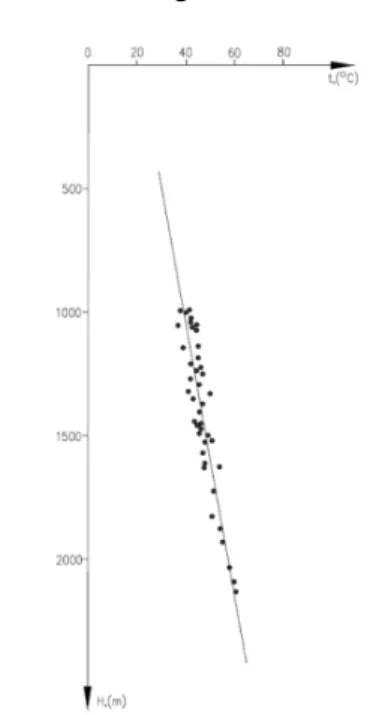
Figure 2 Temperature variation with depth (Diapire Hold Zone – Câmpina – Drăgăneasa)
In this research, the geothermal gradients were determined based on the temperature measurements performed I both stabilitez and unstabilized thermal regime. However, the average geothermal gradients determined under such conditions do not differ by more than 15 – 20 % from the values calculated based on the temperature data recorded under stabilized thermal regime.
Also the values of the average geothermal gradients, calculated for the main oil structures in the Moesic Platform, are graphically represented in Figure 3 and Figure 4. In the two graphs, the temperature corresponding to the depth of 2000 m considered as landmark, respectively the depths at which intercepts of isogeothermal well of 60 respectively 80 °C.
Figure 3 Depth variation at 60 °C depending
on the depth of 2000 m
Figure 4 Depth variation at 80 °C depending on the depth of 2000 m
According to the history of the drilled wells and exploited in our country, the geothermal gradient is 3 °C/100 m (0,03 °C/ m).
At the north of Pericarpatian Fault, the values of the geothermal gradient are between 2 and 3 °C/100 m. These are in agreement with the characteristic values of the depressed areas, with thick neohene deposits, predominantly terigenic with a lower thermal conductivity than that of the formations in the platform areas. Also, in the platform area there are two sectors with different thermal regime:
- the western sector (between Jiu Valley and Dâmbovița Valley) characterized by geothermal gradients and high temperature. In this sector we distinguish area with the largest geothermal gradients determined on the structures: Ciurești (3,73), Glavacioc (3,75), Cartojani (4,8), Videle (4,6), Hârlești (3,42 °C/100 m);
- the east sector (east of Dâmbovița Valley), characterized by geothermal gradients and low temperatures: Periș (1,05), Tinosu (1,23), Urziceni (1,28 °C/100).
Generally, on the platforms the geothermal gradients increase with the increase in profile of sandy – clay rocks and decrease under the conditions of the predominance of the carbonate formations and the hydrochemical deposits.
fracture line that marks the boundary between the two sectors of the platform).
Figure 5 Simulation of 60 and 80 °C isogeotherms, the variation of the geothermal gradient and the temperature
at the depth of 2000 m (Craiova – Ghergheasa Zone)
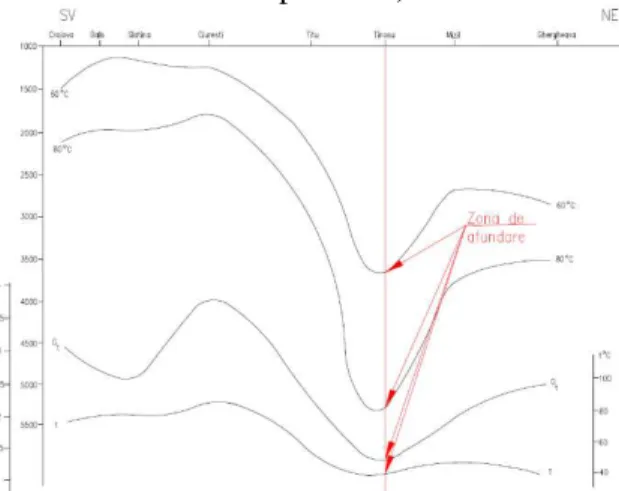
Based on the available data, a new NE – SV profile was simulated, between Câmpina and Videle, Figure 6 which shows the sinking of the 60 and 80 °C towards depression, an image that suggests a parallel of the evolution of the crystalline basement.
It can be concluded that there are a number of factors that condition the geothermal gradient at depth: the lithological nature of the formations, tectonic factors, hydrogeological regime, local thermal fields.
Figure 6 Simulation of 60 and 80 °C isogeotherms, geothermal gradient variation on a NE – SV profile
(Câmpina – Videle Zone)
3.2. The thermal conductivity of the rocks In general, the thermal conductivity of rocks is determined by relative methods under stabilized regime. One of the first methods of
determining the conductivity is Divided bar method described by Birch (1950). The method principle is represented by a divided bar consisting of two quartz used as reference material with known conductivity, the rock and a series of copper discs Figure 7.
Figure 7 – Determination of the thermal conductivity (Divided bar method)
The ends of the bar are kept at constant temperature t și t’ controlled by thermostatic baths at a difference temperature of 10 – 15 °C. After sufficient time to reach the thermal equilibrium, assuming that the heat flux is axial and there is no radial loss, the heat fluxes through the quartz disks and the rock may exist: :;= : ; :;= :< (12) :; = =; > (13) Given equation (1), equation (14) gets:
?@ A;= B CD
E F = BCD>E>F>
; (15)
where:
λr – thermal conductivity of rock with cross
section S2 and thickness Z2;
λq – thermal conductivity of quartz disks
with cross sections S1 and S1 and thickness Z1
and Z3;
It is simple to make quartz disks, so that:
S1 = S3 = S și Z1 = Z3 = Z (16)
As standard or reference disks, can be used crystalline quartz or molten quartz.
/ =GH,J=H,;K; (17)
Also, the variation of the thermal conductivity of the crystalline quartz for the temperature range 0 – 100 °C is shown in Figure 8.
Figure 8 – Variation of the thermal conductivity of the crystalline quartz (range 0 – 100 °C)
Given the fact that melted quartz disks are easier and cheaper to make, they can be used as standard, so using crystalline quartz. The obtained values have an error margin of about 2 % .
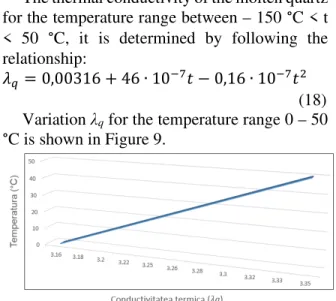
The thermal conductivity of the molten quartz for the temperature range between – 150 °C < t < 50 °C, it is determined by following the relationship:
/ = 0,00316 + 46 ∙ 10 J( − 0,16 ∙ 10 J(; (18)
Variation λq for the temperature range 0 – 50
°C is shown in Figure 9.
Figure 9 – Variation of the thermal conductivity of the molten quartz (range 0 – 50 °C)
An important problem is the reduction of the thermal resistance to the contact between the quartz disks. This is achieved by applying a layer of petroleum jelly on the sides of the disks and exerting an axial pressure of 50 – 100 atm on the ends of the split bar.
4. CONCLUSIONS AND PROPOSALS
Studying the existing (fields and literature) materials we may depict the next facts and
proposals:
- The general geological frame (Moesian Platform) provides an optimistic sceniario for the existence of thermal energy in research area. - These area were evaluated by electrical (SEV) surveys and field mapping.
- Also, an efficient geophysical survey method for deep located water saturated reservoirs is magneto telluric survey which for a proper definition may realized with a density about 3 point on square kilometer.
- For a better approach may by achieved well logs in the existing wells. A relative cheap, efficient and rapid method consists of Radioactive well logging (Gama Ray and Neutronic curves) which may emphasize the existence or different layers (lithology) and also may evaluate rocks porosity.
-Between the existing wells may be accomplished an interference study which can show the existence of a communication between them an improve the existing geological and hydrodynamic models.
- In order to estimate the resources will be important to have porosity data (from cores and / or well logs). Reservoir thickness also may be evaluated from mentioned well logs. Areal dimension of the field are more difficult to be established, mainly from geophysical surface survey.
- Also may be tacken into account the possibility that drilling deep wells, which will cross the Moesian Platform wells, the pelitic (clay) intervals may provide efficient seals which will block the heat flow mechanisms and thus the, recorded temperature will be much higher corresponding to thermal flow rate and regional temperature gradient.
The most important applications regarding the knowledge of temperature distribution, geothermal gradients and geothermal flow are: -studying the dynamic processes in the deposits with geothermal potential as well as the characterization of the mantle – crustal unconformuty;
-the ability to explain the eartquakes on account of temperature inhomogeneities (especially those related to volcanic activity);
by determining the thermal regime of the geological formations;
- the design and construction of modern geophysical equipment for the deep research and the correct interpretation of geophysical well diagram;
- proper design of the drilling and exploitation of the wells involved:
-establishing the necessary characteristics of the drilling fluid and cement used;
- identifying the most suitable procedures for opening the layers under high temperature conditions and using the energy under established technical economic conditions;
- proper selection of drilling fluids for different special operations (hydraulic cracking, acidification);
- the use of the exploitation of the wells by thermal methods, which implies the knowledge of the thermal properties of the rocks (thermal conductivity);
- applying the suitable methods for combating corrosion;
- identification in the profile of the investigated wells of the different usefull mineral substances (gases, hydrochemical deposits, coals, sulphides, aquifer horizons) based on the local thermal filds produced by these substances; - studies of regional geology and tectonics, which can help identify anticline basins, salt domes and protusions buried by carbonate rocks (metamorphic and magmatic) with high thermal conductivity;
- research of the hydrodynamic characteristics of the oil and gas fileds;
- study of the technical condition of the wells: specifying the places of influx and circulation of
water behind the columns, the control of the primary cementation of the columns. Can be made in wells acoustic cementation logs:
- Sectorial Bond Tool (SBT); - Cement Bond Log(CBL).
- for measuring flow, temperature and density, they can be executed in wells PLT (Production Loc Tool).
REFERENCES
[1]. Juravle D. – Geologia României
(Morfologia paleozoică a soclului Platformei Moesice), Editura Universității Alexandru Ioan – Cuza din Iași, 2015. [2]. Cristian M., Dogaru L., Mocuța Șt. – Cu
privire la variația temperaturii rocilor din principalele provincii petro – gazeifere din Româmia, Petrol și Gaze, XX, București.
[3]. Popescu M., Pătruț M., Paraschiv D. –
Studiul actual de cunoaștere geologică a Platformei Moesice pe teritoriul României, Petrol și Gaze, XVIII, București.
[4]. Paraschiv D. – Platforma Moesică și zăcămintele ei de hidrocarburi, București, 1982.
[5]. Batistatu M.V. – Geologia Zăcămintelor de Hidrocarburi, suport de curs, Universitatea Petrol – Gaze Ploiești, 2017.
[6]. Vlășceanu V. – Same aspects regarding
hydrocarbon storage conditions on the Urziceni structure (Moesian Platform),Society Petroleum Engineer Conference, October 22, 2015.
Influența gradientului geotermic în formațiunile geologice
Rezumat În această lucrare sunt prezentate câteva date preliminare cu privire la distribuția gradientului geotermic din
Platforma Moesică, utilizând măsurătorile de temperatură efectuate în exploatarea sondelor de țiței. De asemenea, sunt
prezentate principalele problemele ale conductivității geotermale, a măsurătorilor rocilor în condiții la laborator.
Cunoscând gradientul geotermic și conductivitatea termică a rocilor, este posibilă estimarea fluxului de temperatură,
unul dintre principalii parametrii utilizați la caracterizarea formațiunilor geologice.
VLĂȘCEANU Constin Viorel, Lecturer PhD. Eng. Petroleum and Gas University of Ploiești Oil and Gas Engineering Faculty, Department of Petroleum Geology and Reservoir Engineering, Email: [email protected], + 40 - 244.573 171,