Changes in Nutrition Environment Predict Changes in Child Diet Quality in Family Child Care Homes
by Mikayla Bowen
Honors Essay Department of Nutrition University of North Carolina
2019
Approved:
______________________________ Advisor
i
ABSTRACT
Family child care homes (FCCHs) are the second most common form of non-parental child care, yet tend to have limited nutrition regulations and high rates of overweight and
ii
ACKNOWLEDGEMENTS
iii
TABLE OF CONTENTS
ABSTRACT……….i
CHAPTERS 1. Introduction………..1
2. Methods………4
3. Results………13
4. Discussion………..21
1
CHAPTER ONE
INTRODUCTION
Establishing healthy nutrition habits is important for the maintenance of healthy weight in young children. As the prevalence of childhood overweight and obesity have been rising in recent decades,1 our increased knowledge of the adverse consequences associated with this health condition has underscored the importance of prevention.2 The consequences of childhood obesity are profound, including adverse effects on children’s physical health, social and
emotional wellbeing, and academic performance.3,4 Other chronic health conditions that are
associated with childhood obesity include disorders of the metabolic, cardiovascular, orthopedic, and neurological systems.3 Furthermore, obesity in childhood is predictive of obesity in
adulthood, and a greater risk for type 2 diabetes, hypertension, and several cancers.5–7
Early childhood has been identified as a critical period to establish nutrition habits that promote lifelong health in children.8 During this important developmental stage, many U.S. children are enrolled in child care programs. It is estimated that over half of children (60%) under the age of six who are not yet in kindergarten are enrolled in some form of non-parental care program for an average of 30 hours per week.9. The family child care home (FCCH) is the second most common type of non-relative child care program in the U.S.9 Family child care homes are typically operated by an individual, the provider, who is most often female and cares for children of multiple ages simultaneously out of her/his own home.10 Importantly, FCCHs tend to serve predominantly children from lower-income families who are at a greater risk for overweight and obesity.10,11 The FCCH environment, including the quality of foods and
2
According to CACFP standards, meals and snacks served should include a variety of vegetables and fruit, more whole grains, and less added sugar and saturated fat.13 Standard
recommendations also include that providers engage in practices that support healthful
behaviors, and have written policies supporting quality nutrition in the FCCH.14 Such aspects of the nutrition environment are important, however, the few studies that have examined the nutrition environments and foods provided at FCCHs have found the need for major
improvements.15–20 Specifically, low-fat milk, whole grains, and low-fat meat tend to be served
infrequently, while 100% fruit juice tends to be served often.16,20 Additionally, unhealthy foods are commonly used for celebrations.20 FCCHs also tend to have poor feeding environment, foods provided, and feeding practices.17,18 Further, few FCCHs have written policies regarding
nutrition and regular nutrition education for providers.16–20
Benjamin-Neelon and colleagues conducted an observational study in 166 FCCHs in North Carolina at the baseline of the Keys to Family Child Care Homes intervention. The current study also uses data from the Keys intervention, but including post-intervention data as well. The study by Benjamin-Neelon found that the provision of higher-quality foods and beverages, presence of nutrition policies, and the seeking of professional development around nutrition by providers were associated with improved quality in children’s dietary intakes.12 Despite these
3
This study uses data from Keys to Healthy Family Child Care Homes, a randomized controlled trial to promote healthy dietary intakes and physical activity behaviors in preschool-aged children while in FCCHs.22 Results from the Keys study showed that between baseline and post-intervention, there were significant improvements in the overall nutrition environment of FCCHs in the intervention arm.23 Given this context, the purpose of the current study is to explore the Keys study data to understand how the improvements in the overall nutrition
environment of FCCHs in the intervention arm could potentially impact the diet quality of foods and beverages consumed by preschool-aged children at the FCCHs. In addition, the study explores the impact of changes in sub-components of the overall nutrition environment (e.g., foods provided, beverages provided, feeding environment) on the diet quality of foods/beverages consumed by preschool-aged children.
Specific Aims
Aim 1: Using data from the intervention arm of the Keys study, determine whether changes in the overall nutrition environment between baseline and
post-intervention are associated with changes in the diet quality of foods and beverages consumed by preschool-aged children. Hypothesis: Positive improvements from baseline to post-intervention observed in the diet quality of foods and beverages
consumed by children at FCCHs will be positively associated with changes in
their overall nutrition environment scores.
4
CHAPTER TWO
METHODS
Study Design
This study uses data from Keys to Healthy Family Child Care Homes (Keys).22 Keys was a nine-month cluster-randomized controlled trial that was conducted between 2013 and 2016 in North Carolina. The intervention was three-fold, to improve: FCCH providers’ dietary and physical activity behaviors; the FCCH nutrition and physical activity environment; and providers’ business practices.22,24 All procedures used in the Keys study were approved by
Institutional Review Boards at the University of North Carolina at Chapel Hill and the Duke University Medical Center and the study is registered at ClinicalTrials.gov (NCT01814215).
Participant Recruitment
5
obtained from providers and parents of children enrolled at the FCCHs during home visits by the study staff. In all, 166 FCCHs/providers and 496 preschool-aged children participated in the Keys Study.24
Randomization and Delivery of the Keys Intervention
After baseline measures were taken, family child care homes were stratified based on provider weight (normal, overweight, or obese) to ensure that weight status was equally
distributed between the study arms. FCCHs were then randomly assigned to the intervention arm or an attention control arm using a computerized block randomization approach (SAS 9.3 Cary, NC). Providers in the intervention arm received three modules: Healthy You; Healthy Home; and Healthy Business. The Healthy You module provided strategies to support healthier lifestyles with FCCH providers including promoting healthy dietary intakes, physical activity behaviors, to allow for positive role modeling behaviors. The Healthy Home module helped providers to create home environments that support healthful dietary intakes and physical activity behaviors in the children in their care. The Healthy Business module focused on promoting sustainable practices to support a thriving FCCH business. Each module was delivered over a three-month period (9-months total) via a training workshop, home visit, and three follow-up telephone calls or emails from a health coach22,28 that was trained in motivational interviewing and adult learning principles.29,30
6
however, the control arm did not receive a home visit, and instead received another telephone call from coaches for support.22
Providers in the intervention and control arm received $75 for completing baseline measures. At post-intervention, they received $125 and Continuing Education Units (CEU) for completing the follow-up measurements.22 At the end of the study, all participants received educational toolkits with items that were useful for the FCCH including pedometers and books.22
Data Collection
Measures were collected from all providers at baseline and post-intervention during two-day visits to each FCCH by trained data collectors who were blinded to the FCCHs arm
assignment. Data collectors arrived at the FCCH before the first meal of the day and departed from the FCCH after all children had left the FCCHs at the end of the day (~6PM). Several components of the FCCH were assessed during each visit including: i) provisions, practices, policies around nutrition and physical activity at the FCCH to describe the general environment, using the Environment and Policy Assessment and Observation (EPAO) tool;31 ii) the types and amounts foods and beverages served and consumed by preschool-aged children, using the Dietary Observation in Child Care (DOCC) protocol;32 iii) weight status of providers and
7
Assessment of the Overall Quality of FCCHs Nutrition Environments
Provision, practices, and policies around nutrition and physical activity were assessed using a modified version of the Environment and Policy Assessment and Observation (EPAO), to describe the overall quality of the FCCH environment.31 The modified EPAO for FCCHs contains 145-items and has been shown to be a reliable and valid tool to assess the quality of FCCH nutrition and physical activity environments.31
To complete the EPAO, data collectors were trained and certified (4 hours each) against a “gold standard observer” approved by the research team.12 The data collectors conducted
observations across two full days at each FCCH. The observations began before the first meal of the day and continued until the children left for the day.12 On the modified EPAO, data collectors recorded details about foods and beverages provided (e.g., food groups represented, quality of food preparation, availability of water, type of milk consumed, and consumption of
sugar-sweetened beverages) at breakfast, lunch, and the afternoon snack. Further, observation included provider practices around nutrition and characteristics of the general nutrition environment (e.g., role modeling practices, surrounding materials depicting healthy or unhealthy eating behaviors, meal serving styles, and mealtime interactions between provider and children). In addition, the data collectors conducted a review of policy documents to verify the presence of nutrition and physical activity policies at the FCCHs.
8
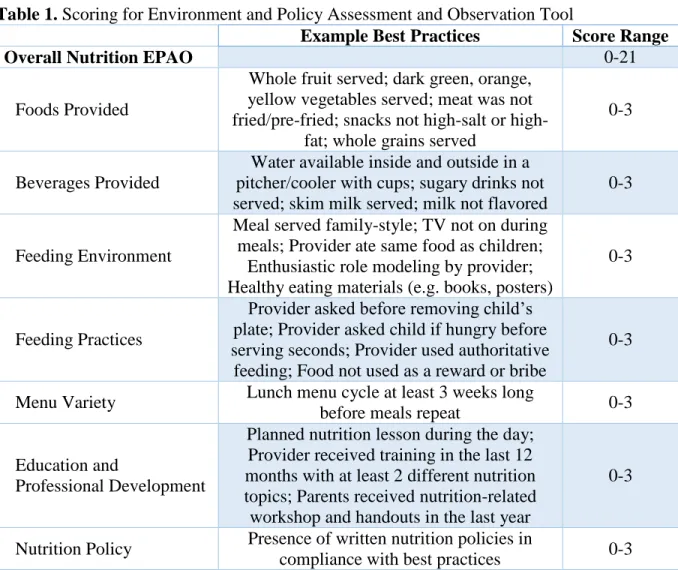
averaged into 7 sub-components, including foods provided, beverages provided, feeding environment, feeding practices, menu variety, education and professional development, and nutrition policy. These sub-components were then summed to determine the overall nutrition score, with potential scores ranging from 0-21, where higher scores indicated higher quality nutrition environments. This overall nutrition score is based on seven nutrition sub-components, each ranging from 0-3. EPAO scoring breakdown is included in Table 1.
Table 1. Scoring for Environment and Policy Assessment and Observation Tool
Example Best Practices Score Range
Overall Nutrition EPAO 0-21
Foods Provided
Whole fruit served; dark green, orange, yellow vegetables served; meat was not fried/pre-fried; snacks not salt or
high-fat; whole grains served
0-3
Beverages Provided
Water available inside and outside in a pitcher/cooler with cups; sugary drinks not served; skim milk served; milk not flavored
0-3
Feeding Environment
Meal served family-style; TV not on during meals; Provider ate same food as children;
Enthusiastic role modeling by provider; Healthy eating materials (e.g. books, posters)
0-3
Feeding Practices
Provider asked before removing child’s plate; Provider asked child if hungry before serving seconds; Provider used authoritative feeding; Food not used as a reward or bribe
0-3
Menu Variety Lunch menu cycle at least 3 weeks long
before meals repeat 0-3
Education and
Professional Development
Planned nutrition lesson during the day; Provider received training in the last 12 months with at least 2 different nutrition topics; Parents received nutrition-related workshop and handouts in the last year
0-3
Nutrition Policy Presence of written nutrition policies in
9
Assessment of Children’s Dietary Intakes
Foods and beverages consumed by children were observed and recorded on the Diet Observation in Child Care (DOCC) protocol.32 Using this tool, data collectors observed all meals and snacks provided to children, and captured food served, wasted, exchanged, and left over at the end of each meal and snack for each child enrolled in the study. For this study, the DOCC protocol was modified so that data collectors could differentiate between food brought from home versus foods served at the FCCH.22 If a child is absent for the day, and at least one meal
and snack are not observed, data collectors returned for another visit to observe and collect dietary intake data on that child.12 If a child was no longer in the home at follow-up, data for that child was excluded. The DOCC protocol requires that a data collector observe up to 3 children;32 thus, one data collector was sufficient for most FCCHs. In situations where there were more than 3 children enrolled in the study at a FCCH, the study had two data collectors conduct the dietary observations.12 Food and beverage records from the data collected were entered into the
Nutrition Data System for Research (NDSR, University of Minnesota, 2016) to estimate the total calories and amounts of food groups and nutrients consumed by children daily. These output from NDSR were used to calculate a Healthy Eating Index (HEI) score using the HEI-2010 algorithm.33
The Healthy Eating Index-2010 assesses the diet quality of foods and beverages
consumed in terms of compliance with the 2010 Dietary Guidelines for Americans.34 The HEI-2010 is scored on a range of 0 to 100, with higher scores indicating greater compliance with the nutrition guidelines.33 The HEI-2010 is comprised of 12 sub-components, nine of which
10
plant proteins and fatty acids),. Three HEI-2010 sub-components represent food categories that should be consumed in moderation (i.e., refined grains, sodium, and empty calories).33 The
HEI-2010 sub-components and scoring are shown in in Table 2.
Table 2. Scoring Criteria for the Healthy Eating Index-2010 Healthy Eating
Index-2010 Sub-Components Maximum Attainable Score Criteria for Attaining the Maximum Sub-component score
Criteria for Meeting the Minimum
Sub-Component Score
Adequacy Components
Total Fruit 5 ≥ 0.8 cup equivalent
per 1000 kcal No fruit
Whole Fruit 5 ≥ 0.4 cup equivalent
per 1000 kcal No whole fruit
Total Vegetables 5
≥ 1.1 cup equivalents per
1000 kcal
No vegetables
Greens and Beans 5 ≥ 0.2 cup equivalent
per 1000 kcal
No dark green vegetables or beans
and peas
Whole Grains 10 ≥ 1.5 oz equivalents
per 1000 kcal No whole grains
Dairy 10
≥ 1.3 cup equivalents per
1000 kcal
No dairy Total Protein in
Foods 5
≥ 2.5 oz equivalents
per 1000 kcal No protein foods Seafood and Plant
Proteins 5
≥ 0.8 oz equivalent per 1000 kcal
No seafood or plant proteins
Fatty Acids 10 (PUFAs + MUFAs)
/ SFAs > 2.5
(PUFAs + MUFAS) / SFAs ≤ 1.2
Moderation Components
Refined Grains 10 ≤ 1.8 oz equivalents
per 1000 kcal
≥ 4.3 oz equivalents per 1000 kcal
Sodium 10 ≤ 1.1 g per 1000
kcal
≥ 2.0 g per 1000 kcal
Empty Calories 20 ≤ 19% of energy ≥ 50% of energy
Total Healthy Eating
11
Assessment of Children’s Anthropometrics and FCCHs Demographic Characteristics
Child anthropometrics including body mass index were collected at the observation days at baseline and follow up. Children’s height and weight were measured in the standing position for children who were able, and recumbently for 6 children who were not able to stand. Height was measured to the nearest 1/8 inch and weight was measured to the nearest 0.1 pound. Height and weight were used to calculate body mass index (kg/m2). Child demographics were collected via a survey completed by parents of participating children and included information such as the child’s birthdate, sex, and race. FCCH demographics were collected using a survey completed by the provider including information such as provider sex, age, race, education, FCCH quality rating, and CACFP enrollment.22
Data Analysis
12
Aim 2 analysis was conducted very similarly to that of aim 1, except instead of overall nutrition EPAO being used as the predictor variable, 5 individual linear regression models clustered by FCCH were created using each EPAO sub-component change score.
Subcomponents for menu variety and nutrition policy were not included in analysis because these change scores were 0. Each of the 5 models were tested against the null model without that predictor using an ANOVA test.
Analyses for aims 1 and 2 were repeated controlling for baseline child HEI score in addition to child age, sex, BMI, and FCCH star rating. For the predictors found to be significant in the intervention group, the component was broken down another level into its
13
CHAPTER THREE
RESULTS
Table 3 describes the demographic characteristics of participating FCCHs, providers, and children enrolled in this study. A total of 496 children from 166 FCCHs participated, of which 83 FCCHs were randomly assigned to the intervention arm, and another 83 FCCHs were in the attention-control arm. The majority of FCCHs had a star rating between 3 to 5 stars (92%) that is defined by staff education and program standards, and that rates each FCCH on a scale from 1-5, with 5 being the highest star rating.35 The majority of FCCHs also participated in the Child and Adult Care Food Program (91%), the federally-regulated feeding program for child care
14
Table 3. Baseline Characteristics of Participating Children, Providers, and Family Child Care Homes
Total Sample
Children n=496
Age (months, mean (SD)) 35.7 (11.4)
Female 250 (50%)
Race/ethnicity
Black or African American White
Other
314 (63%) 135 (27%) 47 (10%)
Hispanic or Latino 20 (4%)
Days per week in child care (mean (SD)) 4.9 (0.7)
FCCH Providers n=166
Age (years, mean (SD)) 49 (9)
Race/ethnicity
Black or African American White
Other
123 (74%) 30 (18%)
13 (8%)
Hispanic or Latino 8 (5%)
Education
High school diploma or GED
Associate’s degree or 60 hrs college credit Bachelor’s degree or greater
41 (25%) 82 (49%) 42 (25%)
FCCH Programs n=166
Star Rating1 1 or 2 stars 3 stars 4 stars 5 stars 13 (8%) 40 (24%) 68 (41%) 45 (27%)
Accepts CACFP2 Subsidy 151 (91%)
1Star Rating is a North Carolina program that assesses the quality of the child care program. Ratings can range
between 1 and 5 stars, with more stars equating to higher quality care.
2CACFP refers to the Child and Adult Care Food Program, a federally funded program that reimburses participating
child care programs for providing eligible meals and snacks served to low-income and other children in their care. FCCH, Family Child Care Home; GED, General Education Development; CACFP, Child and Adult Food Program
15
relatively stable, changing from 9.09 ± 1.83 to 9.06 ± 1.73. The difference in mean change scores was significant between arms (p=0.040). This lead to the development of aim 1 to examine the impact of nutrition environment improvement on child diet quality. Detailed breakdown of the EPAO sub-components is included in Table 4.
Table 4. Baseline and Follow-up EPAO Scores for Intervention and Control Arms
Intervention Arm Control Arm
Baseline Mean (SD)1
Post-intervention Mean (SD)1
Baseline Mean (SD)1
Post-intervention Mean (SD)1
Overall Nutrition environment score
9.30 (1.70) 9.42 (1.77) 9.09 (1.83) 9.06 (1.73)
Foods
Provided 2.15 (0.27) 2.13 (0.28) 2.05 (0.26) 2.05 (0.27) Beverages
Provided 2.01 (0.28) 2.10 (0.26) 1.95 (0.31) 1.95 (0.27) Feeding
Environment 1.45 (0.20) 1.49 (0.23) 1.36 (0.22) 1.37 (0.20) Feeding
Practices 1.43 (0.26) 1.37 (0.26) 1.43 (0.28) 1.33 (0.27) Menu Variety 0.64 (1.20) 0.65 (1.21) 0.79 (1.30) 0.82 (1.32) Education and
Professional Development
0.68 (0.35) 0.75 (0.32) 0.69 (0.33) 0.67 (0.32)
Nutrition
Policy 0.94 (0.70) 0.94 (0.72) 0.86 (0.59) 0.89 (0.58)
1Bolded values were significant between arms (p-value < 0.05)
sub-16
component scores. In the intervention group, total HEI improved from 61.10 to 64.35. In the control group, total HEI decreased slightly from 60.96 to 59.85. The difference in mean change scores was significant in intervention group compared to control group. Improvement in the intervention group was significant compared to change in the control group (p<0.001).
Table 5. Comparison by Baseline and Control Arms for Healthy Eating Index
Intervention Arm Control Arm
Baseline Mean (SD)1
Post-intervention Mean (SD)1
Baseline Mean (SD)1
Post-intervention
Mean (SD)1
Total HEI-2010 score
61.10 (11.16) 64.35 (11.95) 60.96 (11.86) 59.85 (11.64)
Adequacy Components of HEI-2010
Total Fruit 4.46 (1.18) 4.38 (1.17) 4.47 (1.03) 4.30 (1.19) Whole Fruit 4.59 (1.16) 4.71 (0.97) 4.69 (0.96) 4.60 (1.08) Total
Vegetables 2.01 (1.40) 1.84 (1.24) 1.89 (1.22) 2.08 (1.36) Greens and
Beans 1.24 (1.93) 1.14 (1.88) 0.98 (1.78) 1.16 (1.87) Whole Grains 3.65 (3.34) 4.89 (3.82) 3.58 (3.41) 3.57 (3.50)
Dairy 8.94 (2.13) 9.05 (2.08) 9.34 (1.84) 9.33 (1.86) Total Protein
in Foods 3.61 (1.54) 3.41 (1.77) 3.60 (1.58) 3.31 (1.74) Seafood and
Plant Proteins 1.57 (2.19) 1.79 (2.25) 1.72 (2.24) 1.57 (2.21) Fatty Acids 4.70 (3.45) 4.56 (3.63) 4.47 (3.42) 4.30 (3.51)
Moderation Components of HEI-2010
Refined Grains 5.24 (3.70) 6.20 (3.50) 5.47 (3.40) 4.43 (3.27)
Sodium 4.58 (3.21) 5.05 (3.21) 5.35 (2.85) 4.43 (3.15)
Empty Calories 16.7 (4.20) 17.34 (3.66) 16.40 (4.26) 16.78 (3.94)
1Bolded values were significant between arms (p-value < 0.05)
17
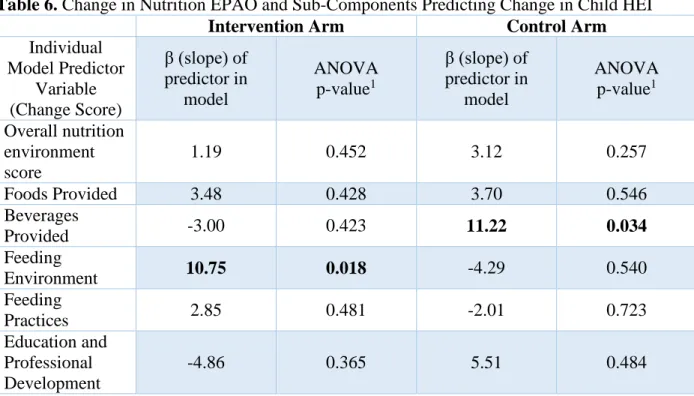
the test signifies whether this prediction is actually significant. The statistical models created were linear mixed-effects models clustered by FCCH, separated among intervention and control groups, were created, controlling for child age, sex, BMI, and FCCH star rating. Menu variety and nutrition policy components were excluded because there was no change in these sub-components for any of the FCCHs. These models were compared against the null model without the EPAO score predictor variable to determine if the EPAO score or sub-component was significantly predictive of the HEI change. There were positive improvements in the overall nutrition environment following the intervention, but this was not associated with improvements in the overall diet quality of foods and beverages consumed by children as measured using the HEI-2010. However, when sub-components of the overall nutrition environment were analyzed, it was found that improvements in the feeding environment of FCCHs was positively associated with the changes in overall diet quality of foods and beverages consumed by children. That is, for each one-point improvement in feeding environment, we observed a 10.75-point
improvement in diet quality (p=0.018) in the intervention group. Among the control group, each one-point improvement in the beverages provided was associated with a 11.22-point
18
Table 6. Change in Nutrition EPAO and Sub-Components Predicting Change in Child HEI
Intervention Arm Control Arm
Individual Model Predictor
Variable (Change Score)
β (slope) of predictor in
model
ANOVA p-value1
β (slope) of predictor in
model
ANOVA p-value1 Overall nutrition
environment score
1.19 0.452 3.12 0.257
Foods Provided 3.48 0.428 3.70 0.546
Beverages
Provided -3.00 0.423 11.22 0.034
Feeding
Environment 10.75 0.018 -4.29 0.540
Feeding
Practices 2.85 0.481 -2.01 0.723
Education and Professional Development
-4.86 0.365 5.51 0.484
1Bolded values were significant (p-value < 0.05)
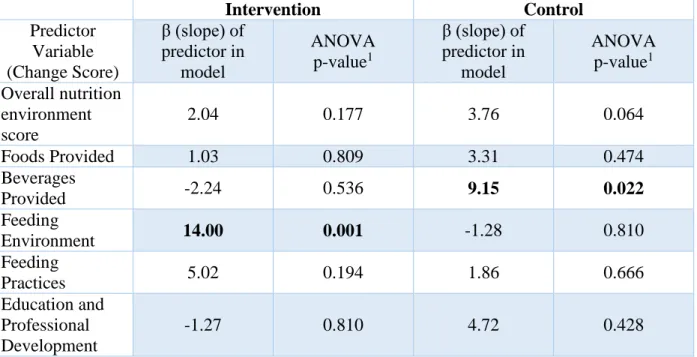
In the same set-up as Table 6, Table 7 describes similar data calculated using the same method of comparison of each model against a null without the predictor, except with one important distinction. Each individual model created using each predictor also controls for baseline child HEI score. Therefore, each individual model in this second set indicates whether these relationships hold even when accounting for variability in baseline HEI. Among the
intervention group, change in feeding environment was significantly predictive of change in HEI score (p=0.001). For the control group, change in beverages provided was significantly
19
Table 7. Change in Nutrition EPAO and Sub-Components Predicting Change in Child HEI Controlling for Baseline HEI
Intervention Control
Predictor Variable (Change Score)
β (slope) of predictor in
model
ANOVA p-value1
β (slope) of predictor in
model
ANOVA p-value1 Overall nutrition
environment score
2.04 0.177 3.76 0.064
Foods Provided 1.03 0.809 3.31 0.474
Beverages
Provided -2.24 0.536 9.15 0.022
Feeding
Environment 14.00 0.001 -1.28 0.810
Feeding
Practices 5.02 0.194 1.86 0.666
Education and Professional Development
-1.27 0.810 4.72 0.428
1Bolded values were significant (p-value < 0.05)
To further investigate aspects of the feeding environment of FCCHs in the intervention arm that could be driving its significant impact on changes in the diet quality of foods and beverages consumed by children, the change scores within feeding environment in the
20
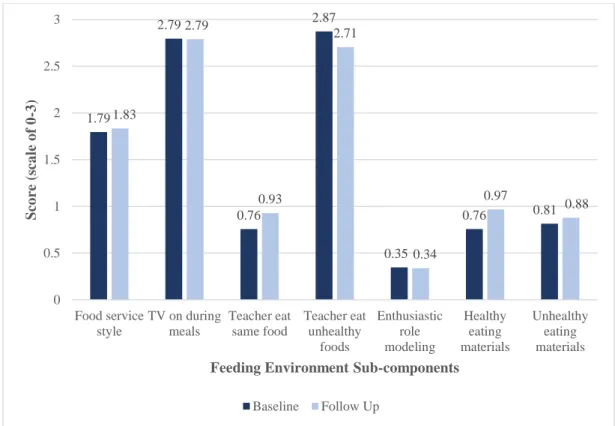
Figure 1. Comparison of Baseline and Post-Intervention Scores of Feeding Environment Sub-Components in the Intervention Arm
Table 8. Comparison of Baseline and Post-Intervention Scores of Feeding Environment Sub-Components in Intervention Arm
Baseline Mean (SD) Post-intervention Mean (SD) Difference in mean change (95% CI) P-value from paired t-test1
Food service
style 1.79 (0.37) 1.83 (0.38)
0.04 (-0.06,
0.14) 0.457
TV on during
meals 2.79 (0.41) 2.79 (0.51)
-0.01 (-0.13,
0.12) 0.917
Teacher eating same foods as
children
0.76 (0.74) 0.93 (0.76) 0.17 (-0.02,
0.36) 0.075
Teacher eating
unhealthy foods 2.87 (0.41) 2.71 (0.58)
0.17 (0.30,
-0.03) 0.015
Enthusiastic role
modeling 0.35 (0.50) 0.34 (0.50)
-0.01 (-0.13,
0.12) 0.921
Healthy eating
materials 0.76 (0.57) 0.97 (0.58) 0.21 (0.03, 0.40) 0.025 Unhealthy eating
materials 0.81 (0.57) 0.88 (0.65)
0.06 (-0.129,
0.26) 0.511
1Bolded values were significant (p-value < 0.05)
1.79 2.79 0.76 2.87 0.35 0.76 0.81 1.83 2.79 0.93 2.71 0.34 0.97 0.88 0 0.5 1 1.5 2 2.5 3 Food service style
TV on during meals Teacher eat same food Teacher eat unhealthy foods Enthusiastic role modeling Healthy eating materials Unhealthy eating materials Sco re ( sca le o f 0 -3)
Feeding Environment Sub-components
21
CHAPTER FOUR
DISCUSSION
The purpose of the study was to determine whether changes in the overall nutrition environment or its sub-components in FCCHs could predict changes in child diet quality. Contrary to the hypothesis, change in overall nutrition environment score does not predict changes in feeding environment. However, when sub-components of the overall nutrition environment were examined, the feeding environment sub-components score was found to potentially be driving the changes observed in child diet quality in the intervention arm.
Specifically, within the feeding environment subcomponents, providers in the intervention arm had more healthy eating materials (e.g. books, posters) in their FCCH, and surprisingly ate more unhealthy foods during meals. There was also a trend towards providers eating the same foods as children more often. This indicates that the feeding environment, in particular, the provision of healthy eating materials, may be potential areas to target in future interventions.
22
This finding that feeding environment effectively improved child diet quality will be useful going forward when designing cost-effective interventions to improve child diet quality. Cost of providing healthier foods has been found to be a significant barrier to improving
nutritional adequacy of menus in child care centers and FCCHs.36,37 Therefore, identifying ways to limit costs is imperative for improving nutrition in child care.
Aspects of the feeding environment were further examined to see what could be driving improvements in diet quality within the intervention arm. In the intervention group, the presence of healthy eating materials improved significantly. This sub-component includes materials such as books, posters, and pictures which depict healthy eating behaviors. In addition, there was a increase in providers eating the same food as children which approached significance, a helpful opportunity for role modeling.12 These two areas may be important targets for interventions; however, this latter finding is only a trend overall among the intervention group. Further investigation using statistical models is needed to determine if increasing healthy eating materials actually predicts improvement in diet quality.
It was surprising that providers in the intervention group ate unhealthy foods more often at meals at follow up than at baseline. However, the mean score representing compliance with best practice started off high at baseline and remained close to the best practice. Therefore, at follow-up, providers were still not eating many unhealthy foods, meaning that this decrease likely has little negative influence compared to other weaker areas of the nutrition environment. Further, overall provider HEI scores increased at follow up, indicating that even if providers ate slightly more unhealthy foods, their overall diet quality improved.23
23
improvements in diet quality are predicted by improvements in feeding environment in response to the intervention, even when accounting for differences in initial diet quality. Further research is necessary to investigate how those of various diet qualities at baseline may respond differently to interventions. For now, it is useful to know that baseline diet quality is an impactful measure in studying intervention effect.
A previous study by Benjamin-Neelon et al., using the baseline sample from Keys, found foods provided, nutrition policy, and nutrition education to be associated with HEI.12 That study
was similar to the current one in that both are using EPAO and child HEI data from Keys. However, the paper by Benjamin-Neelon used only baseline data, whereas the current study takes into account the intervention effect by looking at both baseline and follow-up scores. Results from the current study did not show changes in foods provided and nutrition education to significantly predict changes in diet quality. Nutrition policy could not be examined in the current study for comparison since there was no change in this score. Differences in this study could be explained by the distinctive difference between examining baseline associations and examining change scores in a linear regression. It is possible for one variable’s change to not predict change in another, even if they are associated at baseline, especially if there is a
24
In the control arm, changes in the beverages provided predicted improvements in diet quality. Though this result is somewhat unexpected, providers assigned to the control arm did have a general awareness of the purpose of the Keys study, so it is possible that they modified their beverages provided as a relatively simple, healthy improvement. In addition, the control group spent the entire 9-month duration of the study learning about business practices; it is possible that one method providers used to save money was to provide more water and less store-bought beverages with added sugars, an economical and healthy decision.
The majority (91%) of FCCHs in the Keys study participated in CACFP, a program with relatively high feeding standards. According to a previous study by Erinosho et al. in 134 FCCHs in Mississippi, participation in CACFP is associated with healthier nutrition environment.38 Even so, nutrition environment and diet quality were able to be improved in these settings with high CACFP participation in the current study. Therefore, those without such standards would likely also see an even greater benefit when intervening on the environment.
25
since the provider knew they were being observed. Further, this study only takes into account nutrition environment and dietary intake in the FCCH, whereas nutrition environment at home may influence general dietary patterns of the children as well through formation of beliefs about certain foods.
Strengths of this study include that this is a large randomized-controlled trial with high quality, objective measures. Diet quality and environment were observed by trained data collectors using accurate, effective measures. Furthermore, this study is the first known to investigate change scores in nutrition environment and the corresponding impact on child diet quality in FCCHs.
One of the primary targets of the Keys intervention was the mealtime environment.22 This is an important target for the intervention because serving nutritious food is important for
achieving a high quality diet, but serving meals in a healthy environment is important as well to promote positive attitudes surrounding healthy eating practices. Children cannot eat healthy food if it is not put in front of them, but they will not necessarily eat healthy food just because it is there. The nutrition environment helps to form their attitudes and beliefs on healthy eating behaviors.
26
REFERENCES
1. Hales CM, Fryar CD, Carroll MD, Freedman DS, Ogden CL. Trends in Obesity and Severe Obesity Prevalence in US Youth and Adults by Sex and Age, 2007-2008 to 2015-2016.
JAMA. 2018;319(16):1723-1725. doi:10.1001/jama.2018.3060
2. Ogden CL, Carroll MD, Lawman HG, et al. Trends in Obesity Prevalence Among Children and Adolescents in the United States, 1988-1994 Through 2013-2014. JAMA.
2016;315(21):2292-2299. doi:10.1001/jama.2016.6361
3. Sahoo K, Sahoo B, Choudhury AK, Sofi NY, Kumar R, Bhadoria AS. Childhood obesity: causes and consequences. J Fam Med Prim Care. 2015;4(2):187-192. doi:10.4103/2249-4863.154628
4. Grant-Guimaraes J, Feinstein R, Laber E, Kosoy J. Childhood Overweight and Obesity.
Gastroenterol Clin North Am. 2016;45(4):715-728. doi:10.1016/j.gtc.2016.07.007 5. Nicklas TA, Baranowski T, Cullen KW, Berenson G. Eating patterns, dietary quality and
obesity. J Am Coll Nutr. 2001;20(6):599-608.
6. Whitaker RC, Wright JA, Pepe MS, Seidel KD, Dietz WH. Predicting obesity in young adulthood from childhood and parental obesity. N Engl J Med. 1997;337(13):869-873. doi:10.1056/NEJM199709253371301
7. Bray GA. Medical Consequences of Obesity. J Clin Endocrinol Metab. 2004;89(6):2583-2589. doi:10.1210/jc.2004-0535
8. Dehghan M, Akhtar-Danesh N, Merchant AT. Childhood obesity, prevalence and prevention. Nutr J. 2005;4:24. doi:10.1186/1475-2891-4-24
9. Digest of Education Statistics, 2014.
https://nces.ed.gov/programs/digest/d14/tables/dt14_202.30.asp. Accessed March 16, 2019. 10. Morrissey TW, Banghart PL. Family Child Care in the United States. 2007.
doi:10.7916/D8G45013
11. Jones-Smith JC, Dieckmann MG, Gottlieb L, Chow J, Fernald LCH. Socioeconomic Status and Trajectory of Overweight from Birth to Mid-Childhood: The Early Childhood
Longitudinal Study-Birth Cohort. PLoS One San Franc. 2014;9(6):e100181. doi:http://dx.doi.org.libproxy.lib.unc.edu/10.1371/journal.pone.0100181
12. Benjamin-Neelon SE, Vaughn AE, Tovar A, Østbye T, Mazzucca S, Ward DS. The family child care home environment and children’s diet quality. Appetite. 2018;126:108-113. doi:10.1016/j.appet.2018.03.024
27
14. American Academy of Pediatrics, American Public Health Association, National Resource Center for Health and Safety in Child Care and Early Education. Preventing Childhood Obesity in Early Care and Education: Selected Standards from Caring for Our Children: National Health and Safety Performance Standards; Guidelines for Early Care and Education Programs, 3rd edition. 2012.
15. Benjamin Neelon SE, Vaughn A, Ball SC, McWilliams C, Ward DS. Nutrition Practices and Mealtime Environments of North Carolina Child Care Centers. Child Obes. 2012;8(3):216-223. doi:10.1089/chi.2011.0065
16. Martyniuk OJ, Vanderloo LM, Irwin JD, Burke SM, Tucker P. Comparing the nutrition environment and practices of home- and centre-based child-care facilities. Public Health Nutr Camb. 2016;19(4):575-584.
doi:http://dx.doi.org.libproxy.lib.unc.edu/10.1017/S1368980015003535
17. Erinosho T, Hales D, Vaughn A, Gizlice Z, Ward D. The Quality of Nutrition and Physical Activity Environments of Family Child-Care Homes in a State in the Southern United States.
J Acad Nutr Diet. January 2019. doi:10.1016/j.jand.2018.11.012
18. Francis L, Shodeinde L, Allen J. Examining the Obesogenic Attributes of the Family Child Care Home Environment: A Literature Review. Herring S, ed. J Obes N Y. 2018;2018. doi:http://dx.doi.org/10.1155/2018/3490651
19. Liu ST, Graffagino CL, Leser KA, Trombetta AL, Pirie PL. Obesity Prevention Practices and Policies in Child Care Settings Enrolled and Not Enrolled in the Child and Adult Care Food Program. Matern Child Health J. 2016;20(9):1933-1939. doi:10.1007/s10995-016-2007-z
20. Trost SG, Messner L, Fitzgerald K, Roths B. Nutrition and Physical Activity Policies and Practices in Family Child Care Homes. Am J Prev Med. 2009;37(6):537-540.
doi:10.1016/j.amepre.2009.09.020
21. Seward K, Wolfenden L, Finch M, et al. Improving the implementation of nutrition
guidelines in childcare centres improves child dietary intake: findings of a randomised trial of an implementation intervention. Public Health Nutr. 2018;21(3):607-617.
doi:10.1017/S1368980017003366
22. Østbye T, Mann CM, Vaughn AE, et al. The keys to healthy family child care homes intervention: Study design and rationale. Contemp Clin Trials. 2015;40:81-89. doi:10.1016/j.cct.2014.11.003
23. Ward DS, Vaughn AE, Burney RV, et al. Keys to healthy family child care homes: results from a cluster randomized trial. Dev.
28
25. NC DHHS: Division of Child Development and Early Education. https://ncchildcare.ncdhhs.gov/. Accessed April 14, 2019.
26. NC Div of Child Development- Searching Resources in Child Care.
http://ncchildcaresearch.dhhs.state.nc.us/search.asp. Accessed November 13, 2018. 27. Smart Start & The North Carolina Partnership for Children - NCPC.
http://www.smartstart.org/. Accessed April 14, 2019.
28. Mann CM, Ward DS, Vaughn A, et al. Application of the Intervention Mapping protocol to develop Keys, a family child care home intervention to prevent early childhood obesity.
BMC Public Health. 2015;15(1):1227. doi:10.1186/s12889-015-2573-9
29. Heckman CJ. Motivational interviewing in health care: helping patients change behavior. Written by Stephen Rollnick, William R. Miller, and Christopher C. Butler. Guilford Press, New York, 2008. 210pp. Paperback price: $25.00 (US), £16.99 (UK). ISBN:
978-1593856120. Hardback price: $45.00 (US), £30.50 (UK). ISBN 978-1593856137.
Psychooncology. 2009;18(1):110-111. doi:10.1002/pon.1416
30. Dunst CJ, Trivette CM, Hamby DW. Meta-analysis of the effectiveness of four adult learning methods and strategies: Supplemental tables and referencesa. :26.
31. Vaughn AE, Mazzucca S, Burney R, et al. Assessment of nutrition and physical activity environments in family child care homes: modification and psychometric testing of the Environment and Policy Assessment and Observation. BMC Public Health. 2017;17(1). doi:10.1186/s12889-017-4686-9
32. Ball SC, Benjamin SE, Ward DS. Development and Reliability of an Observation Method to Assess Food Intake of Young Children in Child Care. J Am Diet Assoc. 2007;107(4):656-661. doi:10.1016/j.jada.2007.01.003
33. Guenther PM, Casavale KO, Reedy J, et al. Update of the Healthy Eating Index: HEI-2010. J Acad Nutr Diet. 2013;113(4):569-580. doi:10.1016/j.jand.2012.12.016
34. U.S. Department of Agriculture and U.S. Department of Health and Human Services. Dietary Guidelines for Americans, 2010. Wash DC US Gov Print Off. 2010;7th Edition. https://www.cnpp.usda.gov/sites/default/files/dietary_guidelines_for_americans/PolicyDoc.p df. Accessed November 13, 2018.
35. Star Rated License. NC DHHS: Division of Child Development and Early Education. https://ncchildcare.ncdhhs.gov/Services/Licensing/Star-Rated-License/star-rated-license. Accessed April 14, 2019.
36. Monsivais P, Johnson DB. Improving nutrition in home child care: are food costs a barrier?
29
37. White A, Dev D, McBride B. Obesity Prevention Practices in Childcare: Administrators’ Barriers to Healthy Eating Practices Across Childcare Contexts. J Nutr Educ Behav. 2015;47(4, Supplement):S44. doi:10.1016/j.jneb.2015.04.116