Hospital Surge Capacity for an Influenza Pandemic in the Triangle Region of North Carolina
Rachel Woodul
Honors Thesis
Supervised by: Dr. Paul Delamater
Reader: Dr. Mike Emch
Department of Geography, The University of North Carolina at Chapel Hill
Approved by: ___________________
Advisor: Dr. Paul Delamater
Approved by: ___________________
1 Introduction
Influenza, or flu, is a contagious respiratory illness caused by infection of the nose,
throat, and lungs by an influenza virus.Infection can cause mild to severe illness, with serious
cases requiring hospitalization and potentially resulting in death (“Influenza (Flu) Viruses |
Seasonal Influenza (Flu) | CDC,” 2017). Influenza is highly contagious; it is spread through
droplets emitted when an infected person coughs, sneezes, or talks, and can be spread to others
from a distance of up to six feet (“How Flu Spreads | Seasonal Influenza (Flu) | CDC,” 2017).
Symptoms of influenza infection typically develop 1-4 days after exposure, and infected
individuals are able to spread the virus to others beginning at ~1 day before the onset of
symptoms and ~5-7 days after becoming ill (“How Flu Spreads | Seasonal Influenza (Flu) |
CDC,” 2017). Because of the highly infectious nature of the virus and the natural susceptibility
of the human population (without vaccination), the United States often experiences a seasonal
influenza pandemic. A seasonal influenza epidemic is typically caused by a virus that is a
slightly mutated version of the virus from the previous year’s seasonal epidemic (“Types of
Influenza Viruses | Seasonal Influenza (Flu) | CDC,” 2017), resulting in a level of residual
immunity in the population. Residual immunity occurs when an individual has been exposed to
and developed an immune response to a virus and this prior exposure is similar enough to a new
virus to offer some level of immune protection, although the protection is often lessened (Medina
et al., 2010; Pérez-Trallero, Piñeiro, Vicente, Montes, & Cilla, 2009).
Influenza viruses circulate year-round, however, most of the cases of influenza in the
United States occur between December and February (“Seasonal Influenza, More Information |
Seasonal Influenza (Flu) | CDC,” 2017). In most patients, seasonal influenza can be treated with
2
days (“Treatment | Seasonal Influenza (Flu) | CDC,” n.d.). Serious cases of influenza may require
hospitalization and usage of a ventilator, and may potentially be fatal. The U.S. Centers for
Disease Control and Prevention (CDC) estimates that seasonal influenza in the United States
results in between 9.2 million and 35.6 million illnesses, between 140,000 and 710,000
hospitalizations, and between 12,000 and 56,000 deaths annually (“Disease Burden of Influenza |
Seasonal Influenza (Flu) | CDC,” 2017). The actual impact rates of seasonal influenza vary
greatly from year to year based on the strain of influenza virus that has become epidemic during
that season.
Sometimes, though, a different type of influenza virus emerges; a virus that is both a
result of natural genetic variation and unlike any other circulating strain. In these cases, the strain
is entirely novel, in that there is no vaccine available to combat diffusion and it is so dissimilar
from any previously circulating strain that there is no residual immunity in the human
population. This unique variation in viral strain is the greatest contributor to occurrences of
pandemic influenza (Monto, Comanor, Shay, & Thompson, 2006). Given little existing
immunity in the human population, the attack rate for this type of virus will be much higher than
that of a typical influenza virus and many people will become ill. Because of the nature of
infectivity of influenza, a majority of people will be able to transmit the virus before they realize
they have been infected, and some individuals will spread the virus despite experiencing very
few symptoms. Though rare, what may have started as a small outbreak or even a local epidemic
of a novel influenza virus can quickly become a pandemic.
Some “high risk” demographic groups, including young children and the elderly, are the
most likely to have serious complications from influenza infection. However, an entirely novel
3
type of care that is needed, and the volume of care that is required. When compared to a typical
seasonal influenza epidemic, a novel influenza strain that becomes pandemic could increase
death rates by more than 56% (“How Is Pandemic Flu Different from Seasonal Flu?,” 2017),
quickly overwhelming health care systems and having catastrophic consequences.
There have been four influenza pandemics since 1900; taking place in 1918, 1957, 1968,
and 2009. The 2009 H1N1 influenza A pandemic, known colloquially as “swine flu”, was first
detected in the United States (“Past Pandemics | Pandemic Influenza (Flu) | CDC,” 2017) and is
the most recent influenza pandemic at the time of this writing. However, the 1918 H1N1
influenza A pandemic, or the “Spanish Flu” pandemic, is probably the most well-known. About
one-third of the world’s population became infected and more than 50 million people worldwide
died as a result of infection (Morens & Fauci, 2007), making it the most severe influenza
pandemic in recent years (“Past Pandemics | Pandemic Influenza (Flu) | CDC,” 2017) and one of
the deadliest public health crises in human history (Morens & Fauci, 2007).
Should a pandemic with the same infectivity parameters as the 1918 Spanish Flu
pandemic occur today, the number of both infected individuals and fatalities would greatly
exceed typical rates of seasonal influenza. Because the population today is much larger, it is
likely that both counts would also surpass those of all three pandemics of the twentieth century
and potentially the 2009 H1N1 swine influenza pandemic. Though this seems like a doomsday
scenario, it is not as hyperbolic as one would think. At the time of writing, the peak
influenza-like-illness (ILI) activity level (or percent of overall visits to a healthcare facility attributed to
influenza) for the 2017-2018 seasonal influenza epidemic was 7.7%. The peak ILI level for the
2009 H1N1 swine flu pandemic was 7.7% and the average ILI level for a seasonal epidemic is
4
of the ways that population size can influence the size of an outbreak or pandemic, potentially
contributing to the pandemic potential of the agent.
ILI levels are indicative of the magnitude of individuals that will demand care from
healthcare facilities throughout the course of an epidemic or pandemic, and unusually high ILI
levels may result in unexpected increase in demand for care. The ability of the healthcare system
to respond to this increased demand for care is known as “surge capacity” (Barbisch & Koenig,
2006). Often, healthcare facilities will erect temporary facilities in parking lots and transform
available space like hallways and waiting areas into patient care areas to meet this increased
demand. During such a competition for hospital resources, it is likely that many individuals
accessing or attempting to access hospitals may not be able to realize their access, or utilize
health care services due to the still finite amount of resources available. Especially in large-scale
crisis events, an individual’s ability to utilize resources may be limited by their physical distance
from the health care facility. Distance decay, a governing law in spatial analysis, allows the
assumption to be made that individuals located closer to the facilities will be able to physically
access the facility before individuals located further from the facility, thus giving them a higher
potential to utilize hospital resources (Morrill, Earickson, & Rees, 1970).
The aim of this research is to construct a model to evaluate the ability of the healthcare
system to provide care in the event of an influenza pandemic. Using the Raleigh-Durham-Chapel
Hill metropolitan statistical area, also known as the Triangle, as a case study, I investigate how a
pandemic similar to that of the 1918 Spanish Flu pandemic would affect the population of the
Triangle and the ability of the hospital system to respond. I seek to answer the following
5
1. If an influenza pandemic similar to that of the 1918 Spanish Flu pandemic were to
occur, how would the population of the Triangle region of North Carolina be
affected?
2. At what point during an influenza pandemic would the hospital system of the
Triangle exceed its capacity to provide care to infected individuals?
3. When considering the effect geographic distance can have on the ability of
individuals to utilize hospital resources, how many individuals will be unable to
receive care and where will they be located?
Statistical and spatial modeling is used to simulate an influenza pandemic in the Triangle, and a
capacitated shortest distance allocation model is used to apportion the infected population of the
Triangle to the nearest hospital with available treatment space until the capacity of the system is
exceeded.
The intellectual merit of this project is in its contribution to both the existing literature
and the constantly evolving discussions regarding large-scale disaster planning, health care
system response, and pandemic preparedness, as it specifically investigates the spatial aspect of
health care administration in the event of a sudden increase in demand for care. It will aid in the
understanding of surge capacity in existing hospital systems and enhance the ability of the
healthcare system to respond to unpredicted health crises that affect a disproportionately high
number of individuals. The integration of existing capacity parameters for each hospital in the
study area makes this model a valuable tool for disaster planning in the Triangle region, since it
visualizes the expected response of the system based on current capacity values of hospitals in
the Triangle and reveal potential weaknesses in the system response. However, the model allows
6
other hospital systems outside of the Triangle region. Additionally, this novel application of
facility level data highlights vulnerable geographies within the study area; geographies in which
residents may be unable or unlikely to receive care in the event of an influenza pandemic,
epidemic, or other large-scale disaster.
There is an urgent need for models such as this one, as demonstrated by the 2017-2018
seasonal influenza epidemic in the United States, which is still ongoing at the time of writing.
Though a seasonal epidemic, not a pandemic, hospitals across the United States are exceeding
surge capacity and beginning to implement alternative care sites for influenza patients
(Karlamangla, n.d.). This is demonstrative of the observed inability of the existing system to
provide care for an increased number of patients associated with seasonally epidemic influenza,
suggesting an inadequacy in preparedness for pandemic influenza.
This model is flexible in its application; it can be implemented in any region given the
availability of similar input data. It can be integrated with existing preparedness and response
plans to evaluate the efficacy of the system response. Additionally, this model enhances the
understanding of surge capacity created by existing capacity models, such as FluSurge, by
incorporating the location of patients and facilities into its modeled system operations. FluSurge
and other existing capacity models consider the effect that limited supply may have on the ability
of a healthcare system to provide care, which this model also does. However, this model’s
novelty is in the consideration of distance as the factor that might allow an individual to utilize
7 Background
Influenza is a contagious respiratory illness caused by influenza viruses. There are four
types of influenza viruses, classified by antigenic type. Influenza A and B viruses are known as
Human Influenza and cause seasonal epidemics. Influenza C typically causes only a mild
respiratory illness in hosts, and Influenza D is not known to infect humans. Influenza A viruses
are further classified based on two proteins found on the outer surface of the viral envelope,
hemagglutinin (H) and neuraminidase (N), and the genetic strain. Influenza B is not classified by
surface proteins, but is classified by lineage and strain (“Types of Influenza Viruses | Seasonal
Influenza (Flu) | CDC,” 2017). Historically, pandemic influenza has been caused by an outbreak
of a novel strain of Influenza A. Novel strains of influenza typically arise from one of two
mechanisms: gene reassortment between human influenza viruses and animal influenza viruses
or genome adaptation (Morens & Fauci, 2007). This new virus must be able to infect a human
population easily, be easily transmissible among humans in an efficient and sustained fashion,
and the population must have little or no pre-existing immunity (“Pandemic Influenza | Pandemic
Influenza (Flu) | CDC,” 2017). Pandemic influenza is rare; there have been only three influenza
pandemics in the twentieth century and one in the twenty-first century (“How Is Pandemic Flu
Different from Seasonal Flu?,” 2017).
Although rare, influenza pandemics have had serious impacts on human populations. The
1918 influenza pandemic, known as Spanish Flu, is among the most deadly events in human
history (Medina et al., 2010; Morens & Fauci, 2007). An estimated 50-100 million people
worldwide died during this pandemic. The 1918 Spanish Flu virus was a strain of subtype H1N1
virus, and was the base virus from which genetic reassortment of descendent strains produced the
8
influenza virus emerged to spark a pandemic, and has since become endemic in human
populations. Despite four subsequent pandemics, the 1918 Spanish Flu pandemic is still used as
the standard of pandemic influenza from which to create preparedness plans.
Brundage (2006) modeled the impacts of clinical case rates of the 1918, 1957, and 1968
pandemics in two referent United States populations as measured in the years 1917 and 2006.
He found that when applying the attack rates of past pandemics to the 2006 population of the
United States, the 1957 and 1968 pandemic attack rates resulted in greater numbers of clinical
cases and fatalities than the attack rate of the 1918 pandemic. This is unexpected, given the 1918
pandemic was the deadliest in human history (Brundage, 2006), though it may be explained by
an increase in overall population and changes in the demographic structure of the population.
The 2006 population of the United States was nearly two times larger than the population in
1918, and it has increased since the publication of the Brundage study. If the case fatality rate of
the 1918 Spanish influenza pandemic, 2.5%, were applied to the 2016 United States population,
the death rate would exceed 8 million people; this is roughly equivalent to the entire population
of Virginia (Brundage, 2006; U. S. C. Bureau, n.d.; Osterholm, 2005).
Though the 1918 Spanish Flu pandemic remains the foundation of pandemic
preparedness planning, impacts of other pandemics and severe influenza epidemics have been
incorporated into pandemic preparedness planning.The 1997 outbreak of H5N1 avian influenza
A in humans in Hong Kong catalyzed an increase in pandemic preparedness planning (“National
Pandemic Strategy | Pandemic Influenza (Flu) | CDC,” 2017), as evidence suggests that the 1918
Spanish Influenza virus emerged from an avian-adapted influenza virus to become easily
transmissible in human populations (Tumpey et al., 2005). Although H5N1 avian influenza is not
9
influenza A as a zoonotic disease capable of making the jump from animals to humans (Chan,
2002; Germann, Kadau, Longini, & Macken, 2006). H5N1 is now endemic in avian hosts
globally (Chan, 2002; “H5 Viruses in the United States | Avian Influenza (Flu),” n.d.; U.S.
Homeland Security Council, n.d.) and has been integrated into Pandemic Influenza Preparedness
Plans alongside H1N1 swine influenza viruses typically thought to have the ability to circulate in
human populations.
An integral piece of pandemic preparedness planning is in-hospital preparations.It is
likely that a novel influenza pandemic would quickly overwhelm current hospital infrastructure
(Daugherty, Carlson, & Perl, 2010; Osterholm, 2005). The 2009 H1N1 swine influenza A
pandemic highlighted the necessity of preparedness in a health care setting. At least 50% of
health care workers infected during the pandemic were infected in a health care setting
(Daugherty et al., 2010). During the outbreak of severe acute respiratory syndrome (SARS) in
2003, a respiratory disease spread in a similar fashion to influenza, many health care workers
simply did not report for work (Osterholm, 2005). Due to the mechanism of disease transmission
and probable timeline for vaccine production, it is likely that health care workers will require
medical care at a rate similar to, if not higher than, the general public (Daugherty et al., 2010;
Osterholm, 2005; Uscher-Pines, Omer, Barnett, Burke, & Balicer, 2006). However, there is
potential for communities to recruit and train volunteers to fill vacated health care work
positions.
Where hospitals may ultimately fall short in pandemic preparedness planning is not in
personnel, but in space. An influenza outbreak of any size, pandemic or not, has the potential to
overwhelm licensed hospital bed space and the resources apportioned to each bed. Demand for
10
there are about 105,000 ventilators in the United States and between 75,000 and 85,000 are in
use at any given time. A traditional seasonal flu requires over 100,000 ventilators, and a
pandemic flu would potentially require two- or three- times as many (Osterholm, 2005).
However, space would be the most valuable asset, as care cannot be delivered without proper
space. A 2005 study of the potential impacts of pandemic influenza on critical services in
England found that demand for hospital beds may exceed available hospital beds by more than
230% when not accounting for prevailing occupancy of beds by non-influenza patients (Menon,
Taylor, Ridley, & on behalf of the Intensive Care Society, 2005).
The increased demand for physical space is known as “surge”, and the ability of a
hospital to accommodate this sudden influx is known as “surge capacity”(Davis et al., 2005).
Definitions of surge capacity vary greatly throughout the literature, thus producing a single,
coherent definition is difficult. Hick, Barbera, and Kelen (2009) propose a framework with
which to refine the definition of surge capacity by identifying levels of available space, staff, and
supplies. The first level of surge capacity, Conventional Capacity, is the space, staff, and
supplies consistent with daily operations. Contingency, the second level of surge capacity, is a
level of space, supplies, and staff not consistent with daily operations but having minimal impact
on patient care. Crisis capacity, the third level, involves the implementation of adaptive spaces
and potential shortages of staff and supplies with the goal of providing sufficient patient care
(Hick, Barbera, & Kelen, 2009). This framework builds upon the work of Barbisch and Koenig
(2006), which sought to identify the essential components of an effective health care system
response to surge. Four essential components of an effective response were identified: staff,
stuff, space, and system/structure (Barbisch & Koenig, 2006; Watson, Rudge, & Coker, 2013).
11
Commission on Accreditation of Healthcare Organization, which states: “surge capacity
encompasses potential patient beds; available space in which patients may be triaged, managed,
vaccinated, decontaminated, or simply located; available personnel of all types; necessary
medications; supplies and equipment; and even the legal capacity to deliver health care under
situations which exceed authorized capacity” (Barbisch & Koenig, 2006). Of the four essential
components, “space” is often emphasized as the most important component of an effective surge
response (Hick et al., 2009; Joshi, 2008; Schultz & Stratton, 2007; Schultz & Koenig, 2006),
with hospitals serving as the health care “system” or “structures” in which the space is
operationalized.
It is important to conceptualize surge capacity of a hospital or healthcare system within
the context of physical space, as lack of physical space often serves as a reliable proxy measure
for lack of staff or equipment with which to respond to the needs of the sudden influx of patients.
For the purposes of this paper, I will use the framework for defining surge capacity proposed by
Hick, Barbera, and Kelen (2009). It is assumed that the hospitals within the study area are
operating at Crisis Capacity, in order to attempt to accurately model the effects of a sudden
influx of patients suffering from pandemic influenza on physical hospital space (and, by proxy,
staff and resources). Thus, this study will be specifically examining the “space” and “system”
components of an effective response to surge (Barbisch & Koenig, 2006; Watson et al., 2013).
Surge capacity is an essential part of pandemic preparedness. Currently, the United States
Center for Disease Control and Prevention publishes and maintains a pandemic influenza
simulation model, FluSurge 2.0, which quantifies the potential impacts of a pandemic in the
context of expected hospital surge. FluSurge 2.0 is specifically designed to assess potential surge
12
To provide an accurate result, FluSurge requires counts of beds and ventilators, count of infected
individuals, length and virulence of the pandemic virus, and duration of hospital stay. Impacts of
surge are reported as potential hospital visits and hospital stays, beds used, the percentage of
admissions that will require a bed in an Intensive Care Unit (ICU), and potential ventilators
needed (“FluSurge 2.0 | Pandemic Influenza (Flu) | CDC,” n.d.). Although it provides a thorough
output of estimated surge impacts, FluSurge can only be used to model surge at one facility, as
opposed to a system of facilities that may work together. Additionally, FluSurge is reliant on
user-input infectivity parameters. Because of this, there is the risk that the input pandemic
parameters are not plausible in the population served by the modeled facility and thus, the output
of modeled surge response may not be accurate. It is also important to note that FluSurge is a
model of potential impacts in one user-generated scenario and should not be used as a tool to
estimate accurately the impacts of a specific influenza pandemic. However, as a pandemic
model, the integration of surge capacity and potential population case rates makes FluSurge a
valuable tool to include in assessing pandemic preparedness of health care facilities. Menon,
Taylor, and Ridley (2005) utilized a previous version of FluSurge (1.0) to create their assessment
of potential impacts of an influenza pandemic in England. By modelling a surge in demand for
hospital care based on an 8-week epidemic and a 25% attack rate, Menon et al. (2005) found that
not only would demand exceed conventional capacity by more than 230%, but over 75% of ICU
beds would be occupied by influenza patients at any given time during the epidemic. A
shortcoming in the FluSurge 2.0 model and concepts of surge capacity, highlighted by Menon et
al. (2005), is that FluSurge 2.0 provides estimates of surge and demand under the assumption
that all hospital beds are vacant and able to be used in a surge response. Surge capacity, as a
13
in the event of a sudden influx of patients, assumes all hospital beds and potential care spaces to
be empty and able to be utilized. This, however, is not reflective of the reality of hospital
operations. There would likely be long-term care patients or patients suffering from acute
illnesses (non-influenza) filling hospital beds, and potential space for surge response may not be
realistically operational were an influenza pandemic to begin without warning. It is likely that
potential care spaces would require adaptation before they are able to be operationalized for
patient care.
Theoretical Background
Spatial accessibility to health care is an important concept in both health care
administration and in health geography and it is becoming an increasingly more relevant
question in health crisis planning. Should there be a scenario in which large numbers of the
population need care at the same time comprehensive knowledge regarding the ability of the
healthcare system to administer care to large numbers of people will be crucial. However, the
individuals must first be able to access the healthcare system. There have been many attempts to
model the ability of the population to access the healthcare system; a few of the more popular
models include simple supply-demand ratios, gravity models, and floating catchment area
metrics. This research utilizes a capacitated allocation model to simulate access. The allocation
method draws on the theoretical bases of container metrics, gravity models, and floating
catchment areas to inform its own method of considering access, and the method of modeling
utilization of facilities by infected individuals originates in the theoretical bases of Huff Models.
14
Container-based metrics, also known as supply-demand ratios, are among the simplest
measures of spatial accessibility. A ‘container’, often a pre-existing boundary, is applied to the
study area and individuals that are located within the container are assumed to utilize the
healthcare facility within the study area. The count of services available at the facility is the
supply, and the number of the individuals within the container become the demand, generating a
measure of services available per individual. However, this metric fails to consider the
theoretical nature of boundaries. If the container boundary is a county line, for example,
individuals who may be located on the border of two counties may not seek care at the facility
assigned to their container, but may instead access a facility in the adjoining county because it is
physically closer to them. Additionally, this metric is reliant on the size and location of the
container to generate its measure of accessibility. The ratio of services per individual at one
facility will vary drastically between a container large enough to capture 1000 people and a
container only large enough to capture 10 people. The location of the container boundaries also
directly influence the metric, as boundaries can be moved to include or exclude individuals from
the service area of the facility, altering the resulting ratio.
Gravity Models
Hansen (1959) developed a gravity model to investigate potential spatial accessibility,
originally intended to examine the ways in which access to employment shapes land use around
metropolitan areas. In the Hansen model, access is defined as the potential for opportunities for
interaction (Hansen, 1959). Access, then, is a generalization of the relationship between the
population of an area and the distance they must travel to take advantage of the opportunity
15
opportunities, and this distribution is adjusted for the geographic separation of the population and
the opportunities, written as:
1
A
2 = 𝑆2𝑇1−2𝑥
where
1A2 is a relative measure of the accessibility at point 1 to the opportunity at point 2
S2 is the size of the opportunity at point 2
T1-2 is the travel time or distance between point 1 and point 2
x is an exponent describing the effect of the travel time or distance between point 1 and point 2 (Hansen, 1959)
Access (A) at point 1 to the opportunity at point 2 is directly proportional to the size (S) of the opportunity and is inversely proportional to some function of the distance (x) separating point 1
from point 2. The total accessibility experienced by individuals located at point 1 is defined by
the summation of the accessibility measures to each of the opportunities in the study. The
function of distance (x) is an attempt to capture the notion that an individual’s willingness to traverse a distance is dependent upon the purpose of the travel. Hansen proposed exponents of
2.20 for work-related travel, 2.35 for social travel, and 3.00 for shopping-related travel. The
function of distance does not include a function of distance for healthcare-related travel, thus
making the original gravity-based model less than optimal for visualizing population access to
healthcare services.
Joseph and Bantock (1982) were among the first researchers to apply measures of
potential accessibility to health geography, and adapted a gravity model to do so. They
determined that given a maximum range per service offered and assuming that each individual in
16
to the service will be dependent upon the relative location of the population and the service.
Using access to general practitioners as a case-study with which to model potential access to
services, they proposed the following gravity model:
𝐴
𝑖= ∑ 𝐺 𝑃
𝑗 𝑗/𝑑
𝑖𝑗∙𝑏where
Ai is potential physical access of the population of area i to general practitioners
GPj is the general practitioner at point j within the range of area i
dij is the distance between I and j
b is a function of distance (Joseph & Bantock, 1982)
To capture the effect that population demand, a function of population size, may have on the
availability of services, Joseph and Bantock (1982) proposed a subsequent model for estimating
differential availability of services, represented as differential availability of physicians:
𝐷
𝑗= ∑ 𝑃
𝑖/𝑑
𝑖𝑗𝑏𝑖
Where the demand on a physician (Dj) at point j is a function of the population size within the
service area of point j (or within the maximum range per service offered) modified by the
distance from the population to point j. Joseph and Bantock (1982) then combine these equations to create an adapted gravity model that captures the effect that differential availability of service
will have on potential access to healthcare (𝐴𝑖∗). In the case study, services are again represented
17
𝐴
𝑖∗= ∑ [𝐺𝑃
𝑗 𝑗/ ∑ 𝑃
𝑖 𝑖/𝑑
𝑖𝑗𝑏]/𝑑
𝑖𝑗∙𝑏Because this model focuses on the relationship between the physical distance separating the
population and the service while also considering the effect of the demand the population exerts
on the service, only data on population distribution and service location is needed (Joseph &
Bantock, 1982). It is a simple, yet useful measure of the potential geographic accessibility of
populations to healthcare services.
Floating Catchment Areas
Floating catchment area (FCA) metrics are based on gravity models, and incorporate
service supply, potential population demand and differential availability, and physical distance
into their estimation of spatial accessibility to healthcare services (Delamater, 2013). There are
many versions of floating catchment area models, with several of the metrics improving upon the
previous one. Though FCA metrics are gravity-based models, a notable difference between FCA
metrics and gravity models is that FCA metrics attempt to merge measurements of spatial
accessibility and differential availability into a single measurement representative of the overall
accessibility of services by the population (Delamater, 2013; Guagliardo, 2004). This
measurement of accessibility is assigned to the geographic area as Xamount of service (i.e.
physicians, hospital beds, etc.) per Y amount of the population, demonstrating the services
available to the population considering the physical accessibility of the population to each
18 Huff Model
The Huff Model (Huff, 1963, 1964) is designed to capture the probability (P) that an individual (i) will utilize a facility (j) when presented with the option of multiple facilities, given that the utility of j is relative to the sum of the utility of all other facilities (n) considered by the individual (i):
𝑃𝑖𝑗 = 𝑈𝑗/ ∑
𝑛𝑗=1𝑈𝑗
In this model, choice behavior is viewed as probabilistic and is dependent upon the perceived
utility of the facility. The perceived utility is any variable or parameter upon which the individual
is assumed by the model to give preference to one facility over another. To adapt this model to
capture the probability of choosing healthcare facilities, utility (U) is changed to capacity (C), which may be represented by the service being studied (i.e. physicians, hospitals beds, etc.) (J.
Luo, 2014). By doing this, the utility of the facility to the individual, the factor by which they are
assumed to make their decision, is actually the capacity of the facility to provide care.
Additionally, distance (dij) and a distance impedance coefficient (-β) is incorporated into the
model to consider the effects that travel time may have on an individual’s choice behavior (J.
Luo, 2014). The Huff Model for quantifying probability of utilization of a healthcare service site
can then be written as:
19 Capacitated shortest-distance allocation model
The allocation model presented in this paper adapts accessibility metrics to simulate
population access in order to measure utilization. Joseph and Bantock’s (1982) adapted gravity
model will serve as the basis for the component of capacity in the model acting as a limiting
feature of facilities. Though capacity is typically considered an attracting factor (Joseph &
Bantock, 1982; J. Luo, 2014), it will be considered the limiting factor in the ability of individuals
to utilize health care. By doing so, the model will measure not the ability of the population to
access a facility as a floating catchment area metric would, but their ability to realize access
through facility utilization. However, the effect of service supply on access is being investigated
in a similar fashion to floating catchment area metrics. Instead of assigning a measurement of
access to specific population points, as a floating catchment area would, this model considers the
level of access at specific population points. Unlike a floating catchment area metric, this model
outputs the ability of the population to access and utilize facilities, rather than potential access of
the population. Although not a container-based metric, the model will utilize a type of container
in simulating access to facilities. Specifically, the boundaries of the study area serve as the
container, so to limit the population to accessing only facilities within the study area. The
allocation method by which individuals are assigned to access their nearest facility comes from
the Huff Model (Huff; 1963, 1964) of probabilistic selection behavior, in that the utility variable
is distance from the individual. A closer facility will have a higher perceived utility value and
20 Methods and Materials
Study Area
The Raleigh-Durham-Chapel Hill Metropolitan Statistical Area of North Carolina, also
known as the Triangle region or, more colloquially, “the Triangle”, is the second largest
metropolitan region in North Carolina (U. S. C. Bureau, n.d.). The region is made up of seven
counties, which vary from highly urbanized to rural. Anchored by The University of North
Carolina at Chapel Hill, Duke University, and North Carolina State University, the Triangle also
contains fourteen other universities and colleges, as well as the Research Triangle Park, the
largest research park in the world (“About The RTP,” n.d.), from which it takes its name. When
studying access to and utilization of health care, the Triangle presents an interesting case study.
The population is highly mobile and is demographically diverse. Because of the abundance of
educational institutions and the Research Triangle Park, there are highly concentrated centers of
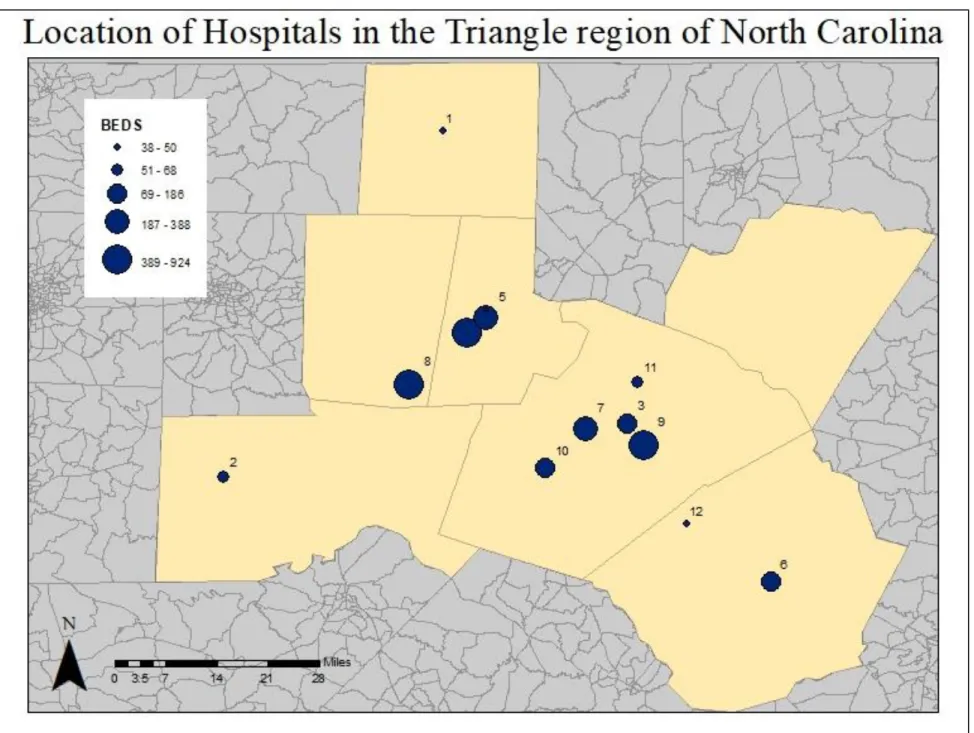
young adults near the urbanized areas. Within the boundaries of the study area are eleven
hospitals, two of which are major research hospitals. The health care infrastructure is well
developed, however the socioeconomic status of the population is variable from place to place
within the study area (U. C. Bureau, n.d.).
In the Triangle, there are both private and public health care facilities. The UNC Health
Care system, based at the University of North Carolina at Chapel Hill, is the public health care
complex of the state of North Carolina and offers primary and specialty care in addition to
operating public hospitals and outpatient clinics throughout the seven county region. Duke
Health, based at Duke University in Durham, is the other major hospital and outpatient clinic
complex in the region; however, Duke Health is a private health care provider. Several hospitals
21
There is at least one hospital per county, with one exception; there is no hospital in Franklin
Table 1- Number of beds per hospital
Hospital ID
Capacity
(beds)
1
38
2
68
3
186
4
924
5
316
6
155
7
388
8
621
9
628
10
156
11
61
1 Data acquisition and pre-processing
Shapefiles of census block groups for North Carolina and tables of the 2010 population
by age group by sex for North Carolina were downloaded from the IPUMS National Historical
Geographic Information System database, maintained by the Institute for Social Research and
Data Innovation at the University of Minnesota (Manson et al., 2012). I combined population
counts by age group by gender to create total population counts by age group for each census
block group in North Carolina. I then joined the counts to the census block group shapefile and
clipped the resulting shapefile to the size of the study area.
The spatial data file of hospital locations was downloaded from the NC OneMap
GeoSpatial Portal, and attribute values of licensed bed numbers were referenced to a registry
published and maintained by the North Carolina Department of Health and Human Services –
The road network shapefile for North Carolina was downloaded from the North Carolina
Department of Transportation. The roads shapefile required a significant amount of data cleaning
in order to create a usable network dataset. First, connected road segments with similar attributes
were dissolved. Road connectivity was enforced at intersections using planar topology.
Digitizing errors (undershoots and overshoots) were fixed using ArcGIS’ automated tools. After
cleaning, the roads shapefile was converted to a road network layer.
I calculated geographic centroids for each census block group and located them on the
road network. Hospital locations were also located on the network. Using this network, I
conducted a shortest driving distance analysis from each census block group centroid to each
hospital in the study area. This produced an origin-destination (OD) table with the block groups
as the origins, the hospitals as the destinations, and the driving distance between each.
I estimated age group-specific clinical case rates from the 1918 Spanish Influenza using a
graph published by the U.S. Army Center for Health Promotion and Preventive Medicine
(Brundage, 2006) and the original 1919 mortality and case surveillance tables published by the
U.S. Public Health Service (Frost, 1919, 1920; Frost & Sydenstricker, 1919). The age groups and
clinical case rates are presented in Table 2.
To calculate the total number of expected flu cases in the Triangle region based on an
outbreak similar to 1918, I multiplied the age group-specific clinical case rates by the
corresponding age group population counts for census block group. This resulted in a count of
total expected influenza cases per age group per census block group. The age group counts were
summed for each block group and then summed over all block groups to create a count of total
infected people for the study region by age group. The age group counts for the study area were
1
calculated the relative proportion of infected people by age group for the study area by dividing
2
Table 2 - Clinical case rates (CCR), populations (POP), estimated number of people infected (INF), and percent of all infected people (INF%) by age group.
Age group
CCR
POP
INF
INF(%)
0-4
32.0%
112,873
36,119
9.03%
5-9
37.5%
108,391
40,646
10.17%
10-14
36.0%
106,305
38,269
9.57%
15-19
33.0%
111,111
36,666
9.17%
20-24
32.0%
111,036
35,531
8.89%
25-29
32.5%
116,692
37,924
9.49%
30-34
32.0%
119,652
38,288
9.58%
35-39
28.0%
124,254
34,791
8.70%
40-44
22.5%
122,255
27,507
6.88%
45-49
20.0%
117,718
23,543
5.89%
50-54
16.0%
104,328
16,692
4.18%
55-59
13.0%
86,590
11,256
2.82%
60-64
12.0%
71,106
8,532
2.13%
65-69
11.5%
48,346
5,559
1.39%
70-74
10.0%
33,354
3,335
0.83%
3 SIR Model Development and Pandemic Simulation
A susceptible, infectious, and recovered (SIR) model without vital dynamics was used to
simulate the daily counts of susceptible, infected, and recovered people in the study area, given
similar characteristics to the 1918 Spanish Influenza and a modern population. An SIR model
can be expressed by the following set of differential equations:
Δ𝑆
Δ𝑡
= −
𝛽𝐼𝑆 𝑁
,
Δ𝐼Δ𝑡
=
𝛽𝐼𝑆
𝑁
− 𝛾𝐼
, andΔ𝑅
Δ𝑡
= 𝛾𝐼
where S is the number of susceptible people at time t, I is the number of infected people at time t,
R is the number of recovered people at time t, N is the total population count, β is the rate at which individuals move from susceptible to infected, and γ is the rate of recovery. The necessary
input parameters to solve the SIR model were estimated using the age group-specific clinical
case rates applied to the study area population (N).
Using the total count of infected persons, I estimated the infectivity parameters
necessary to produce an influenza pandemic with the same clinical case rate as the 1918 Spanish
Influenza in the 2010 population of the Triangle region. First, I divided the count of total infected
persons for the study region by the total population of the study region (N) to create a proportion of the population infected by the end of the end of the pandemic event (zƒ).
𝑧
ƒ=
𝑐𝑜𝑢𝑛𝑡 𝑜𝑓 𝑡𝑜𝑡𝑎𝑙 𝑖𝑛𝑓𝑒𝑐𝑡𝑒𝑑4
I then used the zƒ value to estimate the R0 value.
𝑅
0= −
log (1 − 𝑧
𝑓)
𝑧
𝑓I calculated the rate of recovery (γ) for the population using seven days as the average maximum
infectious period in which an infected person is able to transmit the virus to a susceptible
individual (“About Flu | Seasonal Influenza (Flu) | CDC,” 2017).
𝛾 =
1
𝑖𝑛𝑓𝑒𝑐𝑡𝑖𝑜𝑢𝑠 𝑝𝑒𝑟𝑖𝑜𝑑
Using the calculated rate of recovery (γ) and R0 value, I then estimated the rate at which individuals will move from susceptible to infected (β) (Liu & Stechlinski, 2017).
𝛽 = 𝑅
0∗ 𝛾
Other parameters required to solve the SIR model were a pandemic time of 731 days,
which is an estimation of the time of the 1918 Spanish Influenza (Barry, 2004), and a starting
count of infected persons of 15 people (~.001% of the population). Setting the initial infected
population at 15 people, rather than a single index case, was done to account for the potential
that multiple infected individuals could enter the Triangle during a pandemic event due to the
high mobility of the population. To solve the SIR model differential equations and simulate the
pandemic, I used the deSolve library in R. The SIR model output for the total number of infected
people in the Triangle region over the 731 day period was 399,583, which was nearly equal to
the total number of infected people for the entire outbreak as estimated from the age
5
The SIR model produced the total number of people infected for the entire study area per
day, which needed to be redistributed back to the age groups and back to the block groups to
produce the spatial distribution of infected people per day. The daily counts were first
redistributed to age groups based on the relative percent values found in Table 2 by multiplying
the daily count by the percent values for each group. The age group-specific daily counts were
then redistributed back to the block groups based on the percent of the age group population in
each block group. For example, the number of people aged 0-5 in block group 37013500107032
was 177 and the total number of people aged 0-5 in the study area was 112,873. As such block
group 37013500107032 contained 0.15% of all people in this age group. If the age
group-specific daily count of infected people was 74 (Day 285), block group 37013500107032 would
have 74 * 0.15% = .11 infected people for this age group. This process was implemented for
each block group and each age group to calculate the age group-specific counts of infected
people per block group per day, which were then summed to calculate the total count of infected
people per block group per day.
General Allocation Model Assumptions
For the purposes of this model, physical space with which to provide care was
represented by number of hospital beds, which is used as a proxy for space, resources, and
providers.
Because pandemic disease by its nature affects large numbers of the population in
relatively similar ways, it can be assumed that affected members of the population within such a
large geographic area will be attempting to access similar healthcare services. For the purpose of
this study the infected population attempts only to access hospitals located within the boundaries
6
attempting to access healthcare facilities simultaneously each day; though this is not an entirely
realistic scenario, it allows for the highly nuanced influence of distance on hospital utilization to
be captured. Finally, the model assumes that individuals will attempt to access the facility closest
to them with available space. This assumption is reliant on the Huff Model of probabilistic
selection behavior, which states that individuals will choose the facility they perceive to have the
highest utility value when utility is defined by considering distance and size (Huff, 1963, 1964; J.
Luo, 2014). In this model, size is represented by capacity, not physical size.
Once an individual in this model has successfully utilized a facility, they will remain in the
hospital, occupying a bed, for three days. (Davis et al., 2005) assessed surge capacity and
discharge rates for mass-casualty events at multiple hospitals and found that, in a large portion of
mass-casualty events, patients can be discharged within 24-72 hours after admission. In order to
model the potential influence of length of stay on surge capacity for an influenza pandemic, I
chose to model the hospitalization period as 72 hours.
Capacitated Shortest Distance Allocation to Hospitals
A capacitated shortest distance allocation model was developed for this study, wherein
infected individuals in each census block group were allocated to their nearest hospital each day.
In the model, allocated individuals that were hospitalized (utilized a bed) for three days (length
of stay). The allocation model used an iterative process to assign infected individuals from each
block group to the nearest hospital (for each day). To accomplish this, I first ordered the OD
table of block group to hospital driving distances produced by the network analysis from shortest
to longest distance. This was used this as the order in which infected individuals would attempt
7
If all infected people in a block group were allocated to the hospital, the remaining
distance pairs (block group to hospital) for that block group were removed from the OD
table.
If the number of infected people in a block group was greater than the remaining capacity
at the nearest hospital, the number that would bring the hospital to capacity were
allocated to the hospital. The remaining number infected people for the block group was
noted. Because the hospital’s capacity was reached (could no longer accept people that
day), the remaining distance pairs (block group to hospital) for that hospital were
removed from the OD table.
For each day, the allocation of infected people continued by iterating through the distance OD
table (which was updated after each iteration to account for the number of infected people
allocated, the number of infected people remaining, and remaining hospital capacity) until all
infected people were either hospitalized or hospital capacity was reached. If hospital capacity
was exceeded, remaining individuals were considered to have been “turned away”, thus not
receiving care. At the beginning of each successive day in the allocation model, for each
hospital, the patients that had been hospitalized for three days were discharged (and removed
from the hospital’s capacity), while the patients that had been hospitalized for two days were
shifted to being hospitalized for a third day and the patients that had been hospitalized the
previous day were shifted to being hospitalized for a second day. As such, each hospital’s
remaining capacity was updated prior to the allocation process of each day’s newly infected
8 Capacity Scenarios
In the first scenario of the infection and allocation model, maximum hospital capacity
was set as the number of licensed beds for each hospital as reported by the North Carolina
Department of Health and Human Services – Division of Health Service Regulation. This is
reliant on the assumption that all licensed beds are available for in-patient care of individuals
infected with influenza and that each licensed bed is accompanied by an appropriate supply of
medications, ventilators, medical professionals, and other necessary supplies. Though somewhat
unrealistic, this assumption was made to model a scenario in which all available hospital
resources are directed towards treating pandemic influenza victims. This scenario allows for the
assessment of the maximum licensed ability of the hospital system to provide care to pandemic
influenza patients.
Two additional scenarios representative of both surge capacity operations and
conventional capacity operations were created to investigate the effects of hospital capacity on
the ability of the hospital system to provide care for the infected population.
The second iteration of the model represented maximum hospital capacity as double the
number of licensed beds. This is representative of a scenario in which hospitals are able to
provide one additional treatment space for each licensed bed. This scenario also assumes that all
treatment spaces are available for in-patient care of individuals infected with influenza and that
an appropriate supply of medications, ventilators, medical professionals, and other necessary
supplies accompany each space. Provision of additional patient care spaces may include setting
up alternate care sites in other public facilities, converting procedure suites into patient care
9
temporary care clinics outside the hospital building in tents (Barbisch & Koenig, 2006; Davis et
al., 2005; Eastman, Rinnert, Nemeth, Fowler, & Minei, 2007).
The third iteration of the model set maximum hospital capacity for people with influenza
infections at 75% of the licensed beds. This scenario represents the likelihood that hospitals will
have individuals already receiving in-patient care and utilizing beds and associated resources for
general (non-influenza) acute care conditions. For the purposes of this model, all hospitals were
assumed to begin with an initial occupancy of 25% of their licensed beds for providing general
acute care.
Results
SIR Model and Pandemic Simulation
The following infectivity parameters were calculated, given the age group-specific
clinical case rates, the age group-specific population of the study area, and the overall population
of the study area:zƒ = .26, R0 = 1.15, γ = .14, and β = 0.165.
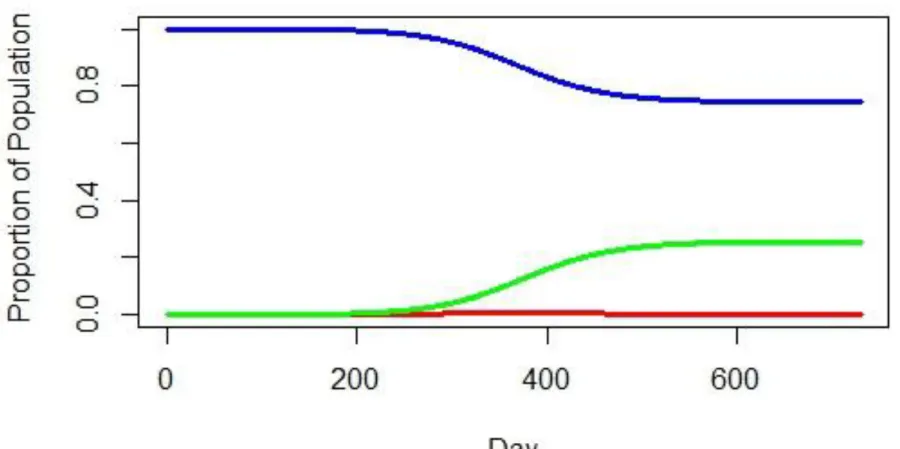
The results of the SIR model, given an outbreak period of 731 days and 15 initially
infected individuals can be found for the S, I, and R compartments in Figures 3-5 and plotted
together in Figure 6. The number of new infected individuals per day peaks at Day 368. Overall,
399,583 persons would become infected with influenza over the 731 day period. This is roughly
10
Figure 3 - Proportion of Population that is susceptible to influenza during the simulated pandemic
Figure 4 - Proportion of population that is infected with influenza during the pandemic
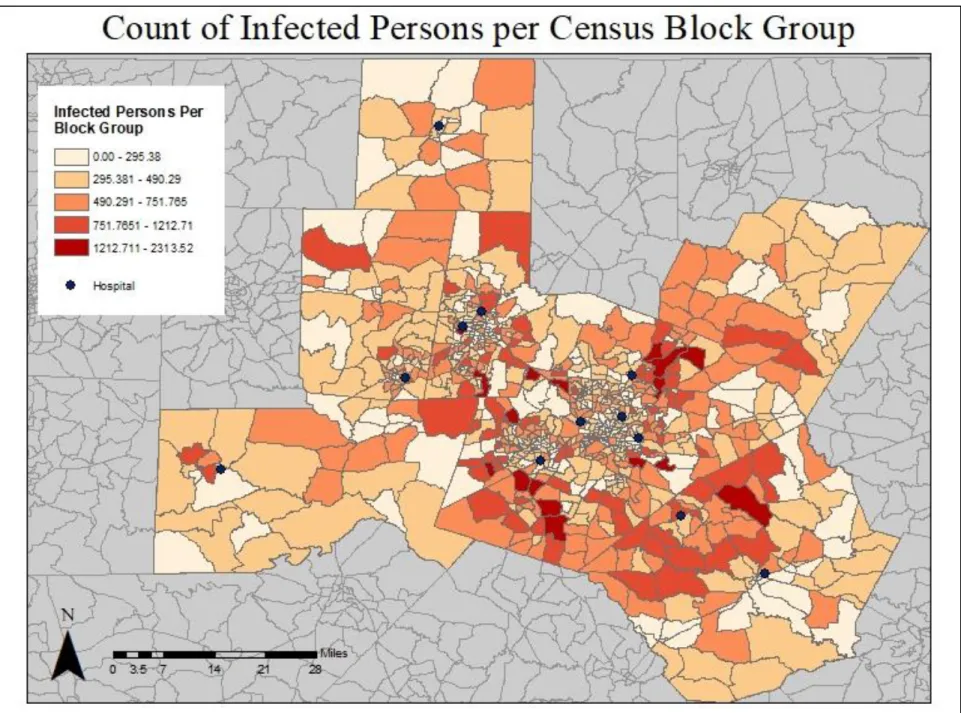
The output of the SIR model was a number of new infections per day, which was then allocated
to age groups and block groups, to result in a total number of infected persons per block group
for the entirety of the pandemic event (Figure 7). Based on the age distribution of the population
at a block group level, this output is where infections are likely to take place in the Triangle as
well as an estimate of number of infections per block group, should there be a pandemic. The
variation in infection levels across the study area is likely due to the distribution of such a large
population across the study area, however this model also accounts for the demographic age
Capacitated Shortest Distance Allocation Model
The first iteration of the capacitated shortest distance allocation model, which considered
maximum hospital capacity to be the number of licensed beds as reported by the North Carolina
Department of Health and Human Services – Division of Health Service Regulation, resulted in
317,141 individuals (79.4% of the infected population) being able to receive care. 82,485
individuals (20.6% of the infected population) would not be able to receive care. At its peak,
demand for care exceeded available beds by ~126%. Capacity for each hospital in the study area
was reached at various times throughout the study period (Table 3 and Figure 8). Capacity for all
hospitals in the system is exceeded on Day 297 of the pandemic and maximum capacity is
maintained until Day 445. Block groups located on the outer edges of the study area had higher
rates of infected individuals being unable to utilize hospitals, however they did not necessarily
have the highest counts of individuals unable to utilize hospital resources. Instead, the block
groups immediately bordering the urban block groups of the study area had the highest counts of
individuals unable to utilize hospital resources. This is likely due to the population distribution of
the study area. Though the further block groups had higher percentages of the infected
population unable to utilize hospitals, the populations of these block groups are smaller than the
populations of the block groups located closer to urban centers. Though these block groups had a
lower percentage of infected people unable to receive care, the size of their population resulted in
1
Table 3 - Day in pandemic event during which capacity is reached for each hospital in the study area
Hospital ID
Capacity
(beds)
Day Capacity
is Reached
1
38
244
2
68
283
3
186
245
4
924
297
5
316
279
6
155
264
7
388
262
8
621
291
9
628
272
10
156
219
11
61
185
2
The second iteration of the model, considering maximum hospital capacity to be double the
number of licensed beds resulted in all infected individuals being able to receive care. Capacity
for all hospitals in the system peaks at 87% on Day 380 of the pandemic (Table 4 and Figure 11).
Notably, 10 of the 12 hospitals reached capacity, one hospital nearly reached capacity, and the
1
Table 4 – Day in pandemic at which occupancy peaks for each hospital in the study area, when each hospital is at 200% capacity
Hospital ID
Capacity
(beds)
Day Capacity
is Reached
Peak Occupancy
(Percent)
1
38
283
100%
2
68
344
100%
3
186
284
100%
4
924
370
60.90%
5
316
332
100%
6
155
308
100%
7
388
305
100%
8
621
370
93.70%
9
628
319
100%
10
156
253
100%
11
61
218
100%
2
3
The third iteration of the model, in which maximum hospital capacity for people with influenza
infections is set at 75% of the licensed beds resulted in 266,932 individuals (66.8% of the
infected population) being able to receive care. 132,693 individuals (33.2% of the infected
population) would not be able to receive care. At its peak, demand for care exceeded available
beds by ~146%. Capacity for all hospitals in the system is exceeded on Day 278 of the
4
Table 5 – Day during the pandemic during which capacity is exceeded for each hospital in the study area, when each hospital is at 75% capacity
Hospital ID
Capacity
(beds)
Day Capacity
is Reached
1
38
230
2
68
267
3
186
231
4
924
278
5
316
262
6
155
249
7
388
246
8
621
274
9
628
256
10
156
205
11
61
172
5
6 Discussion
Previous research has cited distance as an important variable in both access to health care
services (Arcury et al., 2005; Joseph & Bantock, 1982; W. Luo & Wang, 2003) and utilization
behavior (Arcury et al., 2005). However, previous research has also demonstrated a lack of
association between geographic variables and acute health care visit behavior (Arcury et al.,
2005; Gelberg, Andersen, & Leake, 2000), in that geographic distance may not influence an
individual’s decision to seek out acute care services. It is important to distinguish, though, that
such research on access and utilization of health care services, whether for primary or acute care,
has focused primarily on access and utilization behavior. In this study, access behavior was
considered to be the same for all individuals in the study area, keeping with the findings of
Gelberg, Andersen, & Leake (2000) that distance may not discourage an individual from seeking
acute care services. All infected individuals in the simulated infected population were modeled to
seek access to acute care services at their closest facility and all individuals were considered to
have successfully accessed the facility to which they were allocated. However, a distinction was
made in this study between access and utilization. All infected individuals were modeled to
attempt to utilize hospital services, and their ability to successfully utilize services was
dependent upon capacity of the facility to which they were allocated. In this way, the extent to
which distance can exert a prohibitive effect on an individual’s ability to utilize health care
services when they are intent upon doing so could be investigated.
Additionally, this research has highlighted vulnerable geographies within the Triangle
region in which distance from a hospital may prohibit a majority of the population from being
able to receive care in the event of an influenza pandemic. In every block group in Franklin
7
in Franklin County, thus the individuals located in these block groups had to overcome a greater
distance to access a facility, making them less likely to be able to utilize services before an
The percent of individuals unable to be hospitalized per block groups appears to decrease
as distance from a facility increases, in somewhat of a radial pattern (Figure 9). Additionally, the
hospitals with higher numbers of beds appear to have larger radii in which almost all infected
individuals were able to get treatment (Table 1, Figure 2, Figure 10). The results of this case
study suggest that geographic distance from facilities does have a prohibitive effect on the ability
of an individual to utilize hospital resources, though the effect of distance could be mitigated by
an increase in the capacity of the hospital system, as was demonstrated in the scenario in which
hospital capacity was doubled. If all cases of individuals being unable to receive care are
assumed to result in fatalities, the scenario with maximum capacity being the number of licensed
beds per facility would result in a case fatality rate of ~2.0%. This is slightly lower than the case
fatality rate of the 1918 Spanish Flu pandemic, which had a global case fatality rate of ~2.5%.
The scenario in which maximum capacity was doubled resulted in no instances of individuals
being unable to receive care, and thus no fatalities can be assumed for this scenario, making the
case fatality rate 0.0%. However, a case fatality rate of 0.0% is extremely unlikely, as a typical
seasonal influenza epidemic usually results in a case fatality rate of ~0.01% (“Disease Burden of
Influenza | Seasonal Influenza (Flu) | CDC,” 2017; “How Is Pandemic Flu Different from
Seasonal Flu?,” 2017; “Pandemic Influenza | Pandemic Influenza (Flu) | CDC,” 2017). The
scenario in which maximum capacity was set at 75% of licensed beds to model the potential for
there to be individuals already receiving in-patient care at the hospitals would results in a case
fatality rate of ~33.2% if all individuals unable to be hospitalized were considered fatalities.
Though these rates are dependent upon the assumption that lack of hospital care will result in a
fatality, they are indicative of the importance of hospital capacity in preparing for and mitigating
This research was not intended to be a predictor of magnitude or impact of future
influenza pandemics, but rather to model the capacity of a specific health care system to provide
care for the population in the event of an influenza pandemic. However, this model was reliant
on several assumptions, and thus is subject to several limitations. The pandemic simulation did
not consider the potential for vaccine development and distribution during a pandemic event, and
also assumed absolutely no pre-existing immunity in the population, although other research has
suggested that individuals who have lived through pandemic influenza events may have residual
immunity against a following pandemic influenza event (Medina et al., 2010). Additionally, the
model assumed that all infected individuals would attempt to utilize hospital resources, however,
in an actual pandemic event there are possibilities for individuals to attempt to utilize health care
facilities other than hospitals as well as not seek care at all. Further, this model did account for
factors such as socioeconomic status, driver’s license possession, car ownership, or other
variables that may influence an individual’s ability to seek care.
However, these limitations provide opportunities for future research in this field,
specifically research that captures population-specific details such as vaccine availability and
utilization, residual immunity, and health care access behavior. This understanding of hospital
system capacity could potentially be integrated with existing location-allocation models to
investigate where new facilities or temporary facilities could be located within a study area to
most effectively provide care for the population in the event of a crisis or mass-casualty event.
Additionally, this capacity model can be revised to model other crisis events in which an
increased demand for care may be seen. Road and facility closures can be incorporated into this