Process: Applying Conventional Wisdom at Ingram Book Company. A Master’s Paper for the M.S. in L.S. degree. August, 2004. 61 pages. Advisor: Helen Tibbo.
After a decade of serious research in the creation and maintenance of digital
collections, a cultural heritage organization contemplating a digital preservation project or building a digital library collection is still hard pressed to answer the question “how much will it cost?” Not being able to predict costs, the institution
may spend too much of scarce resources, or, perhaps worse, simply choose to do nothing. This paper explores how several leading cost models, which seem to
vary widely from each other, can in fact be used together to form a framework to better identify and predict costs.
The focus of the paper is on the use of existing costing models, culminating in
the development of a costing tool applicable to digitization of images or similar source materials. The stimulus for the research was a pilot program conducted
at Ingram Book Company, during which actual costs of digital imaging and metadata creation were measured and compared to costs predicted by five leading models, primarily the Making of America IV project (MoA4”) conducted at
the University of Michigan.
Headings:
PREDICTING THE COSTS OF AN ONGOING IMAGE DIGITIZATION PROCESS: APPLYING CONVENTIONAL WISDOM AT INGRAM BOOK
COMPANY
by
Jonathan M. Perry
A Master’s paper submitted to the faculty of the School of Information and Library Science of the University of North Carolina at Chapel Hill
in partial fulfillment of the requirements for the degree of Master of Science in
Library Science.
Chapel Hill, North Carolina August, 2004
Approved by
Introduction
This paper was written to benefit those in the cultural heritage community who have candidate materials for digitization projects, and want to know “how much will such a conversion project cost?” Numerous projects have reported some
cost data in the literature; some studies in particular were carried out to answer the very question of “how much it cost?” Reading these, the potential project
manager would assume that costs to produce and mount (but not maintain) a collection would confidently fall somewhere between 13 cents and $400 per page. Unfortunately, a natural response to such uncertainty is to assume that
“we just can’t afford it” and so a worthy project goes no further.
In fact, the question of cost is highly complex, as the authors of project reports agree. Facing complex questions is nothing new to cultural heritage
professionals, though, and one assumes that anyone who can handle such
arcane processes as cataloging or conservation should be able to understand a complex costing model. Unfortunately, none of the existing models, by itself, will
take a reader very far in translating the described costs into cost projections for new projects. Taken as a group, these models may seem to be talking at cross-purposes, either describing different elements of a project, or combining what
though, at bringing to light elements of cost the reader may not have considered. Some explain project cost quite well, breaking elements into discrete steps. In
other cases, some key elements elude cost analysis because they were either free to the user or else were so hard to directly measure that the authors or their
respondents simply do not report the data.
One wishes the leading authors of these types of studies could all be convened
in one panel, as the National Initiative for a Networked Cultural Heritage (NINCH) attempted to do on occasion, and a common intellectual thread assembled. This
paper attempts to find that common thread by reconciling selected cost models with each other and by using them to create a practical costing tool that will be applicable across various types of projects and settings. The paper will begin
with an overview of the research question and methodology. It will review the costing literature, then present in more detail the five models used in this
research.
The next section will introduce the research environment at Ingram Book
Company, where this costing information was applied to a test project. The project involved the development of a process for creating digital images and
capturing and editing metadata for books and other publications. The cost models will then be used to predict costs of the Ingram project; those predictions will be evaluated in light of the project’s actual cost findings. The paper will then
Research methodology
The key research question for this project is, “Can a costing tool be created from elements of leading existing models that can predict costs of a particular digital
preservation project within 20%?” This question was approached through the
following steps:
1. Review five of the most commonly cited, existing costing models for
digitization projects, primarily the 2001 MoA4 report, Assessing the Costs of Conversion.
2. Use these models individually to predict the cost of the Ingram test project described below. Since wage rates vary from setting to setting,
comparisons will be made, where possible, in such comparable units as
hours of labor.
3. Design and implement a new program at Ingram Book Company to create
images and related metadata, beginning with experimental workloads and working quickly into actual production.
4. Measure all actual costs of production.
5. Compare actual costs at Ingram with those predicted in step 2.
6. In light of the findings, develop a new costing tool from elements of the
five leading models and from the Ingram project.
The test project at Ingram Book Company was set up in consultation with Ingram
digitization costing. The project was a time/cost study designed to discover the costs of a process to collect images and metadata for a particular class of
publications. Data collected included the time it took the Ingram imaging specialists to scan and produce an archival-quality color image (usually of a
book’s front cover) and also review and edit between fifteen and twenty metadata elements for each item using a basic set of rules and a controlled vocabulary.
In addition to this production labor, other costs were identified and measured, notably handling and equipment costs. Some of these were not actually billed to
Literature Review
As Steven Puglia (1999) has noted, finding cost information is quite difficult;
comparing it is “next to impossible.” Fortunately, some useful articles have appeared, and additional information can be gleaned from sources such as
project reports. Five of the most notable publications (which are in some cases groups of publications) will be covered in depth in this paper. They consist of two costing tools, the erpaTool and the HEDS Matrix of Potential Cost Factors, and
reports from three projects: Early Canadiana Online, Museum Educational Site Licensing and The Making of America IV. The three projects had cost reporting
as a specific project objective.
A very useful report is the 2003 NINCH Symposium, “The Price of Digitization:
New Cost Models for Cultural and Educational Institutions.” This conference brought together in New York City several speakers from such institutions as the
New York Public Library, the American Museum of Natural History, and the National Archives and Records Administration. These speakers were able to identify issues and summarize results from various digitization projects. Carrie
Bickner of the NYPL Visual Archives noted that rights management issues on one collection required a half-time staff person. She emphasized, as have other
authors, that metadata standards were essential to a project’s success, but time consuming and costly. Jane Sledge of the Smithsonian’s National Museum of the American Indian described an imaging project for a collection of 800,000
Sledge related how managing the resulting images caused more problems than creating the images.
Another NINCH speaker, NARA’s Steven Puglia, updated his landmark 1999
article, “The Cost of Digital Imaging.” He reiterated the difficulty of finding useful costing information, and noted that comparing what information does exist is difficult due to hidden costs and insufficient detail. Puglia gave numerous
examples of projects with cost totals, including $20 per image for the Library of Congress’ National Digital Library; $1600/book or $5.33 for another LC project;
$2500/book for Questia Media; $20/photograph at the Bettmann Archive; $109/map for the Virginia Historical Inventory; and many others. As did Sanett when writing about the InterPARES project, Puglia stressed that ongoing costs
must be planned for from a project’s inception.
Donald Waters of the Mellon Foundation provided an excellent talk at NINCH on costs and economics in digitization. He stressed that “price” and “cost” may be quite different when costs are indirect. He noted that institutions need to
consider long term costs and benefits, such as changes in building plans or maintenance.
introduction to cost factors such as format, bit depth, handling, labor and equipment.
The single most comprehensive volume on digital preservation issues and
methods remains Kenney and Rieger’s Moving Theory Into Practice. While the entire book is useful in planning for projects and thus identifying their cost factors, Chapter 9 is especially notable. Kenney’s “Mainstreaming Digital
Imaging Initiatives” contains some cost information reported from projects of the late 1990’s, but also raises useful economic considerations. A sidebar by Meg
Bellinger explains some of the cost elements to consider when outsourcing work. The reader takes away the knowledge of numerous issues affect cost, and that many essential (and potentially expensive) steps to successful projects can be
overlooked if communication with the outsourcer is unclear.
A number of digital collection websites make at least some cost information available. Much of this information tends to be reprints of reports already in the literature, but there are some useful sections on planning. The NARA site, for
example, contains many resources, including a project planning overview by Steven Puglia. The National Park Service offers a “Digitization Costs” report,
(which estimates $17.65 to $23.25 per image); the state of Ohio in 2003 provides an updated version of its 1999 manual, Draft Imaging Guidelines. Some state historical societies, such as those of Washington and Kansas, offer training
Other sources usually fall into one of three groups: tools, project reports, and
economics. There are a small number of actual tools designed to help plan and estimate project costs. The HEDS matrix and the erpaTool are the best known.
The project reports are useful for identifying cost factors and in some cases for specifying costs. The economics literature mentioned here pertains to economic effects of decisions made during production of the digital collection.
Tools:
The RLG Worksheet for Estimating Digital Reformatting Costs. While somewhat dated, this tool is still useful for identifying potential costs. This lengthy form has
numerous spaces for multiple employees, each making different wages. The sheet assumes that actual scanning work will be outsourced and that any
encoding will be in SGML. No actual costs rates are supplied. Nonetheless, this tool was an innovation when first published, and it does prompt users to consider such hidden costs as handling and insurance.
Stuart D. Lee, Digitization Matrix for Proposed Digitization Projects. This is one
of a set of flowchart tools and related documentation created by the University of Oxford’s Bodleian Library. All are available on the Bodleian website, and are used by Oxford staff in assessing, planning and implementing digital preservation
cost data, but is structured to identify possible cost elements. One of the most commonly used directives in the Oxford tool is to “establish cost” for a process.
Electronic Resource Preservation and Access Network, erpaTool - Cost
Orientation of Digital Preservation. This document features a table of high-level
planning decisions which have an impact on the costs of digital collections, from production through ongoing preservation. Each factor is accompanied by a
summary of its potential cost impact and also some “Considerations,” or advice: the entry for the “Standards” factor, for example, states that use of standards will
lower development effort. The accompanying “Considerations” note relates standards to metadata and interoperability issues.
Project reports:
Eileen Mathias, “Anatomy of a Digitization Project.” This article describes a
project to digitize materials at the Ewell Stewart Library of the Academy of Natural Sciences in Philadelphia. Like many such reports, this one has little to report on its expenses, but much to say about the steps involved in such a
project, and how they can affect costs. The report particularly covers the importance of choosing a metadata strategy.
Tami Morse McGill, “Rapid Implementation of a Large Scale Text Digitization Project: Colorado State University Libraries’ Experience.” The value of this
neither few cash outlays nor any changes in funding. Aside from some new off-the-shelf software, all work was done on existing equipment and using existing
personnel drawn from multiple departments. The costs to the project were real and substantial; the dollar costs, though, were low. It is essential to an
understanding of cost that resources, like costs, can be expressed in both monetary and nonmonetary terms.
Don Litzer and Andy Barnett, “Local History in E-Books and on the Web.” In this project, a local public library successfully digitized some commonly used but
increasingly fragile local history materials for electronic access and for reproducing paper copies and reprint editions of books. The article is an excellent example of showing how a relatively small cash grant was combined
with available resources to provide a rapid increase in access. In addition to identifying needed resources, the report also demonstrated that the cost of
creating this expanded access was offset by reduced demands on the public services staff.
Michael Goodchild, “The Alexandria Digital Library Project.” This article
describes the development of an online map and GIS library. Goodchild explains
the issues and opportunities of the ADL, especially the rapid developments in GIS, interactive maps and augmented reality that have become feasible just since the ADL began in the late 1990s. There is no specific cost information but
the expensive nature of printed map collections which can be offset by online offerings.
Matthew Nickerson, “Heritage Through Oral History and Archival Images.” This
article describes the creation of a virtual collection by eight institutions. None of the persons involved could devote anything close to full time to the project. The value of the article is its emphasis on “tried and true” technology and simple
supporting methods such as email.
Shelby Sanett, “The Cost to Preserve Authentic Records in Perpetuity.” Writing from the perspective of the InterPARES project, Sanett notes that research so far has yielded plenty of conclusions concerning suitable preservation methods, but
relatively few for cost. She states, “such a methodology to evaluate across models has not been addressed in the literature.” She makes a similar
observation in “Toward Developing a Framework of Cost Elements for
Preserving Authentic Electronic Records into Perpetuity.” In this article Sanett writes, “So far, cost modeling for both archives and digitization has received
scant attention.” Most of Sanett’s writing addresses the costs of long-term preservation of electronic records, but relates to digital record creation as well,
preserve authentic records appears to have come at the expense of first addressing cost and policy.”
Joanne Lomax Smith and Simon Tanner’s article “Digitisation: How Much Does It
Really Cost? Is part of a training program for HEDS (Higher Education Digitization Service), the organization now known for the HEDS costing tool Matrix of Potential Cost Factors. This article is notable both for its explanation of
the complexity of cost factors, and for its basic list of the standard tasks of any digitization project. The list and the article make clear that actual digitization is
Review of Cost Models Used in this Study
This section will briefly present the five models used in this study and note some
of their similarities and differences. The Making of America IV (MoA4) model will be presented last and given the longest treatment because it forms the basis of
comparison with the Ingram project and all the others. When reading these models, it is best to keep in mind that they all have at least some common assumptions that are not always explicitly stated:
• The project will involve analog to digital conversion, most likely scanning
of source material to create digital image files of some kind.
• The source material will be static and two-dimensional, such as pages of text, photographs, microfiche, drawings or other images. Media files such
as audio or video clips, or dynamic content such as games or animations are not covered.
• The project will begin with selecting source material and go through
production to deployment; some of the models at least address a long
term view, although giving it little coverage.
• If any explicit cost information is given, it is offered simply as a guide, and
not with any promise that readers would be able to repeat such costs in their own projects.
All five models were helpful in their particular ways.
Higher Education Digitisation Service (HEDS), The HEDS Matrix of Potential
accompanying text, is exactly what those who want a quick answer are hunting for. (See Appendix C) It is unique in its organization: note that the rows of the
chart list each of nine cost factors, while the columns list seven kinds of source material (such as unbound sheets, 35mm microfilm or glass plate photographs),
plus the two post-scanning options of OCR and double re-keying for search and retrieval capability. The matrix, then, means that one can look down the row and find that 35mm microfilm may typically require “Low” preparation time but “Very
High” resource costs (due to the expensive equipment needed for scanning it.) These rankings from “Low” to “Very High” stop short of giving specific prices
(either in currency or time units) but do provide a useful method of ranking source materials and the components of cost associated with them. At the bottom of the matrix, specific cost is provided (indirectly) for each type of source
materials: a project consisting of standard A4 sheets of paper in black and white has an overall cost rating of “Lower,” which according to the nearby table could
be approximately five to twenty British pence per item, in April 2002 prices, assuming at least 2500 items. This model in no way claims to be comprehensive or even reliably accurate. Its stated aims are to provide at least a rough range
for each type of commonly used source materials, and to make the reader aware of how cost factors can vary among processes.
Electronic Resource Preservation and Access Network (ERPANET),
erpaTool – Cost Orientation of Digital Preservation (2003). This tool is a rich
digital preservation as they can affect cost. It is the only one of the five models listed that gives no specific dollar costs. It is included, however, because of its
presentation of factors significantly affecting costs. If the HEDS matrix is practical, the erpaTool is philosophical, providing such principles as “Methods
should be chosen with the idea that they survive several generations of IT.” This model is the only one that advises, as step one of planning for cost, to “identify business needs and scope of preservation (policy and risk questions.)” Step two
was to “identify laws (regulatory environment.)” While such questions may seem somewhat outside the prosaic world of costing, the fact is that such macro-level
decisions profoundly affect the entire economic situation of any project—the benefits as well as the costs.
Besser and Yamashita, The Cost of Digital Image Distribution (1998). Prior to the MoA4 report, this was the largest and one of the most frequently cited cost
models. While this report is now somewhat dated, it still has value for its comprehensive presentation of costs and the vagaries of estimating them. In this, the Museum Educational Site Licensing Project, six museums selected,
converted and supplied images and metadata; this material was combined and then distributed as a single virtual collection to seven universities that bore the
burden of deploying it. The authors thus were able with some success to
This project is also cited here because it is similar in some important ways to the Ingram project. The source images were in a variety of formats, from various
electronic files to bad copies of paper catalog pages; but the most common format was flat 8” x 10” photographs, or transparencies, many in color. Ingram
has an analogous mix of sources, but most are books, with the most common sizes being about 4” x 7” or 8” x 10, ” or the same general sizes as those used in the MESL project.
Both projects cited a need for what Besser and Yamashita termed “data
preparation.” Metadata already existed for all of the MESL images and all of the Ingram books; however, that data had to be verified, edited, supplemented and frequently converted , either automatically or by hand, since the source institution
used different metadata standards than the project. In both projects a lingering source of troublesome metadata came from differing uses of important
vocabulary. In MESL, different museums might use differing terms for the same concept; at Ingram, different publishers would describe a book binding or an edition in widely differing ways. Besser and Yamashita identified five specific
“cost centers” in producing the virtual collection and getting it to the universities who deployed it:
• Content Selection
• Image Preparation (this included creating digital images where
needed.)
• Data Preparation (this was the metadata step noted above)
• Data Transmission
The authors also reported a sixth cost center, “Other” that included administrative
and research time. Unfortunately, this figure is roughly half of the
overall project cost and is twice as large as Image Preparation, the next highest
cost. It would have been quite useful to know what this large “Other” figure actually represented and whether it could have been stated in terms of the specific cost centers.
This report is very useful in identifying and classifying some standard cost
elements (the “cost centers” noted above.) It is also helpful in allowing for differences in wage rates among institutions by using more comparable units such as time, where possible. Unfortunately, the report suffers because of wide
differences in how the participating institutions interpreted and reported their data. The report called attention to two other potentially large cost centers on
which it collected no data: cataloging and rights clearance. “Cataloging” does not here refer to entering structured metadata into a relatively small number of fields (the MESL data dictionary included thirty fields, Ingram fewer than twenty);
cataloging in this use refers to the immense records of artist biography and provenance that can take anywhere from half an hour to eight hours per item to
Kingma, The Costs of Print, Fiche, and Digital Access (2000). This
frequently cited report is based on the Early Canadiana Online Project. It is used
here because of its emphasis on costing and economics. In comparing three different access media (print, microfiche and online), the author sets forth their
differences in costs and benefits. He compares the ECO findings with notable earlier models such as those at Cornell and Yale. Noting that ECO figures were significantly higher, he points out that the ECO report took total project costs and
divided them by output to get an average. Earlier cost studies he used for comparison used time studies to estimate a per-unit cost, which was then
multiplied by the number of units. Using Kingma’s approach would have avoided the troublesome “Other” figure in the Besser and Yamashita report noted above.
The ECO report is slightly limited in its use because it does not report the costs of conversion from print directly to digital. ECO first microfilmed the print
holdings, then converted the microfilm to digital. Fortunately, the report makes each step clear.
The Making of America IV Project (2001). This project, commonly referred to as MoA4, was the fourth stage of an initiative of the Library of Congress to
digitize a large collection of nineteenth-century American books. The first and fourth stages were conducted at the University of Michigan. The articles and reports MoA4 generated are still perhaps the most commonly cited in literature
important commonly used electronic collection, the project is significant because of its other stated goals. First, while many organizations (and much of the
literature) described experiences with sporadic projects that lay outside their normal operations, MoA4 set out to describe ongoing production that was fully
integrated into routine processes of the University of Michigan and its Digital Library Production unit. Second, MoA4 from its inception was meant to measure and report costs. Its report even states that the costing research was more
important than the digital collection thus produced. The goal was to provide data and advice that would assist other organizations in planning their own digital
production efforts. As of this writing, MoA4 is still the most comprehensive report specifically written to provide advice on the production costs of digital
preservation.
MoA4 was used from the beginning as the benchmark for the research described
in this paper. It has an additional relevance to this project, since most of the items handled at MoA4, as at Ingram, are books, although it was hoped that the research findings would cover all types of flat visual media. The MoA4 also
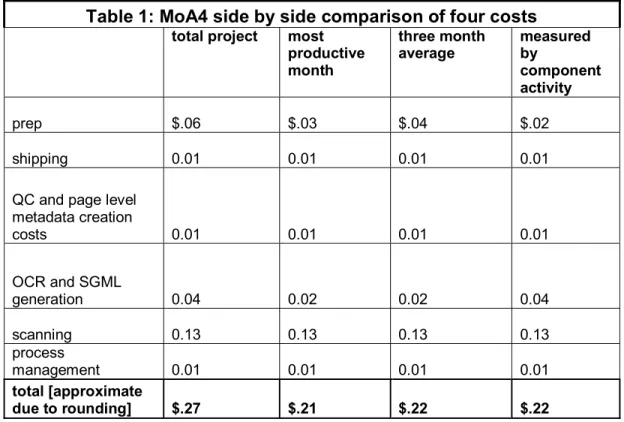
addressed, where possible, the effects of a learning curve, and reported many types of data in three columns: “total project,” “most productive month,” and
“three month average.” The report went even further by giving a fourth column, “measured by component activity.” This last measure consisted of time-study data and tended to understate actual unit costs. [See table below.] The Besser
had to add in an “Other” cost center to account for nearly half the total project cost. The Kingma report took the opposite approach by including actual total
costs, including the building and utilities, then dividing those by production units. Kingma emphasized that his cost findings tended therefore to be higher than
most others. MoA4 attempted to combine these approaches.
Table 1: MoA4 side by side comparison of four costs
total project most
productive month
three month
average measured by component activity
prep $.06 $.03 $.04 $.02
shipping 0.01 0.01 0.01 0.01
QC and page level metadata creation
costs 0.01 0.01 0.01 0.01
OCR and SGML generation 0.04 0.02 0.02 0.04
scanning 0.13 0.13 0.13 0.13 process
management 0.01 0.01 0.01 0.01 total [approximate
due to rounding] $.27 $.21 $.22 $.22 Copied from Bonn, "Benchmarking Conversion Costs"
An early step in the current research, then, was to identify Ingram production
tasks that compared directly with MoA4 tasks. Knowing MoA4’s costs for that type of task, it should have been straightforward to predict the corresponding Ingram costs. In fact, comparing such costs proved to be quite difficult, as will be
Research Setting: Ingram Book Company
This environment provided an ideal setting for a study. Ingram Book Company is
the largest trade book wholesaler in the world. In addition to distributing books and other publications, it has several closely related units offering a host of
services to libraries, booksellers, online vendors and other wholesalers. The department hosting this study is charged with collecting, creating and processing bibliographic information and related rich content and metadata. The resulting
databases are used internally, sold, or shared with such partners as Online Computer Library Center (OCLC). All databases have grown rapidly in recent
years as Ingram has expanded its scope and mission. The main image archive, for example, now holds over 1 million digital image masters and is growing rapidly.
One essential step in collecting and reviewing image and bibliographic data is at
“First receipt,” or “book in hand,” which occurs when a newly published item arrives at the Nashville warehouse for the first time. Depending on the use of the item, Ingram collects a considerable amount of metadata, ranging from about
fifteen fields for a lower-priority item up to full catalog records and related authority work. Serving as many types of customers as it does, Ingram also
Ingram is exploring ways to improve the volume and accuracy of its image archives and bibliographic databases, while controlling costs. The digitization
project used in this paper is part of that exploration. Ingram’s goal for this project was to test a new process for reviewing one type of lower-priority publications,
i.e. those which get the least amount of book in hand review. This is production work: it requires no original or copy cataloging and no research. There is no real authority work, other than the requirement to use controlled vocabulary lists for
certain metadata fields. The test process is quite similar to that described in MoA4 and other digital production projects: retrieve items, review their metadata,
Using the Cost Models to Predict Ingram Project Costs
This section first shows actual costs of the Ingram project. Then, for comparison,
each of four published cost models is used to predict Ingram costs. The following table summarizes per-item costs associated with the test project. Time and
Table 2: Cost findings for Ingram project in time and dollars
Minutes per item Dollars per item Comments
Handling costs
At $13.00/hour (Derived rate for wages and benefits. See Appendix B)
Retrieval of items by
imaging staff 0.12 $0.0260 At 500 items per hour
Returned of items by
imaging staff 0.08 $0.0173 At 750 items per hour
Retrieval and return by
warehouse staff $0.5500 Internal flat rate
Total handling $0.5933
Equipment Purchase
Costs Cost per workstation
Computer $1,200
Scanner 500
Software 450
Total equipment $2,150
Lifespan in years 3
Cost per year $716.66
Hours per year 1500 At 1500 production hours/year Equipment cost per
production hour $0.4777 $0.0149 At 32 items per hour
Total equipment per
item $0.0149
Production costs
Scan and review items 1.25
$0.2708 At $13.00/hour
Changes to metadata 0.599 $0.1298
2.14 minutes per changed item X 28% incidence of items needing change
Total production costs
(minutes, dollars) 1.849 $0.4006
Total cost per item (handling, equipment
and production)
$1.0088
Handling Costs
This work includes retrieving items to be worked and then returning them
afterwards. Handling is performed by two groups: the warehouse staff and the imaging staff. The warehouse staff do the actual pulling of items from shelves
and returning them to shelves, but do not transport them beyond the warehouse borders. The cost for this retrieval and return (combined) by the warehouse staff for the items used in this study is $ .55 per item, which is an estimated internal
rate derived by Ingram for these types of in-house orders.
The imaging staff retrieves items (from the drop-off point where the warehouse staff delivered them) at an estimated 500 items per labor hour, or 0.12 minutes per item. The return rate is about 750 items per labor hour, or .08 minutes. The
retrieval and return tasks are rather different: the retrieval involves transferring all items from pallets and totes onto carts, a laborious process. The return requires
no such transfer but is a much longer trip to the farthest point in a very busy warehouse. Since part of Ingram’s purpose in doing this project is to seek ways to reduce the costs involved in these steps, the components need to be
accounted for separately: $.055 warehouse, plus
$hourly wage rate/500 items retrieved per hour = $0.0260 or .12 minutes, plus
for a total of $0.5933 per item. The warehouse time is not known, but time cost for the imaging staff is 0.2 minutes per item.
The wage rate used here for imaging staff is $13.00 per hour. Like MoA4, this
rate includes wages and benefits. It does not reveal the rate for any one actual employee, but (as in MoA4) is an average for this type of work done at Ingram.
Equipment Costs
These figures show the cost for a workstation used in this project. Three identical
workstations were purchased for the project. It is important to note that these stations are not shared: there is one staff member per station and thus each station works when its staff member does. To obtain the equipment cost per
production hour, two other values have to be determined: useful life in years and production hours per year. The useful life of this computer equipment is
estimated at three years by departmental management. The production year of the equipment is set at 1500 hours per year. This figure is based on a 2000-hour work year (after vacation and holidays) of a typical full time employee, times
75%. The 75% is an adjustment explained by Kenney and Rieger (2000) that allows for the inherent downtime in a real employee’s work week owing to
interruptions, bathroom breaks, preparation and other time consuming tasks performed while “on the clock.” Under this widely-used concept, an eight-hour shift of “actual work” is assumed for planning purposes to have six hours of
hours per year, but it will probably only be in actual production for 1500 hours, and should be costed accordingly. Given a production rate of 32 items per hour,
the equipment cost per item is $0.149.
Production Costs
These figures include the labor involved in the actual processes of scanning an image, reviewing an item’s metadata, and making any needed changes to that
metadata.
• Reviewing and scanning without making metadata changes took an
average of 1.25 minutes ($0.2708) per item. There was no significant difference whether the scanning and metadata review were done
separately or concurrently.
• 28% of the items required changes or additions to the metadata. Doing
those changes added another 2.14 minutes ($0.4636) per changed item to
the time. Averaging this cost of metadata changes across all production equals .599 minutes or $0.1298 per item
• Average time to do all production (i.e., to scan, review and make all needed
metadata changes) was 32 items per hour, or 1.85 minutes ($0.4006) per
item.
Estimating Ingram Project Costs Using MoA4.
It was expected that using relevant MoA4 costs to predict Ingram costs would be
reasonably straightforward. In fact, three considerations quickly emerged:
• It can be difficult to fully comprehend the processes MoA4 described, even
after several readings and hours of study.
• It can be difficult to fully comprehend Ingram’s processes, even if (and
probably because) they are very familiar.
• Both the MoA4 report and this author had omitted some very important
details.
Since these cost models are only useful to the extent that they can be applied in
another settingby other people, any problems in interpreting them correctly
are worthy of note. Most of this author’s lack of understanding stemmed from wrong or incomplete underlying assumptions, or from lack of description in the
MoA4 report. Here, in MoA4 order, are some production steps relevant to both MoA4 and Ingram, and the conceptual problems encountered.
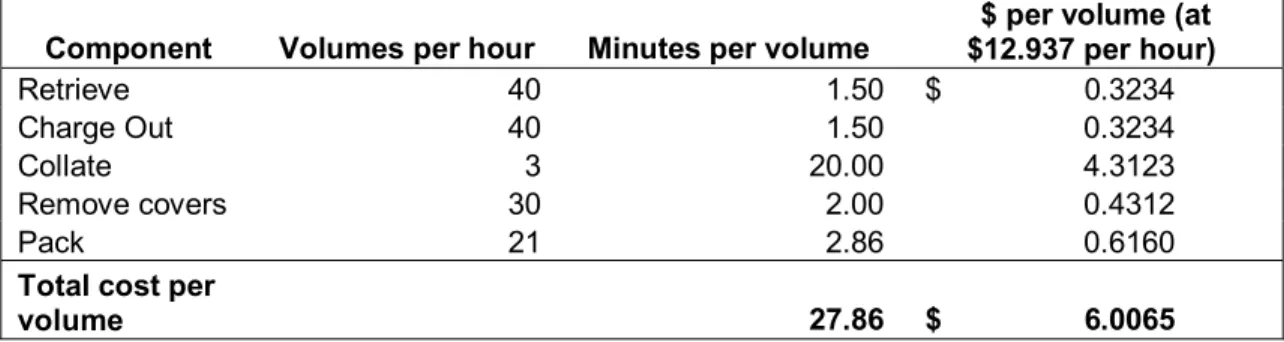
Table 3: MoA4 cost of component prep activities as measured by time studies
Component Volumes per hour Minutes per volume $12.937 per hour) $ per volume (at Retrieve 40 1.50 $ 0.3234 Charge Out 40 1.50 0.3234 Collate 3 20.00 4.3123 Remove covers 30 2.00 0.4312 Pack 21 2.86 0.6160 Total cost per
volume 27.86 $ 6.0065
MoA4 and some other reports have cautioned readers to never forget the costs of retrieving and handling materials and then returning them afterward. At the
Ingram project, handling costs were predicted to be higher than scanning and conversion costs, and one of Ingram’s motivations for supporting the project was
to see if they could be sharply reduced. Unfortunately, the MoA4 report does not explain clearly what “retrieval” entails, other than that it happened at a long term storage facility and utilized book carts. The MoA4 reported that their usual
retrieval rate was 40 books per worker hour, but the reader does not know how far the people doing the retrieving had to walk, or whether they could have gone
faster with better tools such as shelf-order picking lists, or even how much time it took to generate the picking lists. The report did say retrieval would have gone faster if the books had been collocated. In many libraries and collections, the
physical arrangements would profoundly affect the retrieval costs. If the
materials are widely scattered among buildings or floors, or are in a multitude of
file folders in a special collection, or even if the elevator is as slow as library elevators seem to want to be, then retrieval could be quite laborious.
The MoA4 report was quite helpful in explaining that it did not include costs of returning volumes to their shelves when the scanning was done. At the time of
the MoA4 report, that work was a large burden and was still being done by Preservation staff when they found extra moments. (That step was either “expensive” then, being laborious, or “free” since staff worked it into their time
MoA4 was also helpful in reporting separately the cost of charging out of
volumes, a cost which could be quite significant in another project depending on
the setting. At MoA4, though, the charging-out rate the rate was the same as for retrieval, 40 volumes per labor hour. One wonders why the two rates would be
exactly the same. It certainly could be, but could also have been an artifact of the reporting process. It would have been useful to have known what was involved in charging out. The process must have been so obvious to the MoA4 staff that
they said nothing about it other than that the volumes were charged out to Preservation. What was obvious to MoA4 certainly was not obvious to this
reader, and yet knowing more about steps such as charging out would have helped to better relate MoA4’s task to one’s own project.
“Charging out” may sound insignificant; yet, in the first run of estimated Ingram project numbers through the MoA4 model, assuming that “charging out” needed
the same time as retrieving volumes increased the per-scan production cost by almost 80%.
Retrieving, “charging out” and returning items to be scanned is of paramount importance to the Ingram project. As with MoA4, the items cannot just be
within two hours of first being received. Handling costs exceed those of scanning and metadata creation put together.
In such settings, one has to decide whether cost per page is always a meaningful
measure. MoA4 concluded that cost per page provided the best way of
explaining its costs. Since the MoA4 project involved digitizing whole books, the costs of handling each volume could be distributed across the large number of
pages per volume. In Ingram’s case, though, there is usually only one scan per volume, (two at most), plus metadata for each book and image; the cost per
scan, then, has to absorb nearly all of the cost per volume. Other digitization projects often involve collections of loose documents or images; these projects face higher per page costs for the same reasons as Ingram. MoA4 did an
excellent job, though, of noting that its disbound book pages were nearly always hand-placed one by one, rather than being rapidly sheet-fed.
Applying the MoA4 model to Ingram (before any real Ingram data had been collected) led to the following estimate. The applicable MoA4 per page costs
total $.14 per page and include scanning and metadata creation. The applicable MoA4 per volume costs total just over $.64. Since Ingram typically scans only
Table 4: Estimating Ingram project costs with MoA4
MoA4 Side by side comparison of four costs total project most
productive month three month average As applied to Ingram project prep $ 0.06 $ 0.03 $ 0.04
shipping 0.01 0.01 0.01 QC and page level
metadata creation
costs 0.01 0.01 0.01 0.01 OCR and SGML
generation 0.04 0.02 0.02
scanning 0.13 0.13 0.13 0.13 process
management 0.01 0.01 0.01 total [approximate
due to rounding] $ 0.27 $ 0.21 $ 0.22 $0.1400
MoA4 Cost of component prep activities as measured by time studies
Component Volumes per hour Minutes per volume
$ per volume (at
$12.937 per hour)
Retrieve 40 1.50 0.3234 0.324
Charge Out 40 1.50
0.3234 0.324
Collate 3 20.00 4.3123
Remove covers 30 2.00
0.4312
Pack 21 2.86 0.6160
Total cost per
volume 27.86 $6.0065 $0.6468
Total MoA4 estimate per Ingram volume $0.7868
The initial estimate of $.79 per volume turned out to be remarkably close to
Ingram staff can retrieve and return volumes much faster than did the MoA4 staff; but much of the retrieval and reshelving work is “outsourced” to the Ingram
warehouse staff at an estimated cost of 55 cents per book, time unknown. Scanning and metadata creation at Ingram, on the other hand, is considerably
more expensive in dollars than at MoA4. Since the MoA4 work was outsourced to a firm in Mexico, one knows neither the production rate nor the pay rate, but only that per page scanning costs averaged 14 cents over the project.
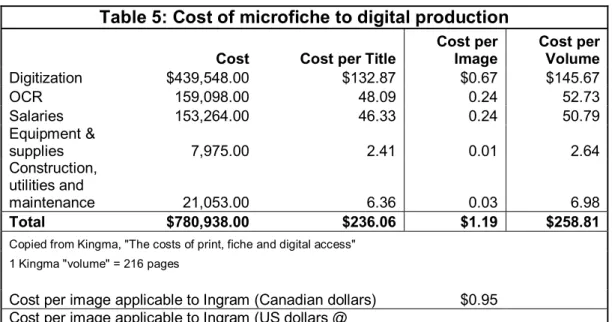
Estimating Ingram Project Costs Using Kingma
The Kingma study was notable for attempting to include total costs, including utilities and all relevant salaries, in unit production costs. The Early Canadiana Online project went through two production stages: conversion from print to
microfiche, and subsequent conversion from microfiche to digital. The resulting cost model is therefore very useful for distinguishing among costs for these three
media, but is somewhat laborious to use when trying to apply it to a print to digital conversion. The estimate used was for per page conversion from microfiche to digital; the Kingma rate for OCR was omitted, leaving a total per scan of $.95
Table 5: Cost of microfiche to digital production
Cost Cost per Title Cost per Image Cost per Volume
Digitization $439,548.00 $132.87 $0.67 $145.67
OCR 159,098.00 48.09 0.24 52.73
Salaries 153,264.00 46.33 0.24 50.79
Equipment &
supplies 7,975.00 2.41 0.01 2.64
Construction, utilities and
maintenance 21,053.00 6.36 0.03 6.98
Total $780,938.00 $236.06 $1.19 $258.81
Copied from Kingma, "The costs of print, fiche and digital access" 1 Kingma "volume" = 216 pages
Cost per image applicable to Ingram (Canadian dollars) $0.95 Cost per image applicable to Ingram (US dollars @
1.5257) $0.62
Estimating Ingram Project Costs Using Besser & Yamashita
The Museum Educational Site Licensing (MESL) project report to the Mellon
Foundation is so comprehensive that it can be somewhat difficult to use, especially since much of its research covered costs of development and
long-term deployment of a digital art library collection. For Ingram planning purposes its best figures lie in its average time costs for three cost centers. “Image
preparation” includes scanning and related activities such as cleaning.
“Unstructured data preparation” refers to creating and reviewing metadata such as notes. Ingram uses both types of data.
Table 6: MESL data on image preparation, structured data and unstructured data, in hours
Year 1 Year 2 Total hours hours/image
Image Prep 745 466 1211 0.132
Structured data 1393.2 881.2 2274.4 0.250 Unstructured data 277.8 302.8 580.6 0.063
Cost in hours divided by MESL (9110 images) 0.445
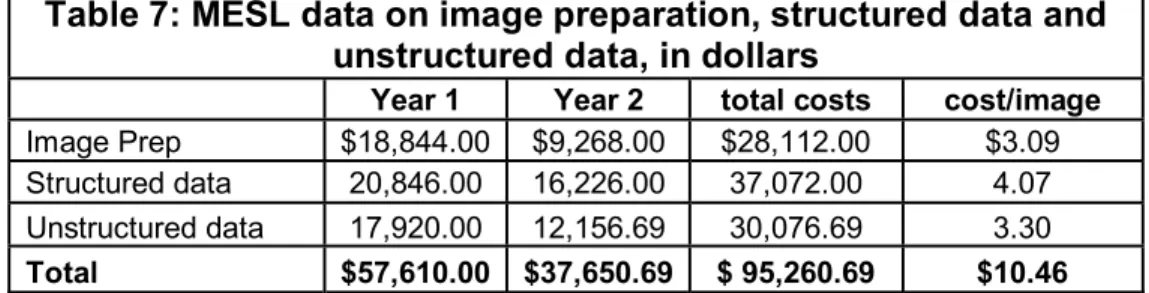
The dollar cost of this labor is somewhat difficult to quantify using MESL figures,
since the report makes it clear that labor costs per hour varied widely. The report does give average personnel costs per cost center, which can be used as
follows:
Table 7: MESL data on image preparation, structured data and unstructured data, in dollars
Year 1 Year 2 total costs cost/image Image Prep $18,844.00 $9,268.00 $28,112.00 $3.09 Structured data 20,846.00 16,226.00 37,072.00 4.07 Unstructured data 17,920.00 12,156.69 30,076.69 3.30
Total $57,610.00 $37,650.69 $ 95,260.69 $10.46
The $10.46 per item cost is certainly way above what Ingram has found to be its own unit cost. However, the Besser and Yamashita findings describe a
groundbreaking project that was being implemented at seven different
existed. Whereas MoA4 describes production, Besser and Yamashita describe development.
Estimating Ingram Project Costs Using the HEDS Matrix of Potential Cost Factors
The cost factor matrix of the British Higher Education Digitisation Service is organized by type of material (such as unbound A4 sheets or glass plates). Of
the choices, the photo prints most closely matched the publication covers Ingram uses. Each of the cost factors comes with a description and advice on changing
it up or down; in this case, there was by the HEDS definition no use of automated processing, low resource costs (since the Ingram project used off-the
shelf-computers and scanners) and medium “optimization costs” in this case cleaning
or enhancing an occasional image to correct speckling, scratches in the cover, etc. The reader is then given a price range and encouraged to modify it. The
filesizes are high, but at Ingram, unlike at HEDS, the larger files present no additional time or expense in the actual digital production process. Since the range for photo prints is 2.72 to $10.91 per item in US dollars using the
Table 8: Using the HEDS Matrix of Potential Cost Factors
HEDS Ingram project
Material Photo Prints 5" x 4" (Colour) Book covers (color)
Typical Specification 600 dpi 24 - bit colour 600 dpi 24 - bit color Preparation Time Medium Medium
Handling High High Automated Processing Yes No
Skills/Experience Rating High High Optimisation Costs High Medium Resource Costs Medium High Low
QA Costs High High
Filesizes High Medium
Overall Ratings Higher Higher Cost per item in dollars at
1.818 dollars per pound UK $2.72 to 10.91
Derived from "HEDS Matrix of Potential Cost Factors"
While this HEDS estimate was in fact well above the actual Ingram cost, the matrix provides an excellent view of factors to consider. Like the Erpanet Cost
Evaluating the Models’ Predictions in Light of Ingram Data
Here is how well the models predicted Ingram actual costs:
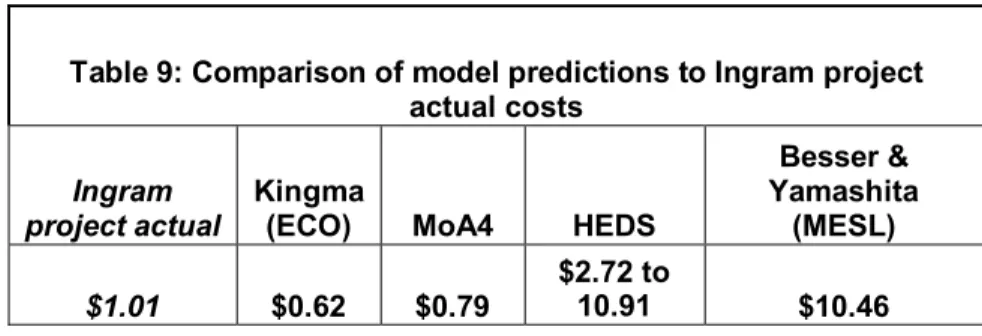
Table 9: Comparison of model predictions to Ingram project actual costs
Ingram project actual
Kingma
(ECO) MoA4 HEDS
Besser & Yamashita
(MESL)
$1.01 $0.62 $0.79 $2.72 to 10.91 $10.46
Clearly MoA4 was closest, as was expected. At $0.79/item, it missed the Ingram $1.01 by 21.8%. The Kingma/ECO model underestimated by 38.6%. However,
the ECO project used OCR but had no other metadata creation step broken out. Of the $1.01 Ingram cost, about $0.13 was for changes to metadata; omitting that brings the cost to $0.88, which brings the Kingma estimate within 29%. If the
ECO labor rates had been known, it is quite conceivable that Kingma could have been closer to Ingram findings than is shown here. The HEDS matrix provides a
range, rather than a figure. Reading the directions accompanying the matrix (reprinted in Appendix C), it is evident that while the estimated range (“Higher”) is a correct use of the tool, there is plenty of room for interpretation that would bring
an estimate into a lower category. As noted above, the Besser & Yamashita model was helpful but was evidently loaded heavily with development costs. In
sum, although the estimate created using each model individually seemed
Developing a Costing Tool
The estimates above illustrate why costing literature is so sought after and yet so
Table 10: Cost Factors for Each of the Four Cost Models and the Ingram Project
Kingma/ECO HEDS MESL MoA4 Ingram project
Digitization OCR Salaries Equipment & supplies Construction, utilities and maintenance Typical Specification Preparation Time Handling Automated Processing Skills/Experience Rating Optimisation Costs Resource Costs Quality Assurance Costs File sizes Overall Ratings Image Prep Structured data Unstructured data Content Selection Image Transmission Data Transmission Retrieve Charge Out Collate Remove covers Pack Shipping QC and page level metadata creation costs OCR and SGML generation Scanning Process management Number of items retrieved per labor hour by imaging staff Number of items returned per labor hour by imaging staff
seems that the following list would include all of the steps listed in the models for planning through finished production:
Production Plan Select
Acquire equipment Train
Retrieve materials Prepare, conserve Pack
Ship
Scan/convert images OCR
Create/edit metadata
Quality control / cleaning images Quality control / cleaning metadata Transmit electronic files
Conserve/rebind wrap materials Return materials
Process management
Administration Facilities costs
Administrative overhead Licensing and rights
These would be applicable even if some of them were outsourced, and indeed every model listed had at least some outsourcing work done (even Ingram, if
work done by warehouse operations is considered outsourcing.) Part of the problem with using these models stems from the use of outsourcing, but this
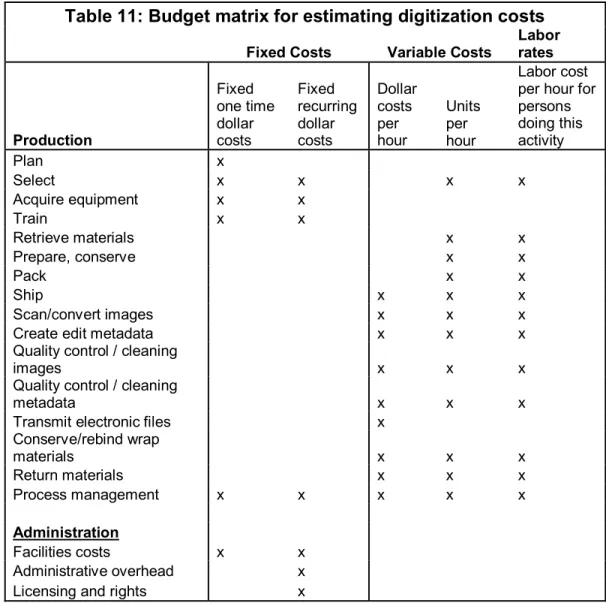
The following matrix would have solved all of the above difficulties as well as being useful for planning and costing. Cost centers run down the first column;
reading across indicates an “X” where a value should be filled in. Some costs are fixed one time, such as a purchase; some are fixed recurring, such as rent or
software licenses. Other costs are variable, i.e., they are expressed as rates. Production work is usually measured this way: fifty scans per hour, ten minutes to pack a box. If a labor rate can be assigned to the person doing this activity,
the picture becomes complete. Units can be compared, and true costs known.
Table 11: Budget matrix for estimating digitization costs
Fixed Costs Variable Costs Labor rates
Production Fixed one time dollar costs Fixed recurring dollar costs Dollar costs per hour Units per hour Labor cost per hour for persons doing this activity
Plan x
Select x x x x
Acquire equipment x x
Train x x
Retrieve materials x x Prepare, conserve x x
Pack x x
Ship x x x
Scan/convert images x x x Create edit metadata x x x Quality control / cleaning
images x x x
Quality control / cleaning
metadata x x x
Transmit electronic files x Conserve/rebind wrap
materials x x x
Return materials x x x Process management x x x x x
Administration
Facilities costs x x
The value of such an approach is twofold. First, as has been shown, cost figures from another project rarely contain all this information; applying it in this manner
can at least reveal some of the assumptions of the authors. (MoA4, for example, never actually stated its labor rates; but they were available to anyone who did
the arithmetic.) Second, when obtaining and comparing bids from outsourcers, such an approach helps compare bids and to realize what costs are truly being shifted to the outsourcer.
Using a costing tool helps to not only gather data but to clarify thinking. The
erpaTool, although it contains no cost data of its own, is an excellent method for rapidly identifying and planning steps that affect costs (and effectiveness) of a project into the future. The costing tool developed here was based on the useful
Conclusion
The value of any set of costing literature lies in being able to apply it in one’s own
situation. The question motivating this research was, can a costing tool be created from elements of leading existing models that can predict costs of a
particular digital preservation project within 20%? Certainly, had Ingram had
such a tool it would have ignored some of the higher cost estimates, such as the rates above $10/page for MESL. It would also, though, have been better able to
predict that its costs would be somewhat higher than those of MoA4 and the ECO project, both of which were ongoing production processes that seemed to
best fit Ingram’s test project. While the MoA4 estimate was reasonably close, coming within 22%, its mix of cost factors was considerably different from that Ingram’s.
This research had sought to locate enough cost factors that were comparable
across models, and that also had enough detailed actual cost information in comparable units, to be able to mathematically synthesize a formal cost model. Such a model would have allowed a reader to see that cost factor x had been
shown in these models to have an average cost of y; the reader could have used that cost as a working estimate in planning and in getting bids for outsourcing.
Unfortunately, the available models are not comparable enough and specific enough to make such a combined formal model possible. Even a cost factor such as digitization, which was common to all the models and to the Ingram
digitization carried an average of y cost (in time and dollars) and to then use those values to load a costing tool with preset values.
The research did show how using multiple models for cost predictions yielded a
more complete cost picture than using any one (in this case, MoA4) by itself. Using multiple models not only prepared the project for variance from the MoA4 figures, but also clarified differences in cost factors between Ingram and MoA4
(notably handling and metadata). Each model contributed some cost data, but also awareness and presentation of particular cost factors. Drawing these
factors together into a costing tool was clearly a logical related task of the research.
The resulting tool does provide a common ground for users of all the other models. It is evident that the costing tool above, when filled in with certain rates
such as labor and production output, could predict the costs of a new project to a higher degree of accuracy than the existing models individually. When predicting one’s own costs, some things are known: labor rates, most of the fixed costs, and
even equipment costs. Some other rates are hardest to estimate, rates for retrieving or scanning. These may have to be determined by tests and pilot
projects, as they were at Ingram. Without the guidance of published models and costing tools, though, one might not have known to have even included them in estimates. Using such tools helps build the data that eventually result in
Bibliography
Besser, Howard and Robert Yamashita. (1998). Executive Summary. In The Cost of Digital Image Distribution: the Social and Economic Implications of the
Production, Distribution and Usage of Image Data. Berkeley, CA:
University of California.
Besser, Howard and Robert Yamashita. (1998). The Cost of Deploying Digital
Images by Universities. In The Cost of Digital Image Distribution: the Social and Economic Implications of the Production, Distribution and
Usage of Image Data. Berkeley, CA: University of California.
Besser, Howard and Robert Yamashita. (1998). The Cost of Creating Digital Images and Metadata by Museums. In The Cost of Digital Image
Distribution. Berkeley, CA: University of California.
Besser, H. (1999). Digital Image Distribution: a Study of Costs and Uses. D-Lib
Magazine, 5(10).
Bonn, Maria. (2001). Benchmarking Conversion Costs: a Report from the Making of America IV Project. RLG Diginews, 5(5).
ERPANET. (2003). Cost Orientation Tool.
http://www.erpanet.org/www/products/tools/ERPANETCostingTool.pdf.
Higher Education Digitisation Service (2002). The HEDS Matrix of Potential Cost Factors. http://heds.herts.ac.uk/resources/matrix.html
Kansas State Historical Society. Digital Imaging Guidelines for State Agencies.
http://www.kshs.org/government/records/electronic/digitalimagingguidelines.htm Kenney, Anne and Oya Rieger (2000). Moving Theory Into Practice: Digital
Imaging for Libraries and Archives. Mountain View, CA: Research
Libraries Group.
Kingma, Bruce R. (1999). The Economics of Digital Access: The Early
Canadiana Online Project. Albany, NY: State University of New York.
Kingma, Bruce R. (2000). The Costs of Print, Fiche and Digital Access: the Early
Canadiana Online Project. D-Lib Magazine, 6(2).
Lee, Stuart D. Decision Matrix for Proposed Digitization Projects Bodleian Library, University of Oxford.
http://www.bodley.ox.ac.uk/scoping/matrix.pdf
Lavoie, Brian. F. (2004). Implementing Metadata in Digital Preservation Systems.
D-Lib Magazine, 10(4).
LaVoie, Brian and Lorcan Dempsey (2004) Thirteen Ways of Looking at…Digital Preservation. D-Lib Magazine10(7/8).
Litzer, Don and Andy Barnett (2004). Local History in E-Books and on the Web. Reference User Services Quarterly 43(3), 248-257.
McGill, Tami. M. (2004). Rapid Implementation of a Large-scale Text Digitization Project: Colorado State University Libraries' Experience. Colorado
Libraries, 30(1), 29 - 31.
NINCH. (2003). Sustainability: Models for Long-Term Funding. In NINCH Guide
to Good Practice. http://www.nyu.edu/its/humanities/ninchguide/
NINCH. (2003). The Price of Digitization: New Cost Models for Cultural and Educational Institutions. Papers presented at the NINCH Symposium,
New York. http://www.ninch.org/forum/price.report.html
Ohio Electronic Records Committee (2003). Digital Document Imaging.
http://www.ohiojunction.net/erc/imagingrevision/revisedimaging2003.html
Puglia, Steven (1999). The Costs of Digital Imaging Projects. RLG DigiNews 3(5).
Puglia, Steven (2003) Overview: Analog vs. Digital for Preservation Reformatting. National Archives and Records Administration
www.archives.gov/preservation/conferences/papers_2003/puglia.html Sanett, Shelby (2002). Toward Developing a Framework of Cost Elements for
Preserving Authentic Electronic Records into Perpetuity. College and
Research Libraries, 63(5), 388-404.
Sanett, Shelby (2003). The Cost to Preserve Authentic Electronic Records in
Perpetuity: Comparing Costs Across Cost Models and Cost Frameworks. RLG Diginews, 7(4).
United States National Park Service (200). “Managing Digital Projects for
http://www.cr.nps.gov/museum/publications/conserveogram/19-22.pdf University of Michigan Digital Library Services.(2001). Assessing the Costs of
Conversion: a Handbook Created for the Andrew W. Mellon Foundation. 1-32.
The test project at Ingram Book Company was set up in consultation with Ingram bibliographic managers and imaging staff after reviewing the literature on
digitization costing. The project was designed to discover the cost of a process
to collect images and metadata for a particular class of publications. Data collected included the time it took the Ingram imaging specialists to scan and
produce an archival-quality color image (usually of a book’s front cover) and also review and edit between fifteen and twenty metadata elements for each item using a basic set of rules and a controlled vocabulary. Test collections of
publications, all of the correct class, were loaded on book carts and moved to within a few feet of the imaging staff’s work spaces. After some experimentation
and time spent getting familiar with the process, it seemed that a test batch of fifty items was a good size, because it would probably take at least an hour and usually rather more. During the experiment, imaging staff were asked to take a
batch of fifty items at a time and have them so close to their work areas that handling was not a significant issue. They were then to note how many they
started with, completed, and how many minutes it took to complete the batch. They tried to work continuously on the batch, but if they needed a break or were interrupted they accounted for it. If more than an hour went by and they had not
completed fifty items, but absolutely needed to break off the test, they were welcome to, as long as they indicated how many they had done. (In fact, they
Tests were designed with the full input of the imaging staff. Using test batches of fifty or more items and one or more hours reduced the effects of variation among
scanning and processing times for individual items. Larger test batches were considered but not used for two reasons. First, as with the MoA4 project and
numerous others, the staff could not realistically devote itself full time to the project. They could well allocate a few hours at a time, but not an entire shift. Second, while the staff seemed quite able to devote a continuous hour to the
process, asking more was risking some inaccuracy. As noted in other reports, employees are human beings, and after a certain amount of time will lose
concentration, need to use the restroom, or go for coffee or a cigarette. The purpose of the measurement was to determine a “real world” production rate that could be sustained over the long term.
Later in the project, some additional questions were added to the log sheets, to
determine two additional factors in production rate.
First, it emerged that where an item took an unusually long time, it stemmed from one of a few metadata fields: contributor, series or imprint. Second, the
metadata were collected on a computer screen, developed for the purpose, running in a mainframe environment that was shared with some other heavy
users. During certain times, peak use from these other departments could slow the system response time to the point that the imaging staff were literally sitting around waiting for the screen to refresh. The screen was modified to require
as date, in hopes of being able to isolate system refresh time as an exogenous variable. For this paper, some data that was clearly badly affected by system
response time (as shown by unusual deviation from the norm but also reported in no uncertain terms by the staff member) was discarded.
In addition to this production labor, other costs were identified and measured, notably handling costs. Some of these are not actually billed to the bibliographic
department, but were measured and included nonetheless because they are an important consideration in deciding how to implement future projects. Test
collections of publications were developed and ordered, then picked from the shelves by warehouse staff and delivered to a location in the front of the warehouse, where they were repacked by imaging staff onto carts and rolled
approximately 450 feet to the imaging center. Once scanned and reviewed, these same books had to be replaced on carts and rolled to the farthest end of a
vast warehouse complex, then checked in and reshelved by warehouse staff. The cost in time of imaging staff in retrieving and returning materials was estimated by the staff themselves; cost of the work done by warehouse
Appendix B: Research Setting at Ingram Book Company
Ingram Book Company is the largest trade book wholesaler in the world. In addition to distributing books and other publications, it has several closely related
units offering a host of services to libraries, booksellers, online vendors and other wholesalers. The department hosting this study is charged with collecting,
creating and processing bibliographic information and related rich content and
metadata. The resulting databases are used internally or sold, or are shared with such partners as OCLC (Online Computer Library Center) or Amazon.com. All
databases have grown rapidly in recent years as Ingram has expanded its scope and mission.
Images are an important part of the information mix. At Ingram, the main image archive now holds over 1 million TIFF image masters. About 200,000 were
added just last year; currently 4,000 – 8,000 are added each week. Almost all of the images in the main archive are scans or digital photographs of the front covers of books or other publications. Ingram’s goal is to have at least one
archival quality cover image for every title it receives. Aside from covers, Ingram’s next largest imaging project consists of scanning every page of nearly
every printed catalog it receives from publishers and other suppliers, and then keying related bibliographic information. This catalog work is currently
outsourced; the scanning is done in nearby Nashville, while the resulting page