This research is intended to develop evidence for whether or not large organizations should spend a large amount of time and resources on building Business Intelligence Frameworks by examining Project Manager’s perceptions of complex information systems. Project Managers in a large organization provide a cross functional reporting role that requires them to delve into information technology systems in complex ways when querying for simple metrics related to projects they manage. Using an online survey, this study found that project manager’s perceptions changed more positively towards IT systems performing automatic queries, web based queries, IT systems, and business intelligence system dashboards if they did not already have a business
intelligence framework in place, and if they were less experienced. More experienced project managers had lower perceptions of current IT systems, automatic queries, web-based queries, and dashboards. There is evidence to suggest that business intelligence frameworks will be positively perceived for project managers with lower experience, and where these systems have not already been introduced.
Headings:
by Robert E. Pitts
A Master’s paper submitted to the faculty of the School of Information and Library Science of the University of North Carolina at Chapel Hill
in partial fulfillment of the requirements for the degree of Master of Science in
Information Science.
Chapel Hill, North Carolina November 2006
Approved by
Introduction... 2
Background... 3
Methods... 12
Sample and Population ... 14
Subject Identification and Recruitment ... 14
Variables and Measurement Techniques... 15
Data Collection Instruments and Materials ... 16
Ethical Issues ... 16
Importance ... 18
Data Analysis ... 18
Results and Analysis ... 21
Conclusions ... 27
Works Cited... 30
Appendix A: Survey Instrument ... 36
Demographics ... 36
Metrics Reporting ... 37
IT Complexity & Datasources ... 38
Display Visualization Requirements & Existing Framework... 39
Introduction
Business intelligence is the gathering of large amounts of corporate data and using data concentration or information distillation techniques to provide a framework to
answer wide ranging queries that cross database systems and delve into a corporate organization’s information technology structure in complex ways. The business
intelligence framework simplifies the querying process for a variety of data seekers in an organization. A dashboard is an interface into this framework, coalescing data and providing real-time answers to specified pre-formatted queries.
may span multiple database systems, multiple aggregate levels of data and then return individual datasets that will have to be combined by hand. A Business Intelligence Framework will allow for an easier interface and less querying for project managers, while still getting the KPI data query sets returned on a per project basis.
The purpose of this research is to answer a few specific questions: Does the number of data-sources alter the perception of the ability of project managers to retrieve the key performance indicators of their project? Does the presence of dashboards or pre-configured queries alter the project manager perceptions of the task of finding key
performance indicators? Do perceptions of complex information system querying change in relation to the project manager’s experience?
Background
Business intelligence (BI) is the gathering of large amounts of corporate data in order to provide a framework for answering a wide range of queries. These queries can cross multiple data sources and delve into an organization’s information technology (IT) infrastructure in complex ways. This type of framework is very much on the minds of the IT industry today (Halevy 778-787) (Sunopsis 2). The BI framework simplifies the querying process for a variety of data seekers in an organization. Data seekers include project managers with responsibility for cross functional reporting and who use multiple data systems to coalesce information on a project that that may involve different
functional areas of an organization. This cross functional or matrix operation is becoming increasingly prevalent in the organizational context (Wind 872).
than cross matrix management. A dashboard is a real-time interface into a business intelligence framework, and as such, provides the project manager with the necessary efficiencies to gather information related to his or her most frequent queries and reporting dilemmas, the reporting of project metrics also known as “Key Performance Indicators (KPI)” (Combined Standards Glossary 34).
In order to explore these ideas, this study includes a needs analysis that directly answers the questions: Does the number of data-sources alter the ability of project
managers to retrieve the key performance indicators for their projects? Does the presence of dashboards or pre-configured queries alter perception of the task of finding key
performance indicators by project managers? Do project manager perceptions of how to query complex information systems change as a function of length of experience?
The main thrust of the research questions revolve around Business Intelligence Frameworks, dashboards and real-time decision making systems. The Business
Intelligence Framework will need to be fully defined and well documented to ensure that this is not merely a current, popular term, but an area of legitimate academic research. As a real-time data visualization technique for returned query results and an interface into the business intelligence framework, the dashboard will be defined and will be related to previous research. After reviewing the literature in relation to the research questions, this review will describe the methodology of research selection for the works cited, and try to synthesize the current body of knowledge in the areas.
Bus” that is interfaced by the “Business Performance Management” system. Bieberstein relates these IT systems to the organizational structures inherent in many organizations (696-697). People in complex IT environments need proactive help to discover useful resources and a way to easily format and display the results to limit information overload (Billsus 166). There is evidence that the integration of complex IT infrastructures into a logical framework will “provide IT users with ease of use, consistency, and uniformity” (Chung 38). In looking at autonomous agents, Hamdi is simplifying the data source locating process for users: “…a person is able to state what he/she wants (or at least is able to recognize what he/she wants when he/she sees it), and the IC system1 is
responsible for deciding which resources to invoke in response and how to do so” (Hamdi 244). The attempt is made in this research to show that complex IT systems and users need some logical structure defined for them rather than the user performing the logic themselves. Whether this is Hamdi’s “information customization” (232) decentralized system or Bieberstein’s centralized “service oriented architecture” (691) the theme here is clear. IT architecture has become complex and users need an interface and some
secondary logical framework to help point out where data sources and data reside. Another complexity for IT concerns the requirement to align to strategic business objectives (Motjolopane, 147). Kettinger and Sabherwal point out that there is a direct link between IT strategy and business organization capability, though in Sabherwal’s case it was only for the business strategies of analyzers2 and prospectors3, not defenders4
1
Hamdi defines an IC system system as “software that acts, in accordance with a user’s preferences, in an environment” and that has the characteristics: distributed, adaptive, autonomous and robust (232).
2
An analyzer is a business that “seeks to simultaneously minimize risk while maximizing opportunities for growth” by maintaining a “stable domain of core products while seeking new product/market
opportunities” (Sabherwal, 14).
3
(Kettinger, 50; Sabherwal, 11). The literature suggests that there is a need to analyze the impact of IT projects and measure specific indicators of impact in a framework,
sometimes this analysis view is called a “dashboard” (van der Zee, 60, 78). Van der Zee describes this dashboard as:
“…consisting of the appropriate measures to indicate strengths and weaknesses, provides a guide for management and forms the core of planning and control. A dashboard of performance indicators allows management to valuate the contribution of several factors that impact the overall performance of the organization.”
This dashboard can be an IT system, a web page, a static report, a software application or any other methodology that, on a frequently updated basis, displays and simplifies values for previously identified key performance indicators.
Project management is a methodological approach to managing a temporary endeavor, and has been developed in several industries over the past few years to become a formal model that is intrinsic to an organization’s success (Brewer 167, Ahituv 99, Combined Standards Glossary 46). Project managers combine tools, knowledge, skills, and techniques to meet the needs of an organization when working on managing
particular projects (Combined Standards Glossary 46, 47). One very important responsibility of project managers is the reporting of “status” on particular projects, which can include many metrics, and an extensive synthesized data set visualized into a form that is used for communication to all project stakeholders (Shumate 41-44). Lack of formality or replication can put projects and therefore business strategies at serious risk (Mizuno 392). Also, distribution of resources, geographically and functionally can
4
impact the ability of project managers to coordinate those resources and put more pressure on the project and project management processes (Qureshi 72-73).
The more mature and formalized a project management process is, the more likely it is to succeed (Grant K 66, Williford 209). The project management methodology is a logical step-by-step process, similar to the Capability Maturity Model (Grant K 59). A framework that allows for the measurement of project metrics integrated within an existing project management methodology, such as the one presented by Paul (256), will provide a project manager with a tool necessary to easily retrieve metrics and answer complex queries (Paul, Table10, 258). Project management is a technique that has been developed over the last two to three decades (Paul, Qureshi, Grant, Mizuno, Fenton 359). This technique involves specific skills, one being the communication and tracking of metrics (Brewer Figure 1 169).
One type of visualization technique for these metrics programs is called the “balanced score card” (Berler 116, Debusk 216). This is a dashboard of metrics that are all tied to the same overall subject matter, being the health of a particular organizational unit or the unit itself. In Berler’s example, this is a health informatics issue in measuring the quality of healthcare systems.
“Business Intelligence Tools and Data Warehouses enable the decision maker to have predefined access to specific information of interest regardless of the physical location of the data. Such systems are ideal for performance management and executive reporting and serve as the technological base for supporting the idea of a digital dashboard of indicators” (Berler 120).
Marcus provides another anecdotal example that is descriptive of the issues IT people and managers have in traversing the IT landscape with and without dashboards (48).
The Business Intelligence Framework literature is very sparse and contradictory. Most articles do not define the framework as one related to “business intelligence” but more show examples or reference it in a general sense (Raffo 803-809). Mendonca seems to have the best technical view of what this framework is and does, using the Goal-Question-Metric paradigm (485) to develop a methodological approach of how to define this framework for ongoing measures (496). The industry and trade literature, while not great academic work, does give insight into what a “business intelligence framework” would look like (Doering 9-10, Hannon 56). Figure 1 of Golfarelli’s Business
Performance Management, or BPM, clearly defines the case for the Business Intelligence Framework (2) and he goes on to show in Figure 2 a complete framework developed to support dashboards and other tools (4).
Figure 1 (Golfarelli 2) Figure 2 (Golfarelli 4)
metrics systems and IT complexity that define data integration as being something that helps businesses, projects and organizations succeed.
Given that the Business Intelligence Framework seems so ill defined, it is interesting to find that the dashboard, an interface into this system, has been extensively researched and defined, even in direct terms of a “project management dashboard” (Bresnan 33). Design of the dashboard and visualization of the data seems to be more of an issue in the literature (Grant A 235, Nahirny 175) and for trade publications (Few 4, Shen-Hsieh 6) than the querying of the data to present in the dashboard. Weber
introduces the idea of “live documents” and states that these documents “require an authoring framework that frees the author from any implementation tasks” (245) which shows a very good parallel to a project manager using a dashboard within a pre-defined framework. Kret seems to have the best list of “reasons” as to why a dashboard would be used as opposed to standardized reports (59) and his research shows how a dashboard would fit into an IT architecture as a support system interface (Kret 61). Mille uses a similar design for an example dashboard in his architecture (Mille S817) and gives a reasonable definition: “We name dashboard a window containing views where each one represents any kind of information (variables, images, texts, video, ties between
dashboards)” (Mille S817).
reflected in other real time system literature (Azvine 214-224, Nguyen 79 Figure 1). Many other types of real time systems exhibit many of the same requirements of these dashboards, which is the integration of multiple data sources and systems through a logical framework that contains pre-defined queries (Tesanovic 41, Warren 201 Table 1). The real time systems literature provides a good basis for stating that the dashboard’s interface is one of the better interfaces into a complex system of pre-defined operational, decision support and data warehouse IT systems.
It is apparent that there have been few, if any, needs analysis done on dashboards or frameworks. The literature seems to come at this from the opposite direction, where dashboards were written to provide an interface into a business intelligence system that had already been defined. The trade literature is more appropriately focusing on the need of the users. This research is intended to demonstration that that a business intelligence framework is worth the large amount of resources needed to develop and maintain it in the chosen context of the metrics system framework for project management.
The research question stated in the introduction links nicely with the literature in most areas. There is a wide body of research to help support choosing project managers as subjects for the needs analysis. Difficulties in executing queries in the complex IT environment without some pre-defined framework provide rationale to query the subjects on their ability to find data sources and return information on the metrics they are
apparent from the literature the reader has a very hard time concretely visualizing what one of these frameworks looks like from a user’s perspective, so the metric system questions will be focused more on the reporting interfaces, such as power point, excel or web pages, when discussing dashboards.
Methods
The research questions laid out in the preceding sections of this paper point to the use of a survey as the prime method for gathering project managers’ perceptions on the metrics querying process and the business intelligence framework. This survey will be crafted to examine several key concepts.
The first concept, and a major variable of the project, is the project manager’s experience. A demographic section of the survey was used to determine the level of respondent’s experience. One way to view experience is years in a particular industry. This variable points to a certain type or set of data sources used to report project status or metrics. Another way to view experience is in a particular position where the respondent will determine themselves to be a project manager. This may point to a tacit information framework that is built by the project manager, that the respondent can transport from job to job and cross industries. Yet another way is to review the time in the current position. This will enable an analysis on whether more or less experience with a particular
organizations set of IT infrastructures is a factor in their perception of that infrastructure, regardless of other experiences.
be querying for status reports to management personnel outside of project, such as direct line managers of the project manager or executives higher in the respondent’s
organization. Another facet will be internal project metrics that the project manager will use to manage projects. Along both of these facets, related questions examine concepts of metrics reporting frequency, and how the reports are required to be delivered. Information systems should be reviewed as a small part of these delivery systems.
Another concept is the perception of IT complexity and the number of data sources required for metric querying. Questions on these perceptions relate to a respondent’s experience with data sources like software applications, and databases. There are a variety of ways to ask these questions to determine respondents’ positive or negative perceptions of whether the information infrastructure that is currently available to them is making it more difficult to query for metrics. Thus, we infer that the
complexity and number of data sources may be required to either be simplified or left unchanged depending upon the data analysis.
The two final sections of the survey revolve around existing business intelligence frameworks and data visualizations requirements, and then explore “what if” scenarios that use Likert type (Babbie, 169) scales to determine project managers’ perceptions of dashboards and other systems in their current environment. Questions on visualization allowed the analysis of data surrounding the project manager’s experience and interaction with information technology systems which are required by the organization, and
project manager enters the metrics into a balanced score card type of application on a website, it likely indicates an existing business intelligence framework.
Sample and Population
The total population of project managers within North Carolina is unknown and will be difficult to determine statistically. A simpler population figure is the number of project managers that are registered within an industry trade group. For project
management, one such trade group is the Project Management Institute (PMI, 1). Within this large industry trade group, there is a self selected subset of groups, one of which is the North Carolina special interest group (NCPMI, 1). The special interest group is a subset of Project Management Institute members who also register as being in the state of North Carolina. This is the ideal population within which to draw a sample. This sample is a small subset of the population of all North Carolina based project managers, but provided a relatively representative, non-industry specific cross section of those North Carolina based project managers.
Subject Identification and Recruitment
Each member of the NCPMI is required to register with an email address in order to get information related to membership as well as other personalized communications from the chapter. The researcher requested and received permission from the VP of Membership and the VP of Communication the ability to send the study related,
Variables and Measurement Techniques
One major variable to be deduced from the research questions previously
described is the one of project manager experience. This is measured as a ratio variable (Babbie, 447) to look at number of years of experience. The survey questions come at this from several directions, including industry experience, current position experience, and project management experience. Several questions revolving around nominal variables were used to determine demographic facts about a subject, particularly
certifications achieved that point to a knowledge or experience achievement. This allows for an easy grouping of data if it is found that there is any validity to the certification process as being a differentiator within the data along with experience.
Along with this variable is the metrics and reporting requirements topics that were assessed. Survey questions regarding these topics were also ratio-based, aside from a few yes/no questions that were based on nominal variables. Again, these nominal variables will enable easy grouping and segregation but the ratio variables are of more use to the data analysis. Variables here are frequency of metrics reporting, maximum projects managed at the same time, and total number of metrics, which are all ratio variables.
The existence of a business intelligence framework is another variable that was difficult to query directly. Since the definition of the business intelligence framework is difficult to communicate, it was necessary to ask a series of nominal questions with yes or no answers to try to determine if such a framework exists within the subject’s
Further clarification of the responders’ perceptions of dashboards and other real-time querying systems was achieved through the use of a series of Likert (Babbie, 169) type scales that develop data for ordinal variables. These include questions and data on what if scenarios such as what if a “dashboard exists” or if “IT systems provided answers to you instead of you looking for the answer”. These variables are all related to the need of a project manager to report these metrics frequently and to people other than
themselves such as management.
Data Collection Instruments and Materials
SurveyMonkey.com was used to deploy the 64 question survey (Appendix A). The survey was administered online, and available to any respondent with a personal computer, internet connection and browser, which includes the population in question. SurveyMonkey.com allows the data to be collected and exported once the survey has been completed. Emails were used to send communications to the population, of which one hundred percent have email addresses, so that no bias is introduced by the researcher having any other contact with the respondents. This enabled the respondent to use their own equipment, their own emailing and Internet related software systems, and not unduly inconvenience the respondent by making the process more time consuming than
necessary. This enabled ease of use of the survey and emailed communications.
Ethical Issues
dataset nor accessed by the researcher. Email addresses are not known by the researcher, but were handled through a third party intermediary (NCPMI) and therefore cannot be used to identify respondents or the sample population. Individual’s employment
organizations are not queried nor retained. The survey is completely voluntary, and none of the questions within the survey are required to be answered in order to progress
through to the end of the survey.
No harm, physically or intellectually will come to any of the respondents or the population, however a series of five emails over the course of two months on the survey may frustrate non-participants and participants who responded to the survey early in the study period. No deceptive questioning or data analysis occurred in the process of this study.
Study Method Advantages and Disadvantages
Advantages of the survey revolve around having the flexibility to ask a large number and type of questions to a large number of people. Also, the ability to standardize questions across all project managers, regardless of industry, projects, business or job title will enable the researcher to analyze the data in aggregate on self reported project managers and cuts to the heart of the research questions, which are based on the perception of these project managers (Babbie, 274).
Importance
This topic is important to study because it will provide evidence either for building a case that a business intelligence framework is required to simplify the querying process for project managers in complex organizations, or that the
administrative and technical overhead involved is not worth the extensive resources such a system would require. Detailed knowledge of perceptions surrounding metric gathering and the complexity of the data-source landscape will allow knowledge workers who build and customize business intelligence frameworks and dashboards to better tailor their products to the relevant parties such as project managers. Database designers would be interested as the systems will need to interface with a business intelligence framework in order to inform the relevant project managers without having the project manager
explicitly query the database. This research informs strategic management, project management, process engineering, and general business studies.
Data Analysis
relate to demographics, questions 6 and 8 through 11 relate to Metrics complexity, questions 7 and 12 through 14 relate to Standards, questions 15 through 17 relate to IT Complexity, questions 18 through 27 relate to IT perceptions, questions 28 through 34 relate to the existence of an IT systems framework, questions 35 through 42 relate to perceptions of web pages automating the querying process, questions 43 through 53 relate to perceptions of a dashboard automating the querying process, and questions 54 through 64 relate to perceptions of a generic IT system automating the querying process. All logical yes or no responses are assigned a value of 1 for yes and 2 for no. To
Variable Name Formula
1 Experience Rating Sum of questions 1 through 4
2 Industry Certification Yes = 1, No = 2
3 Metrics Complexity Rating Product of Question 6, Question 8,
and the Median of Question 9, 10 and 11
4 Implied Framework Existence Likelihood Average of: Question 7 and
If Question 12 is Yes then.5, If Question 12 is No then 4 and If Question 13 is Yes then .5, If Question 13 is No then 4 and If Question 14 is Yes then .25, If Question 14 is No then 8
5 Number of Data-sources Rating Sum of Question 15, 16 and 17
6 Perception of Current IT Systems 1 Average of:
Questions 19, 21, 23, and 26
7 Perception of Current IT Systems 2 Average of:
Questions 18, 20, 22, 24, 25 and 27 8 Business Intelligence Framework Existence
Likelihood
Average of:
Questions 28 through 34 9 Perception of a Web Page Performing Automated
Queries 1
Average of:
Questions 35, 37, 39, and 41 10 Perception of a Web Page Performing Automated
Queries 2
Average of:
Questions 36, 38, 40 and 42 11 Perception of a Dashboard Performing Automated
Queries 1
Average of:
Questions 43, 46, 48, 50, 52 12 Perception of a Dashboard Performing Automated
Queries 2
Average of:
Questions 44, 45, 47, 49, 51, and 53 13 Perception of Generic IT System Performing
Automated Queries 1
Average of:
Questions 54, 57, 59, 61 and 63 14 Perception of Generic IT System Performing
Automated Queries 2
Average of:
Questions 55, 56, 58, 60, 62 and 64
Table 1: Variable Set Creation for Data Analysis
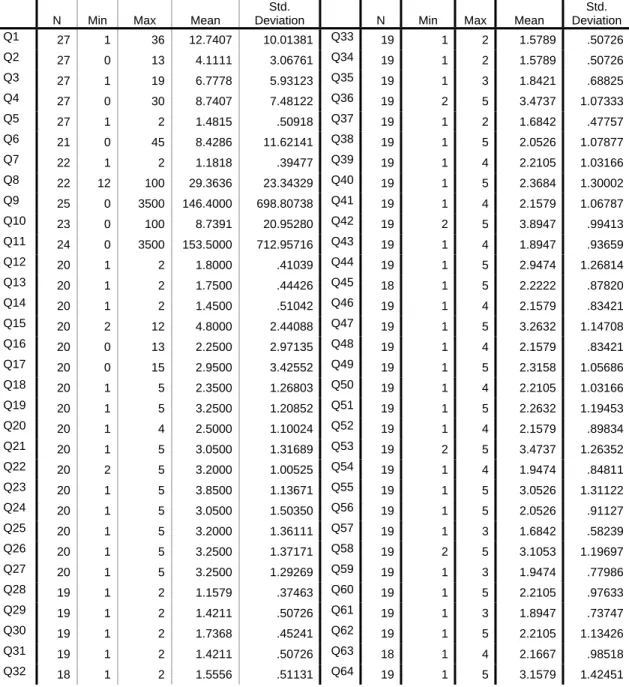
Results and Analysis
N Min Max Mean
Std.
Deviation N Min Max Mean
Std. Deviation
Q1 27 1 36 12.7407 10.01381 Q33 19 1 2 1.5789 .50726
Q2 27 0 13 4.1111 3.06761 Q34 19 1 2 1.5789 .50726
Q3 27 1 19 6.7778 5.93123 Q35 19 1 3 1.8421 .68825
Q4 27 0 30 8.7407 7.48122 Q36 19 2 5 3.4737 1.07333
Q5 27 1 2 1.4815 .50918 Q37 19 1 2 1.6842 .47757
Q6 21 0 45 8.4286 11.62141 Q38 19 1 5 2.0526 1.07877
Q7 22 1 2 1.1818 .39477 Q39 19 1 4 2.2105 1.03166
Q8 22 12 100 29.3636 23.34329 Q40 19 1 5 2.3684 1.30002
Q9 25 0 3500 146.4000 698.80738 Q41 19 1 4 2.1579 1.06787
Q10 23 0 100 8.7391 20.95280 Q42 19 2 5 3.8947 .99413
Q11 24 0 3500 153.5000 712.95716 Q43 19 1 4 1.8947 .93659
Q12 20 1 2 1.8000 .41039 Q44 19 1 5 2.9474 1.26814
Q13 20 1 2 1.7500 .44426 Q45 18 1 5 2.2222 .87820
Q14 20 1 2 1.4500 .51042 Q46 19 1 4 2.1579 .83421
Q15 20 2 12 4.8000 2.44088 Q47 19 1 5 3.2632 1.14708
Q16 20 0 13 2.2500 2.97135 Q48 19 1 4 2.1579 .83421
Q17 20 0 15 2.9500 3.42552 Q49 19 1 5 2.3158 1.05686
Q18 20 1 5 2.3500 1.26803 Q50 19 1 4 2.2105 1.03166
Q19 20 1 5 3.2500 1.20852 Q51 19 1 5 2.2632 1.19453
Q20 20 1 4 2.5000 1.10024 Q52 19 1 4 2.1579 .89834
Q21 20 1 5 3.0500 1.31689 Q53 19 2 5 3.4737 1.26352
Q22 20 2 5 3.2000 1.00525 Q54 19 1 4 1.9474 .84811
Q23 20 1 5 3.8500 1.13671 Q55 19 1 5 3.0526 1.31122
Q24 20 1 5 3.0500 1.50350 Q56 19 1 5 2.0526 .91127
Q25 20 1 5 3.2000 1.36111 Q57 19 1 3 1.6842 .58239
Q26 20 1 5 3.2500 1.37171 Q58 19 2 5 3.1053 1.19697
Q27 20 1 5 3.2500 1.29269 Q59 19 1 3 1.9474 .77986
Q28 19 1 2 1.1579 .37463 Q60 19 1 5 2.2105 .97633
Q29 19 1 2 1.4211 .50726 Q61 19 1 3 1.8947 .73747
Q30 19 1 2 1.7368 .45241 Q62 19 1 5 2.2105 1.13426
Q31 19 1 2 1.4211 .50726 Q63 18 1 4 2.1667 .98518
Q32 18 1 2 1.5556 .51131 Q64 19 1 5 3.1579 1.42451
Table 2: Descriptive Statistics for response set by Question.
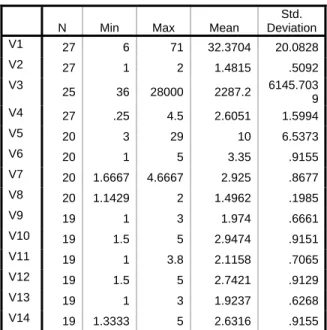
N Min Max Mean
Std. Deviation
V1 27 6 71 32.3704 20.0828
V2 27 1 2 1.4815 .5092
V3
25 36 28000 2287.2 6145.703
9
V4 27 .25 4.5 2.6051 1.5994
V5 20 3 29 10 6.5373
V6 20 1 5 3.35 .9155
V7 20 1.6667 4.6667 2.925 .8677
V8 20 1.1429 2 1.4962 .1985
V9 19 1 3 1.974 .6661
V10 19 1.5 5 2.9474 .9151
V11 19 1 3.8 2.1158 .7065
V12 19 1.5 5 2.7421 .9129
V13 19 1 3 1.9237 .6268
V14 19 1.3333 5 2.6316 .9155
Table 3: Descriptive statistics for variable set.
A paired samples two tailed t-test was conducted for each of the variables related to the first research question, does the number of data-sources alter the perception of the ability of project managers to query. Data-source number rating was explicitly measured in variable 5 (Table 1), metric complexity was measured in variable 3 and perceptions were measured in variables 6, 7, 9, 10, 11, 12, 13 and 14 (Table 1).
V5 mean Std. Dev. Mean Rating Std.
Dev. Sig.
Corr. Direction
V6 10 6.54 3.35 .92 p<.025* negative
V7 10 6.54 2.93 .87 p<.025* positive
V9 10.37 6.5 1.97 .67 p<.025* positive V10 10.37 6.5 2.95 .92 p<.025* positive V11 10.37 6.5 2.12 .71 p<.025* positive V12 10.37 6.5 2.74 .91 p<.025* positive V13 10.37 6.5 1.92 .63 p<.025* positive V14 10.37 6.5 2.63 .92 p<.025* positive
Table 4: Paired samples two tailed t-test for V5
V3 mean Std. Dev.
Mean Rating
Std.
Dev. Sig.
Corr. Direction
V6 2256.60 6156.17 3.35 .92 p>.025 n/a
V7 2256.60 6156.17 2.93 .87 p>.025 n/a
V9 2375.37 6301.28 1.97 .67 p>.025 n/a
V10 2375.37 6301.28 2.95 .92 p>.025 n/a
V11 2375.37 6301.28 2.12 .71 p>.025 n/a
V12 2375.37 6301.28 2.74 .91 p>.025 n/a
V13 2375.37 6301.28 1.92 .63 p>.025 n/a
V14 2375.37 6301.28 2.63 .92 p>.025 n/a
Table 5: Paired samples two tailed t-test for V3
The data suggest that perceptions of IT systems and querying change depending on the number of data-sources, but do not change depending on how complex the metric queries are for those data sources. There is a very large range and standard deviation for metric complexity, implying that this may have been a confusing set of questions or that there are significant data errors from the respondents. The correlations from data-source number variable 5 and perception variables suggest that respondents were positive toward IT systems as the number of data-sources increased.
V4 mean Std. Dev. Mean Rating Std. Dev. Sig.
Corr. Direction
V6 2.84 .33 3.35 .92 p>.025 n/a
V7 2.84 .33 2.93 .87 p>.025 n/a
V9 2.75 1.46 1.97 .67 p>.025 n/a
V10 2.75 1.46 2.95 .92 p>.025 n/a V11 2.75 1.46 2.12 .71 p>.025 n/a V12 2.75 1.46 2.74 .91 p>.025 n/a V13 2.75 1.46 1.92 .63 p>.025 n/a V14 2.75 1.46 2.63 .92 p>.025 n/a
Table 6: Paired samples two tailed t-test for V4
V8 mean Std. Dev. Mean Rating Std.
Dev. Sig.
Corr. Direction V6 1.50 .20 3.30 .90 p<.025* positive V7 1.50 .20 2.95 .89 p<.025* positive V9 1.50 .20 1.97 .67 p<.025* negative V10 1.50 .20 2.95 .92 p<.025* negative V11 1.50 .20 2.12 .71 p<.025* negative V12 1.50 .20 2.74 .91 p<.025* negative V13 1.50 .20 1.92 .63 p<.025* negative V14 1.50 .20 2.63 .92 p<.025* negative
Table 7: Paired samples two tailed t-test for V8
Significant tests in Table 7 suggest that perceptions change when an explicit IT framework has been built for a project manager. We can infer from Table 7, variable 6 and 7 tests, that when an explicit framework is more likely to exist, a respondent is more likely to agree with the stated questions. Tests on variables 9 through 14 imply that if an existing framework is more likely to occur, a project manager is more likely to disagree with the stated questions. This suggests that respondents without existing IT frameworks are more unsatisfied with their IT systems, and are more likely to want an IT framework to perform queries for them. The data also suggests the opposite, that project managers with IT frameworks have lower perceptions of the framework to perform queries for them.
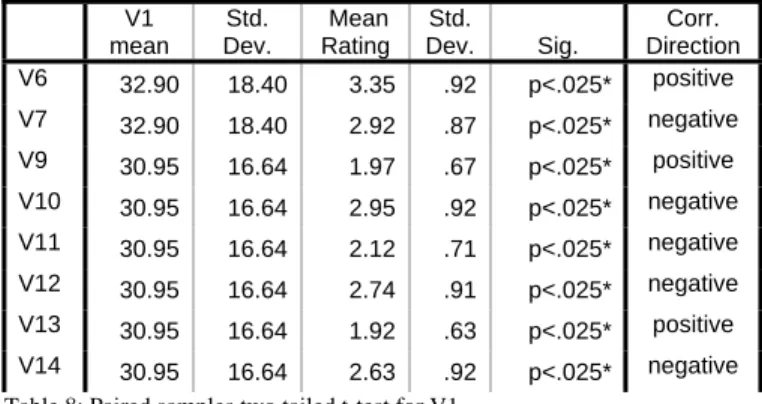
change as a function of length of experience. Total experience was rated in variable 1, industry certification was measured in variable 2 and perceptions were measured in variables 6, 7, 9, 10, 11, 12, 13 and 14 (Table 1).
V1 mean Std. Dev. Mean Rating Std.
Dev. Sig.
Corr. Direction V6 32.90 18.40 3.35 .92 p<.025* positive V7 32.90 18.40 2.92 .87 p<.025* negative V9 30.95 16.64 1.97 .67 p<.025* positive V10 30.95 16.64 2.95 .92 p<.025* negative V11 30.95 16.64 2.12 .71 p<.025* negative V12 30.95 16.64 2.74 .91 p<.025* negative V13 30.95 16.64 1.92 .63 p<.025* positive V14 30.95 16.64 2.63 .92 p<.025* negative
Table 8: Paired samples two tailed t-test for V1
V2 mean Std. Dev. Mean Rating Std.
Dev. Sig.
Corr. Direction
V6 1.55 .51 3.35 .92 p<.025* negative
V7 1.55 .51 2.93 .87 p<.025* negative
V9 1.53 .51 1.97 .67 p>.025 n/a
V10 1.53 .51 2.95 .92 p<.025* positive V11 1.53 .51 2.12 .71 p<.025* negative V12 1.53 .51 2.74 .91 p<.025* negative
V13 1.53 .51 1.92 .63 p>.025 n/a
V14 1.53 .51 2.63 .92 p<.025* negative
Table 9: Paired samples two tailed t-test for V2
Table 8 tests suggest that perceptions change depending upon the experience of a project manager. The evidence also suggests that as a respondent’s experience increases, their IT perceptions decrease. The opposite is true as well, that as a respondent’s
worded dashboard perceptions and negatively worded dashboard perceptions. This suggests that possible confusion over the dashboard term could have affected responses.
Conclusions
This research found that there are significant relationships between project manager’s perceptions of IT systems, perceptions of automatically generated queries from web, dashboard and generic information systems, and the project manager’s experience, explicit existence of a business intelligence framework, and number of reported data sources. Metrics complexity, and the existence of an implicit business intelligence framework do not affect project manager’s perceptions. Also, there is inconclusive evidence that an industry certification, assumed to be a mark of experience and training in implicit project management frameworks, has any relationship to a project manager’s perceptions of querying or automatically generated queries.
The two most related factors in a project manager’s perception of IT systems used for querying, are the project manager’s experience, and the total IT complexity ratio they report. The more experienced a project manager is, and the more likely they are to already have an explicit business intelligence framework in place, the lower their
of time spent on a querying and the number of data-sources they will have to use to get the required key performance indicators.
It is obvious to this researcher that more thorough research will be needed regarding the link between a project manager’s experience in a particular information system, and their ability to delegate querying to an information system framework. The 27 respondents gathered for this research is a very limited sample of the large number of project managers in the population. While this population is not known, it can be assumed that 27 is a very small proportion, and therefore this sample could be biased. It is possible that project managers, especially when highly experienced, would be too busy to respond to a web survey. Also, while this research does provide evidence for having an explicit business intelligence framework, it should also be obvious that this is a very difficult concept to market to project managers in a way that will explain the benefits. It has been noted that this research is based on a small sample set of 27 respondents, some of whom did not fill out the entire survey, creating an additional possible bias to the sample.
Based on this research, there is evidence that for inexperienced project managers, or project managers that do not have a business intelligence framework already available to them, an effort to provide these tools would be perceived positively. Also, for
Works Cited
Adam, F. & Pomeral, J.-C. Critical Factors in the Development of Executive Systems- Leveraging the Dashboard Approach. In G. A. Forgionne, J. N. D. Gupta & M. Mora (Eds.), Decision Making Support Systems: Achievements, Trends and Challenges for the New Decade, Hershey, PA: Idea Group Publishing. 2003. 305-330.
Ahituv, N., Zviran, M., and Glezer, C. 1999. Top management toolbox for managing corporate IT. Commun. ACM 42, 4 (Apr. 1999). 93-99.
Azvine, B.; Z. Cui; D. D. Nauck. Towards real-time business intelligence. BT Technology Journal. London: Jul 2005.Vol.23, Iss. 3; 214.
Babbie, Earl. The Practice of Social Research. Belmont, CA: Thompson Wadsworth, 2004.
Ben-Menachem, M. and Gelbard, R. 2002. Integrated IT management tool kit. Commun. ACM 45, 4 (Apr. 2002). 96-102.
Berler, A., Pavlopoulos, S., & Koutsouris, D. Key Performance Indicators and
Information Flow: The Cornerstones of Effective Knowledge Management for Managed Care. In B. Bali, Clinical Knowledge Management: Opportunities and Challenges. Hershey, PA: Idea Group Publishing. 2005. 116-138.
Biddison, Peggy. Integrating corporate real estate financial reporting into a single systems solution. Journal of Corporate Real Estate. London: Apr 2005. Vol. 7, Iss. 2; 164.
Bieberstein, N.; S Bose, L Walker, A Lynch. Impact of service-oriented architecture on enterprise systems, organizational structures, and individuals. IBM Systems Journal. Armonk: 2005. Vol.44, Iss. 4; 691-709.
Billsus, D., Hilbert, D. M., and Maynes-Aminzade, D. 2005. Improving proactive information systems. In Proceedings of the 10th international Conference on intelligent User interfaces (San Diego, California, USA, January 10 - 13, 2005). IUI '05. ACM Press, New York, NY, 159-166.
Brewer, J. L. 2005. Project managers: can we make them or just make them better?. In Proceedings of the 6th Conference on information Technology Education
(Newark, NJ, USA, October 20 - 22, 2005). SIGITE '05. ACM Press, New York, NY. 167-173.
Chung, S. H., Byrd, T. A., Lewis, B. R., and Ford, F. N. 2005. An empirical study of the relationships between IT infrastructure flexibility, mass customization, and business performance. SIGMIS Database 36, 3 (Aug. 2005). 26-44.
Debusk, Gerald K., Robert M. Brown, and Larry N. Killough. Components and relative weights in utilization of dashboard measurement systems like the Balanced Scorecard. The British Accounting Review, Volume 35, Issue 3, September 2003. 215-231.
Doering, Matt. A Practical Guide: Managing Business Intelligence (BI) and Data
Warehouse Deployments with Actionable Usage Metrics. Appfluent Technology. Fenstermaker, S., George, D., Kahng, A. B., Mantik, S., and Thielges, B. 2000.
METRICS: a system architecture for design process optimization. In Proceedings of the 37th Conference on Design Automation (Los Angeles, California, United States, June 05 - 09, 2000). DAC '00. ACM Press, New York, NY, 705-710. Fenton, N. E. and Neil, M. 2000. Software metrics: roadmap. In Proceedings of the
Conference on the Future of Software Engineering (Limerick, Ireland, June 04 - 11, 2000). ICSE '00. ACM Press, New York, NY, 357-370.
Few, Stephen. Common Pitfalls in Dashboard Design. 8 Feb. 2006. Proclarity. 26 Apr. 2006.
http://www.proclarity.com/files/whitepapers/Common_Pitfalls_in_Dashboard_De sign.pdf.
Fraunholz, B. Enhancing Project Management as an Instrument for Costing and Controlling in Small- and Medium-Sized Enterprises. Technologies &
Methodologies for Evaluating Information Technology in Business. 2003; IRM Press 190-206.
Frolick, Mark N; Thilini R Ariyachandra.Business Performance Management: One Truth. Information Systems Management. Boston: Winter 2006. Vol. 23, Iss. 1; 41.
Grant, Andrew; Andriy Moshyk, Hassan Diab, Philippe Caron, Fabien de Lorenzi, Guy Bisson, Line Menard, Richard Lefebvre, Patricia Gauthier, Richard Grondin and Michel Desautels. Integrating feedback from a clinical data warehouse into practice organization. International Journal of Medical Informatics, Volume 75, Issues 3-4, March-April 2006. 232-239.
Grant, K.P.; Pennypacker, J.S.; Project management maturity: an assessment of project management capabilities among and between selected industries. Engineering Management, IEEE Transactions on Volume 53, Issue 1, Feb. 2006. 59–68.
Gumbus, Andra. Introducing the Balanced Scorecard: Creating Metrics to Measure Performance. Journal of Management Education. Thousand Oaks: Aug 2005.Vol.29, Iss. 4; 617-631.
Halachmi; Arie. Performance measurement is only one way of managing performance. International Journal of Productivity and Performance Management. Bradford: 2005.Vol.54, Iss. 7; 502-517.
Halevy, A. Y., Ashish, N., Bitton, D., Carey, M., Draper, D., Pollock, J., Rosenthal, A., and Sikka, V. 2005. Enterprise information integration: successes, challenges and controversies. In Proceedings of the 2005 ACM SIGMOD international
Conference on Management of Data (Baltimore, Maryland, June 14 - 16, 2005). SIGMOD '05. ACM Press, New York, NY. 778-787.
Hall, Tracy; Fenton, Norman. Implementing Effective Software Metrics Programs, IEEE Software. Vol 14, Issue 2, Mar/Apr 1997. pp 55-65.
Hamdi, M.S. Extracting and Customizing Information Using Multi-Agents. In A. Scime, Web Mining: Applications and Techniques. Hershey, PA: Idea Group Publishing. 2005. 228-252.
Hannon, Neal J. Making Data the Center of Your Information System. Strategic Finance. Montvale: Oct 2005.Vol.87, Iss. 4; 55-58.
Herbsleb, J. D. and Grinter, R. E. Conceptual simplicity meets organizational complexity: case study of a corporate metrics program. In Proceedings of the 20th
international Conference on Software Engineering (Kyoto, Japan, April 19 - 25, 1998). International Conference on Software Engineering. IEEE Computer Society, Washington, DC, 271-280.
Kautz, Karlheinz. Making Sense of Measurements for Small Organizations. IEEE Software. Vol. 16, Issue 2, March/April 1999. 14–20.
Kret, M. A. 1987. An information workstation for software managers. In Proceedings of the Second ACM SIGSOFT/SIGPLAN Software Engineering Symposium on Practical Software Development Environments (Palo Alto, California, United States, December 09 - 11, 1986). P. Henderson, Ed. SDE 2. ACM Press, New York, NY. 59-69.
Marcus, Aaron. Dashboards in your future. Interactions. New York: Jan/Feb 2006. Vol. 13, Iss.1; 48.
Mehta, Maneesh. Future signals: How successful growing companies stay on course. Ivey Business Journal Online. London: Nov/Dec 2005. 1.
Mendonca, Manoel G.; Basili, Victor R. Validation of an Approach for Improving Existing Measurement Frameworks. IEEE Transactions on Software Engineering. Vol. 26, Issue 6, June 2000. 484 – 499.
Mille, A; J. M. Chartres, E. Niel, B. Fuchs and B. Chiron. Intelligent workstation for immediate decision helping in process supervision: A new paradigm? Computers & Chemical Engineering, Volume 19, Supplement 1, 11 June-14 June 1995. 815-820.
Mizuno, O., Kikuno, T., Takagi, Y., and Sakamoto, K. 2000. Characterization of risky projects based on project managers' evaluation. In Proceedings of the 22nd international Conference on Software Engineering (Limerick, Ireland, June 04 - 11, 2000). ICSE '00. ACM Press, New York, NY. 387-395.
Motjolopane, I. and Brown, I. 2004. Strategic business-IT alignment, and factors of influence: a case study in a public tertiary education institution. In Proceedings of the 2004 Annual Research Conference of the South African institute of Computer Scientists and information Technologists on IT Research in Developing Countries (Stellenbosch, Western Cape, South Africa, October 04 - 06, 2004). G. Marsden, P. Kotze, and A. Adesina-Ojo, Eds. ACM International Conference Proceeding Series, vol. 75. South African Institute for Computer Scientists and Information Technologists. 147-156.
Nahirny, M. J. Christian. Creating a customized quality dashboard for a blood and marrow transplant (BMT) program. Biology of Blood and Marrow
Transplantation, Volume 12, Issue 2, Supplement 1, February 2006. 172.
Nguyen, T. M., Schiefer, J., and Tjoa, A. M. 2005. Sense & response service architecture (SARESA): an approach towards a real-time business intelligence solution and its use for a fraud detection application. In Proceedings of the 8th ACM international Workshop on Data Warehousing and OLAP (Bremen, Germany, November 04 - 05, 2005). DOLAP '05. ACM Press, New York, NY. 77-86.
O'Rourke, Morgan. Scaling the Heights of ERM. Risk Management. New York: Dec 2005.Vol.52, Iss. 12; pgs. 18-23.
Owen, J. Integrating Knowledge Management with Programme Management.
International Journal of Knowledge Management, Vol. 2, Issue 1, 2006; 41-57. Paul, R.A.; Kunii, T.L.; Shinagawa, Y.; Khan, M.F.. Software metrics knowledge and
databases for project management. Knowledge and Data Engineering, IEEE Transactions on Knowledge and Data Engineering. Volume 11, Issue 1, Jan.-Feb. 1999. 255 – 264.
Pfleeger, Shari Lawrence. Lessons Learned in Building a Corporate Metrics Program. IEEE Software. Vol. 10, Issue 3, May 1993. 64 – 74.
Project Management Institute. Combined Standards Glossary. 2005. <http://www.pmi.org>.
PMI. Project Management Institute. 2005. <http://www.pmi.org>.
Qureshi, Sajda, Min Liu, Doug Vogel, The Effects of Electronic Collaboration in Distributed Project Management, Group Decision and Negotiation, Volume 15, Issue 1, Jan 2006. 55–75.
Raffo, D. M., Harrison, W., and Vandeville, J. 2002. Software process decision support: making process tradeoffs using a hybrid metrics, modeling and utility framework. In Proceedings of the 14th international Conference on Software Engineering and Knowledge Engineering (Ischia, Italy, July 15 - 19, 2002). SEKE '02, vol. 27. ACM Press, New York, NY, 803-809.
Sabherwal, R. and Chan, Y. E. 2001. Alignment Between Business and IS Strategies: A Study of Prospectors, Analyzers, and Defenders. Info. Sys. Research, 12, 1 (Mar. 2001). 11-33.
Shen-Hsieh, A. and Schindl, M. 2002. Data visualization for strategic decision making. In Case Studies of the CHI2002|AIGA Experience Design FORUM (Minneapolis, Minnesota, April 20 - 21, 2002). CHI '02. ACM Press, New York, NY. 1-17. Shumate, K. and Snyder, T. 1994. Software project reporting: management,
Sumner, M. 2000. Risk factors in enterprise wide information management systems projects. In Proceedings of the 2000 ACM SIGCPR Conference on Computer Personnel Research (Chicago, Illinois, United States). SIGCPR '00. ACM Press, New York, NY, 180-187.
Sunopsis. SQL Is the DNA of Data Movement. 8 Feb. 2006.
<http://download.101com.com/pub/TDWI/Files/SQL_is_the_DNA_of_Data_Mo vement.pdf>.
SurveyMonkey.com. Powerful tool for creating web surveys. Online survey software made easy! 2006. <http://www.surveymonkey.com>.
Tesanovic, Aleksandra; Mehdi Amirijoo; Mikael Björk; Jörgen Hansson. Empowering configurable QoS management in real-time systems. Proceedings of the 4th international conference on Aspect-oriented software development AOSD '05. ACM Press. March 2005.
van der Zee, H.. Measures of the Business Value of IT. Measuring the Value of
Information Technology (pp. 60-79), Hershey, PA: Idea Group Publishing. 2002. 60-79.
Walsh, Paul. Dumbing down performance measures. Measuring Business Excellence. Bradford: 2005.Vol.9, Iss. 4; 37-46.
Warren, G., Nolte, R., Funk, K., and Merrell, B. 2004. Network simulation enhancing network management in real-time. ACM Trans. Model. Comput. Simul. 14, 2 (Apr. 2004), 196-210.
Weber, A., Kienle, H. M., and Müller, H. A. 2002. Live documents with contextual, data- driven information components. In Proceedings of the 20th Annual international Conference on Computer Documentation (Toronto, Ontario, Canada, October 20 - 23, 2002). SIGDOC '02. ACM Press, New York, NY. 236-247.
Weller, Edward F. Using Metrics to Manage Software Projects. Computer. Vol. 27. Issue 9, September 1994. 27–33.
Williford, Judson; Andrew Chang. Modeling the FedEx IT division: a system dynamics approach to strategic IT planning. Journal of Systems and Software, Volume 46, Issues 2-3, 15 April 1999. 203-211.
Appendix A: Survey Instrument
Demographics
Question Response Type
Q1. Please enter the TOTAL NUMBER OF YEARS you have worked WITHIN YOUR CURRENT INDUSTRY. (Please round to the nearest year)
Numerical Only
Q2. Enter the TOTAL NUMBER OF YEARS you have worked IN YOUR CURRENT POSITION. (Please round to the nearest year)
Numerical Only
Q3. Enter the TOTAL NUMBER OF YEARS you have worked IN YOUR CURRENT COMPANY. (Please round to the nearest year)
Numerical Only
Q4. Please enter the TOTAL NUMBER OF YEARS you have worked AS A PROJECT MANAGER regardless of industry or company. (Please round to the nearest year)
Numerical Only
Q5. Do you have any PROJECT MANAGEMENT industry
CERTIFICATION? (Example: “Project Management
Professional” or “PMP”)
Metrics Reporting
Question Response Type
Instruction: All questions below relate to your current industry and your current
position.
In terms of this survey, a “metric” is synonymous with a quantitative Key Performance Indicator which is defined by the Project Management Institute’s Combined Standards Glossary (page 38) as:
“A Key Performance Indicator (KPI) is a criterion by which an organization can determine, quantitatively or qualitatively, whether the Outcome associated with a Capability exists or the degree to which it exists. A Key Performance Indicator can be a direct measurement or an expert assessment.
When a Key Performance Indicator is quantitative, involving direct measurement, a form of metric is required. A metric is a measurement of something. Something tangible such as an error count, can be measured directly and objectively.
Something intangible, such as customer satisfaction, must first be made tangible, -- for example, through a survey resulting in ratings on a scale – before it can be measured. A metric can be binary (something exists or does not exist), it can be more complex (such as scaled rating) or it can be monetary (such as financial returns).”
Q6. Enter the MAXIMUM NUMBER OF PROJECTS you have managed AT THE SAME TIME.
Numerical Only
Q7. Does your current management require you to REPORT
PROJECT STATUS or METRICS?
Logical (Y/N)
Q8. Enter the NUMBER OF TIMES PER YEAR you are required to report a project status TO YOUR
MANAGEMENT. (Example: Weekly = 52 times per year, Monthly = 12 times per year).
Numerical Only
required to report on PER PROJECT.
Q10. Please enter the MAXIMUM NUMBER OF METRICS
you report to your management FORANY ONE PROJECT.
Numerical Only
Q11. Please enter the TOTAL NUMBER OF METRICS you use to manage a SINGLE PROJECT FOR YOUR OWN PURPOSES. (This number can include metrics reported to management).
Numerical Only
Q12. Are metrics calculations standard for all projects you have managed company wide?
Logical (Y/N)
Q13. To your knowledge are metrics calculations standard for all project managers company wide?
Logical (Y/N)
Q14. Do you have a project support office that provides any templates or metrics reporting frameworks to you?
Logical (Y/N)
IT Complexity & Datasources
Question Response Type
Instruction: All questions below relate to your current industry and your current
position
Q15. Please enter the NUMBER OF SOFTWARE
APPLICATIONS that you use to MANAGE YOUR PROJECT. (Please include any software such as Excel, Access, Industry or Company specific applications)
Numerical Only
only for PROJECT MANAGEMENT.
Q17. Enter the NUMBER OF INFORMATION SYSTEMS you access for REPORTING.
Numerical Only
Likert type scale (Babbie, 169)
Anchors: Strongly Agree, Somewhat Agree, Neutral, Somewhat Disagree, Strongly Disagree
My current company’s IT systems are:
Q18. Difficult to query for metrics 1..5
Q19. Logically arranged to report information based on my project
1..5
Q20. Not setup for project managers 1..5
Q21. Helpful to me to report my metrics 1..5 Q22. Too difficult for non-IT personnel to use 1..5 Q23. Providing information to me without me asking for it. 1..5 Q24. Not updated often enough for my projects 1..5 Q25. Often reporting conflicting information 1..5 Q26. Show real-time information about my project 1..5 Q27. Good for what my management wants, but not for what I
need
1..5
Display Visualization Requirements & Existing Framework
Question Response Type
electronic format (such as Power Point presentations, Web Pages, or pdf documents)?
Q29. Do you have company standard templates for all projects and project managers to report project status?
Logical (Y/N)
Q30. Do your metrics become part of a “Balanced Score Card” for the business?
Logical (Y/N)
Q31. Are your past metrics reports accessible to you? Logical (Y/N) Q32. Do you store your reports in your email system? Logical (Y/N) Q33. Do you often have to re-create templates or macros for
your project status reports?
Logical (Y/N)
Q34. Can you customize your reports as much as you think you should be able to for your particular project?
Logical (Y/N)
Leading What If Questions
Question Response Type
Likert type scale (Babbie, 169)
Anchors: Strongly Agree, Somewhat Agree, Neutral, Somewhat Disagree, Strongly Disagree
If you had a WEB PAGE PER PROJECT that DISPLAYED SOME OR ALL of
your metrics TO YOU this would:
Q35. save you time. 1..5
Q36. Cause more problems than it solves. 1..5
Q38. depend upon the metric calculation. 1..5 Q39. be more efficient than your current metrics gathering
processes.
1..5
Q40. depend upon the project complexity. 1..5
Q41. help you manage your budget. 1..5
Q42. give you less control of your project. 1..5
If you had a DASHBOARD PER PROJECT that DISPLAYED SOME OR ALL of
your metrics TO YOUR MANAGEMENT this would:
Q43. enable better communication with management 1..5 Q44. Cause management confusion over the details of your
project
1..5
Q45. depend on the metrics reported 1..5
Q46. save you time. 1..5
Q47. Cause more problems than it solves. 1..5
Q48. be beneficial to you. 1..5
Q49. depend upon the metric calculation. 1..5 Q50. be more efficient than your current metrics gathering
processes.
1..5
Q51. depend upon the project complexity. 1..5
Q52. help you manage your budget. 1..5
Q53. give you less control of your project. 1..5
If your project status reports were reported to you by an IT system rather than you
Q54. enable better communication with management 1..5 Q55. Cause management confusion over the details of your
project
1..5
Q56. depend on the metrics reported 1..5
Q57. save you time. 1..5
Q58. Cause more problems than it solves. 1..5
Q59. be beneficial to you. 1..5
Q60. depend upon the metric calculation. 1..5 Q61. be more efficient than your current metrics gathering
processes.
1..5
Q62. depend upon the project complexity. 1..5
Q63. help you manage your budget. 1..5