ii
ABSTRACT
TIME-DELAYED TREATMENT OF EFFLUENT FOR INTERMITTENT OPERATING FACILITIES USING LOW PRESSURE PIPE TREATMENT
Many facilities—such as weekend camps, retreats, and
churches—operate for only a few days out of the week. The cost
for wastewater treatment is one of the larger cost to these intermittent operating facilities. Given these two factors and possible poor soil conditions at the site, the facility may not be able to acquire a permit for a proper treatment facility or
afford to install a properly-sized treatment system. Given these
iii
TABLE OF CONTENTS
Acknowledgements ... iv
List of Figures ...v
List of Tables ...vii
I. Introduction ... 1
II. Current Technologies ... 8
III. Low Pressure Pipe Systems ... 29
IV. Design and Specifications... 38
V. Calculations ... 50
VI. Installation ... 57
VII. Conclusions ... 61
Appendix I ...Falling Head Percolation Procedure... 64
Appendix II ..Suggested Site Evaluation Procedure... 65
Appendix III .Design and Specifications... 66
Appendix IV ..Maintenance and Operation... 77
Footnotes ... 80
iv
ACKNOWLEDGMENTS
This was the first project of this size that I designed and the input and review of certain people and agencies were
indispensable for completing the project. In particular the
North Carolina Department of Natural Resources and Community Development, Environmental Health Divison were of great
assistance. Steve Steinbeck and Steven Berkowitz were important
in providing comments on previous attempts at designs of this type. If others' previous attempts had not been such failures, I
would not have been sure enough to commit the owners to the
successful design and installation of this system.
Ted Lyons of the Johnston County Department of Environmental
Health participated in the supervision and installation of this system. His input on the job site helped me to appreciate his job as a county sanitarian, which is the final word in the
installation of on-site treatment systems.
The reviewing engineer for this system was Paul Colbert, who
introduced me to the problem at Short Journey Center during class
in the Department of Environmental Science and Engineering. Short Journey Center is operated by the Roman Catholic Diocese of Raleigh. I wish to thank members of the Diocese and the staff at Short Journey Center for giving me this opportunity and allowing me to devise and improvise as needed.
And finally to my wife Bonnie, who every long-term graduate student must have if he is unable to edit or draw a straight
LIST OF FIGURES
page Figure 1. Basic components of a low pressure pipe system 2
(EDAC, 1985)
Figure 2a. Conventional septic tank bed system (EPA, 1980). 3 Figure 2b. Conventional septic tank trench system (EPA, 1980). 4 Figure 3a. Sand filter schematic (EDAC, Inc., 1985). 11 Figure 3b. Cross-section of sand filter bed (EDAC, Inc.,
1985). 12
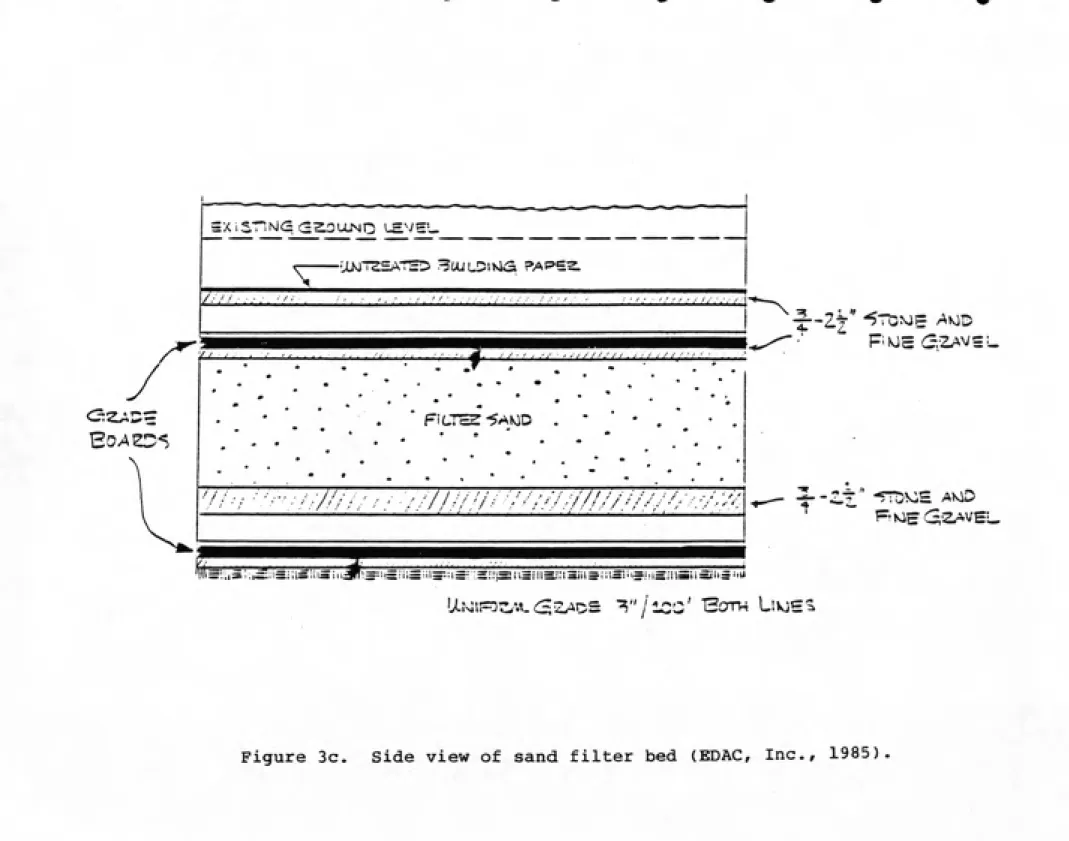
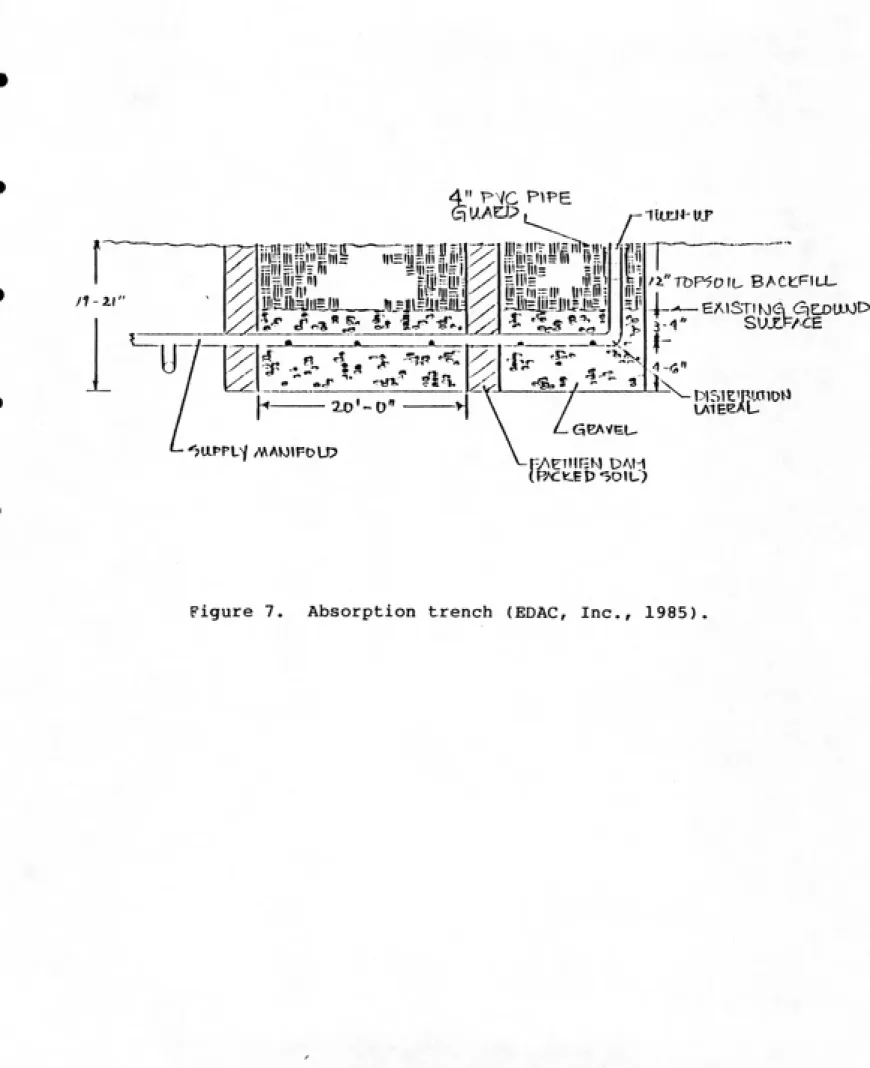
Figure 3c. Side view of sand filter bed (EDAC, Inc., 1985). 13 Figure 4. Chlorinator (EDAC, Inc., 1985). 14 Figure 5. Chlorine contact chamber (EDAC, Inc., 1985). 15 Figure 6. Cascade aerator (EDAC, Inc., 1985). 16 Figure 7. Absorption trench (EDAC, Inc., 1985). 18 Figure 8. Pumping chamber of an LPP system 19
(Revised by EDAC, Inc. from Triangle J)
Figure 9a. Components of a mound system (EPA, 1980). 20 Figure 9b. Mound systems (EPA, 1980). 21 Figure 10. Extended aeration, factory-built sewage treatment 22
plant. Single tank, vertical clarifier, 3,000
-35,000 GPD. (Clow 1985)
Figure 11. Rotating biological contactor (RBC) in tank basin 25
(Clow 1985) .
Figure 12. Flow diagram for an RBC system (Clow 1985). 26 Figure 13. RBC unit, installation below grade (Clow 1985). 27 Figure 14. Trench and pipe diagram for an LPP system 30
(EDAC, Inc., 1985).
Figure 15. Site plan. Short Journey Center (EDAC, Inc., 1985).
39
VI
Figure 16b. System Placement (EDAC, Inc., 1985) 43 Figure 17a. Pipes in trenches, front view (EDAC, Inc., 1985). 44 Figure 17b. Pipes in trenches, side view (EDAC, Inc., 1985). 45 Figure 18. Pumping tanks (EDAC, Inc., 1985). 46 Figure 19. Electrical installation (EDAC, Inc., 1985). 47 Figure 20. Clock and switching diagram (EDAC, Inc., 1985). 48 Figure 21a. Pumping curve for a 6,000 gallon/day flow rate
(EDAC, Inc., 1985). 55
Figure 21b. Pumping curve for a 4,000 gallon/day flow rate
(EDAC, Inc., 1985). 56 Figure 22. Potential evaporation versus mean annual
Vll
LIST OF TABLES
page TABLE 1 Subsurface profiles (EDAC, Inc., 1985) 33 TABLE 2 Maximum loading rates for LPP systems based on soil
INTRODUCTION
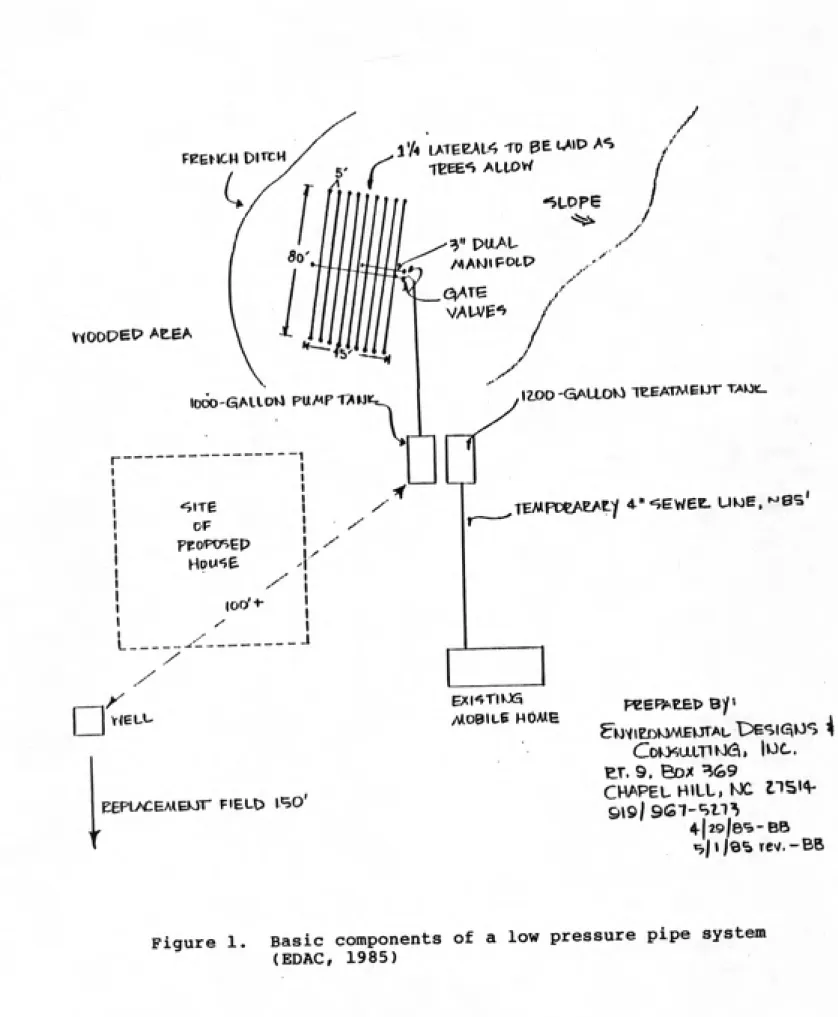
Low Pressure Pipe (LPP) systems have been in use in North Carolina and other states consistently for 10 to 15 years. The LPP system is a network of small-bore pipes laid near the
surface; effluent from a primary treatment tank is pumped
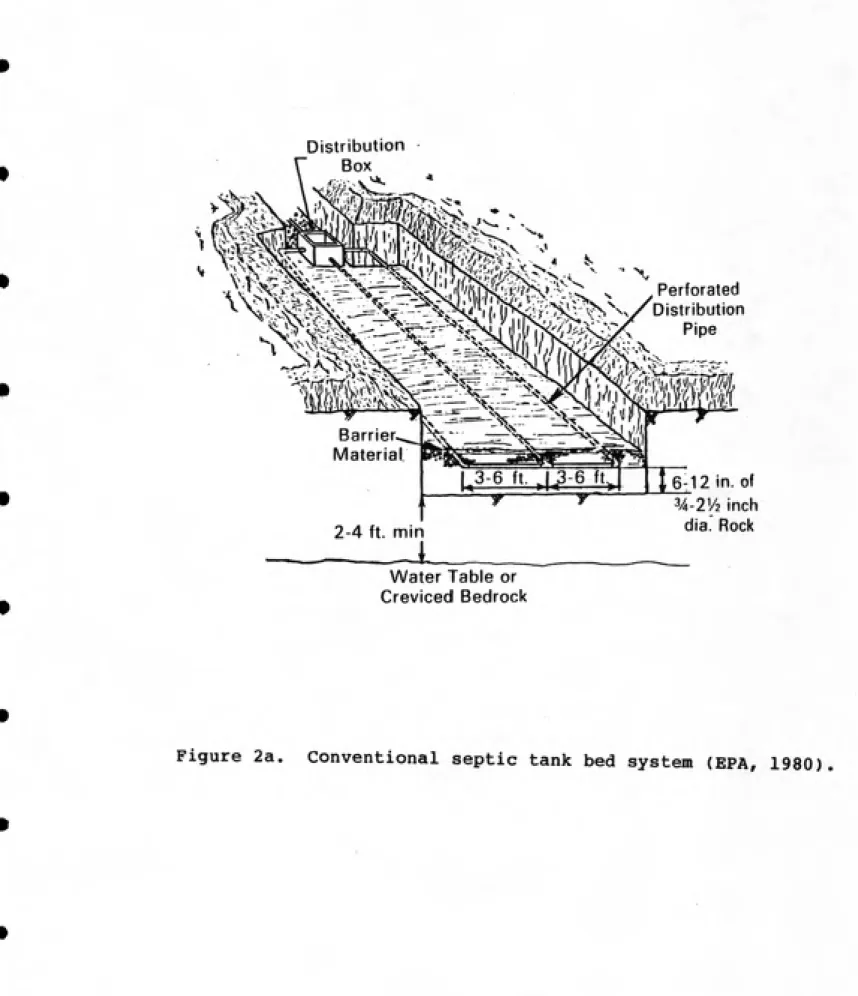
intermittently into these "laterals" (Figure 1). In problem soil areas of North Carolina, the LPP system is being used more and more, displacing the conventional septic system. The soils over most of the Piedmont are not suited to the long-term functioning of conventional septic systems (Figures 2a and 2b) and the LPP system seems to work better in these low-permeability soils.
North Carolina is presently experiencing an extremely rapid growth period. Single dwelling housing starts in North Carolina exceed the national rate by many times and Wake, Durham and
Orange Counties comprise one of the fastest growing area in North
Carolina. Many of these new homes are away from municipal treatment facilities and are dependent on on-site wastewater
treatment. It is estimated that over 25% of all housing units in the U.S. use some sort of on-site wastewater treatment system
(EPA 1980). The conventional septic system is usually suitable, when not, one of the other alternatives is used, such as the LPP systems, mound systems, sand filters, package treatment systems,
and a variety of low-use systems such as spray-irrigating,
FEEMCH DITtH
v^oopep AtEA
C
/
I'A IA1EE^14 TD aeW^tD AS
lOOO-GALloM PU/MPT/^Wlc
r"
'^ITE
of
PPOPOSEP Hou«7E.
loo'-X
"" i
I
t____ __________I
./
y<ELi-^Pl/CEAlEKjr FIELD l^iO'
TEEE'V AUlOW
-stDpe
/
y PUAU
MA^JlPO«'P
ei/ATg
\
/
I2.O0 -(SAaOKi lEEATTVlEUr TAkJil.
TEAipoeAEy^ty 4« -jcwee. utoe. --bs'
/VloBlte HOME peEPAEEP By
Co^KaLͣn^J6• l^c,.
CHAPEt H«LL. K)C nS»^
4-|29|6>p-B8
Figure 1. Basic components of a low pressure pipe system
:W-Distribution
Box
mk>^.,
'-Perforated Distribution
Pipe
Sift
Barrier^
Material.
1^3-6 ft. ,1,3-6 ft.J
—T---r^
'^
2-4 ft. min
e^l 2 in. of 34-2y2 inch
dia. Rock
Water Table or
Creviced Bedrock
Backfill
5^
1-5 ft
Perforated Distribution
Pipe 1-3 ft
Barrier Material
3/4 - 2-16 in. Rock
Water Table or Creviced Bedrock
The major problem in land development in the Research
Triangle area is the consistently poor soils. Many of the sites
that presently have homes and conventional septic systems could
not have been approved as homesites under the new guidelines for
soil evaluations. One project known as The Downs in Durham
County is a good example. The development began in the early
1970's along the lines of a community of "country estates." Lots
were sold in parcels of 3 to 7 acres per single-family dwelling.
Many people bought these lots for about $5,000 an acre expecting
to build when they retired or when their income level allowed
them to build compatible houses. All the lots passed the (now
outdated) "Perk Test" (Appendix 1) and some owners built some
very expensive houses. Because of wholesale failures of older
septic systems in Durham County, the County reevaluated its
testing procedure in the late 1970's. Instead of the old perk
test, the County began to use soil evaluations based on the
expert evaluation of a soil scientist. The study of the soil
in the county took into consideration the type of soils
encountered in areas that were to accept on-site sub-surface
treatment. The study included the soil's physical
characteristics such as clay content, evidence of high water and
topographical location.
The data from the new soil evaluations forced the County to
ban any housing construction on most of the property in The Downs
development. The owners were then holding property that if
an acre; however, under the circumstances, these lots were
worthless .-'ͣ
This scenario repeats regularly in the area known as the
Triangle J (Durham, Wake, Orange, Chatham, Lee, and Johnston
Counties). Pressures from developers and landowners to allow
development are real problems for understaffed and—in some
cases—underqualified health departments. As time passes many of
the developments that were allowed in poor soil areas will have
to be put on community or municipal treatment systems. In the
meantime, development proceeds at a steady pace far in advance of
any county or municipal treatment systems. County health
departments have begun to come to terms with this problem and
have taken corrective action. Instead of halting all
development, Durham County has expanded the construction of a
county sewage system and has begun to depend more on LPP
treatment systems as an alternative to the conventional septic
system.
One of the primary reasons for the success of the LPP system
seems to be the rest period between loadings. This rest period
gives the soil time to treat the effluent before overloading
causes soil failure. Because the effluent is pumped and is
therefore controlled electrically, it is easy to conform a system
to a site regardless of topography and, in addition, the pumping
control allows effluent to be stored for later treatment. This
later aspect allows for reduced treatment space and in some cases
Carolina. This paper points out the advantages of the LPP system
in the low-permeability soils in the Piedmont, cautions
sanitarians and regulatory agencies as to supervising LPP system installation, and outlines the design and installation of such a
II. CURRENT TECHNOLOGIES
There are a number of on-site watewater treatment systems in
use in North Carolina and other states. In order of greatest
use, they are: the conventional septic system, sand filters, low
pressure pipe treatment, package treatment plants, mound systems,
and land treatment systems (such as spray irrigation and open
discharge).
There are approximately 20 million households in the U.S. that use an onsite wastewater treatment system. The following
section presents a description of the systems most widely used
for onsite treatment of residential wastewater.
Conventional Treatment Systems
The conventional septic system (CSS) relies on the
biological activity of anaerobic organisms to digest most of the
solids and similarly the soil's assmilation of the waste is also dependent on microorganisms. Figures 2a and 2b show the
schematic detail of a CSS. This system has been more widely studied than any other system in terms of design, function,
application and failure. The primary reasons for the widespread
use of the CSS are its low cost, reliability and predictibility.
The most commonly-used design utilizes trenches in which
perforated or open-jointed drain lines distribute the supernatant
into a bed of crushed stone from which the liquid moves through
However, the conventional septic system is a system which
will inevitably fail. Successive failure along the system begins
almost immediately until there is no longer enough treatment area in the lines to carry the load; this phenomenon has been referred to as the "creeping failure concept"(Anderson, et al., 1981). The reasons for premature failures of conventional systems
usually stem from a number of factors or events. Under-design for the anticipated load and poor installation techniques account
for most of the failures. Other causes include excessive
discharge of grease and non-biodegradable substances, collapse of the lines by heavy vehicular use over the field, and chemicals that cause destruction of the bacteria and therefore clogging of the lines. One factor believed to be a major cause of failure is that during installation of the systems the machine used to dig
the trenches leaves the side walls and the bottom of the trenches
sealed. This is caused by the pressure of the digging bucket on
the clay soil. It is suggested that the sidewalls and bottom be broken up manually with a shovel or mattock before laying stone
and pipe.
Regardless, this system remains the most widely used of all
single dwelling on-site treatments. Its reliability and
tolerance, despite abuse, make it the most desirable. Yet the
major problem in the coming years, aside from the increase in
failures, may be the contribution of these systems to localized
10
Sand Filters
When soils are incapable of handling any subsurface land treatment process, some sort of discharging system is needed.
For residential treatment of wastewater, the sand filter is the
most common. Primary treatment is achieved in a conventional
treatment tank and the effluent is discharged into a number of
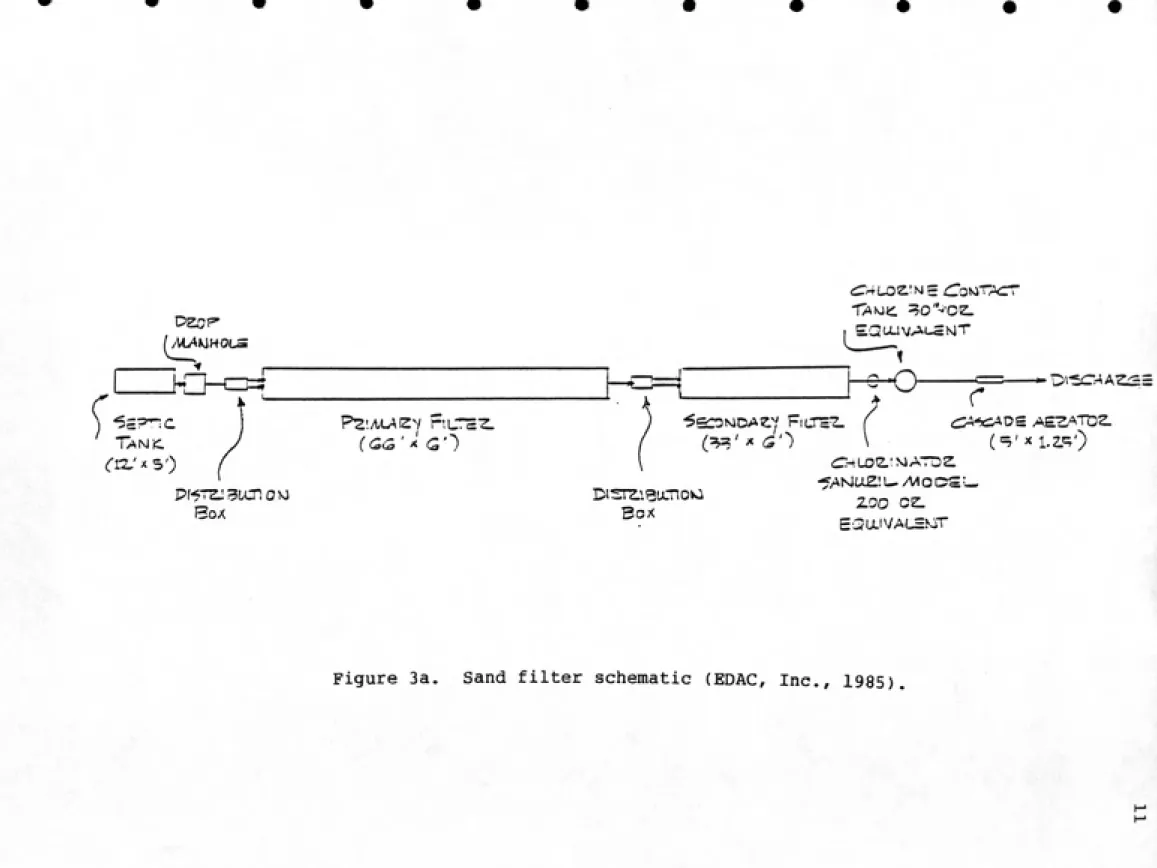
pipes in a bed of coarse to fine sands (Figures 3a, 3b and 3c).
This process removes most of the BOD and suspended solids, but has little effect on phosphorous and nitrates, which are usually released into a nearby stream or dry stream bed. The addition of
a chlorinator and cascade aerator add appreciably to the
treatment capacity of a sand filter (Figures 4, 5, and 6). Low pressure pipe (LPP) systems are replacing the use of sand filters in North Carolina (NRCD, 1985). The main reason for this is that in some parts of the state there has been
designation of nutrient sensitive waters. Bodies of water such as Lake Jordan, Falls of the Neuse Lake, and the Chowan River
Basin have been designated as nutrient sensitive and therefore
cannot contain phosphates in excess of 1 milligram per liter per
system discharge. The limit for nitrates has not yet been set
but may be in the near future.
Low Pressure Pipe System
When the loading rate of a soil is inadequate for
conventional treatment, but is still slightly permeable, the site
may be suitable for an LPP system. If the site contains only
borderline soil—suitable in the judgment of the sanitarian or
Tank.
(TiX'xs')
//VWWHOLS
H3-a=f -*D\'SC4A'S!£=
P(fTz:5unoM
Box
r
£r:-!L0!Z.'MATD2. •fANiUZ! U A10 C?S w
"'^ EwU.lVAL=huT
12
V. 2 >
I/) ^ 'll
.^ fy. u|lb'
III
----Ill
iii-|IK;l|l:?,lll -;HI"lll
ID .)
tl) -2 III
III
"•i: III-HI -111=mi III
d (Xi
ti-HiS cr w
III 5 111 H: III r 111 = : 'll-7ll|r. ij, ^lii z;-,|„ = (IIH \\\^. |,|.-: „, = |,
\l
ilsjilsmaiKI If-fijsiMiil^Hi;III=ills hi =jMtll
2
I
Ll
:;niT5 m != iii i m ;= m". nir^lir
III 5111 = l« = III = Ifl i:: III J Ills
CO
III
!!• 111=111 E III.:-, 111=III'
IILMI-Ii|,i~
Jills 111=
= 111 = 111
111 = 111
m Ml
Ih:~-111=111
III
III- p _lii':lll <
||IHI|I= "
44-hi;
o
_:IIi:hiH
II.;; BIS
Hi sills HI
= 111=: 111 = 1,
SXiSTlMG (32.01-LNr:
LSVE--III
/^l
i—j^\ -UAJTZEATSD :=;UJL!?lMa P/vPSS.
ͣ
''-ͣͣͣ' ,/,',.-.ͣ ,.ͣ,//'.ͣ/,.,, i, / /f
FlLTcZ 5AMD
• «
A.-/V.//,.////.y,7/v//^77;//// * ^.'
UtviiF3z<*.^. (^Sz^os "^"/'icc' HoTK Liioe^
Top V:=w
4"DIA.
h
'^5IDE VlHW
PLOW—.
/AZS-A
4." DU.
(j 4." DIA, iM^S^T/Er^LULENiT
—-^ (-5AMS POZ. iMFLLLEMT)
C^^eznoM yA-Aj
^iPE View 'X'oP' vtsw
Tor oz e.'L^T^e,
/WLsretsv^vTioio,
FLOW
s~71
(:4-" DiA.")
•5E-A(^Mr
=^0 01 A.
weu.-nL6
n
OUTLSr ELS-ViA-noNj, <so.30
A—*>-LOW
^ (4-" OIA.^
/ALLOW FLOW THZOUiSH
SAPPLH
> *
^
/4." D«A.")16
5
s
f
^
^\
q i
4 <
4 4
4 »I
<
1
^ : ft:
A
4
4 •
*
»
Q ---1
4 *
0 4 a 4 a a A 6
« 4
<- — 1 ' , ,. , lU a
Pi
o n P^ ,fj!
g^ it t3 ^,
P IIIII
IP Ml-Ills III _
III-II)--III = =
-IfrJJjhlJIifilK |-I|/.^((I = MI=
1,2111 II HIE "I K?,,,
g{5
u IP!? m iHHij5 III r. 111= III
~i\S
111=111-= r:l|l=ll| 111= HI =
17
of effluent by LPP systems is dependent on the resting between
loadings and the near-surface discharge of the effluent. These
processes account for the success of the systems, but the
leachate's distribution downward and outward should not be
ignored. The trench design for a typical LPP system is shown in
Figure 7 and the pump tank in Figure 8. The layout for an LPP
system is detailed in Figure 1. The LPP system will be discussed
in more detail in the following sections of this paper.
Mound systems (Figures 9a and 9b) are centered around the
design of a LPP system but depend less on the existing soil. They are used almost exclusively for repair, emergencies, or
where the need for a system has been ruled to be high. The mound
of permeable sand is used to slow down the loading under very
slow percolating conditions.
Package Treatment Plants
Surface discharge is the only practical technique for large
subdivisions and municipalities. There are a number of different technologies and components that a treatment plant can implement
to treat residential sewage. The most common are activated
sludge, extended aeration and rotating biological contactors.
Extended aeration is an enhancement of the activated sludge process, but besides incorporating mechanical aeration of the
sludge, it is also followed by clarification and chemical feeds
18
/1-XI'
4" p\/(2 P^PE fUAElFP,
lil5Jl?.ni
m^
£
-mxii-VT
4, f^ Am'^X- '^^ ^'•
zo'-o"
-^aPPL-f A^AK)^FDLD
0!=Ill-Fill inlfii.
% s
'l-fi"
VNetHr^Kl DA!^
P/CtHP'sOtU)
4->^ EAISTIK)Cn (3|EjDaMD
SUXF/CE
lAIEeAL
19
'pTC/\I<=\HT DUE COK)v:iECTIDVs)
TWO SePAE>\TE
HO-VOLT oecuiTS
=ill=it?l|H:ll r|ii=Ni|l?
E/--THr.iOC DIS-(iOtOOECT.
Iffii^k^^-^
11=111=111=111=i^in=.iii=iii2ii'=in
II5III5111.5111=III gin
MyuoM PULU EOPe /0LO5E VAL\/6
TTiP^Ar^PUKItO
EL^oW
ARAL'S
APAPTEt'*
AlAEALFtOAT
OPTIONAL CHECH
VALVE
-JIWf^LC FOwctloM
FLOAT COMttOU ^^EE-CUC^-SWITCH
-^U^MB^fJlSLE
PUMP
AHALEADAPIEC
a^coMctEie puxt-^
BUr^Hlfig AD>>PTEe_
•^OLPrff LIME
Figure 8. Pumping chamber of an LPP system
i ii III
RlrTTiUti •F^JriP
-tOI^Si^lU
L
r-oisn?iadTi^
LlMl
PILU
Figure 9a. Components of a mound system (EPA, 1980)
21
'mi^mm
Strayv, Hay or Fabric
F
Topsoil
Distribution Lateral
Absorption Bed
/ / / / /.Plowed Layer of Top Soil Slope
^5S7SS^Z!
1,;^^=^—-7^ Rock Strata orTfnpermeame Soil Layerv.':^^£Hr= ^=^=^.2^:1::^
(a) Cross Section of a Mound System for Slowly Permeable Soil on a Sloping Site.
Straw, Hay or Fabric
Fill
Topsoil
Cap
Distribution Lateral
Absorption Bed
n
Plowed Layer of Top Soil
Water Table or Creviced Bedrock
14^ 4- M • !• - -MO't* •«).
(b) Cross Section of a Mound System for a Permeable Soil,
with High Groundwater or Shallow Creviced Bedrock
22
INFLUENT
BLOWER AND MOTOR UNIT
CONTROL PANEL
BLOWER AND MOTOR UNIT
Clarifier
ACCESS LADDER
LADDER
5 STILLING WELL
SLUDGE HOLOINO I TANK
Aeration SLUDGE TROUGH^
SLUDGE LIFT
1 PHll 11111 illBARGRATINQ WALKWW yiliiliiii
TRANSFER PIPE AIR LIFT HAND RAIL
SKIMMER
CLi CONTACT TROUGH
DIFFUSERS
oo==opo—oo ao—OTto—cio ou—xy
DRIVE m A EFFLUENT HAND RAIL DRIVE
CONTROL PANEL SILENCER
SLUDGE TROUGH
BAFFLE tr-*. WIERr
SLUDGE AIR LIFT V Aeration Clarifier TRANSFER PIPE AIR DIFFUSERS DRAIN
HAND RAIL AND WALKWW
Elevation
r SLUDGE TROUGH
I r AIR VALVE
AIR HEADER WL Clarifer CL Contact Sludge Holding
CLj AIR LIFT
r DIFFUSER
MECHANICAL SCRAPEP
End Section A-A
PLANT DESIGNED FOR INSTALLATION CONDITIONS WHERE
soil BEARING CAPACITY IS MINIMUM OF 2,000 PS.F
SOIL BEARING TO BE CONFIRMED BY OWNER WITH A SOILS TESTING LABORATORY.
PLANT IS NOT DESIGNED AGAINST HYDROSTATIC UPLIFT PRESSURES.
Figure 10. Extended aeration, factory-built sewage treatment
plant. Single tank, vertical clarifier, 3,000
23
effluent is chlorinated and discharged into a nearby stream.
Sizing of the system varies between manufacturers. Typically a
plant expected to handle 10,000 gallons per day of raw sewage
would need a 10,500 gallon aeration tank. The next stage is a
clarifier, which helps settle out suspended solids. The
clarifier would have a 2,500 gallon capacity for a retention time
of about 2.5 hours. The retention time of the clarifier can be
varied to degree of treatment desired. There are a variety of
additions to this system that enhance its treatment capability
for specific problems: chlorination is usually added at the end
of the system before discharge; froth control devices are
sometimes needed; chemical feeds are added to remove a specific
pollutant such as phosphates or metals; grease traps are added at
the beginning of the system to remove non-biodegradeable scum;
flow equalization chambers are added to even out high and low
flow from the collection system; tertiary filters are used for
added removal of BOD and other suspended solids; and finally, if
needed, there are a large number of control meters and devices
availiable for automatic control and monitoring.
A 10,000 gallon day system using the properly designed
equipment and maintained properly can usually have a discharge
that is less then 10 ppm BOD, 5 ppm total nitrogen, 1 ppm
phosphates, pH between 6 and 8 and less than 5 fecal coliform per
liter.2 This is much better than the normal discharge parameters
required in parts of North Carolina. Of course, cost is the
major factor in most system designs of 10,000 gallons per day or
24
system as more homes can be attached to the system to offset operation and maintenance cost.
The rotating biological contactor (Figure 11) is a large cylinder with slats of material on which microorganisms can attach. When operating, raw sewage flows through screens and a equalization tank and then to a primary clarifier (Figures 12 and 13). Pumps remove the sludge to the aerobic digester for
stabilization. In the digester, a clear supernatant liquid is produced, which returns to a surge tank for retreatment. The
effluent from the clarifier flows over a weir and into the RBC
tank. After treatment in the RBC, the waste is discharged to the final clarifier. Residual solids and sloughed matter from the RBC are pumped from the final clarifier back to the surge tank. The final effluent goes to a disinfection tank and then is
discharged to a stream, sludge is removed and landfilled or land
applied. In most cases the effluent from an RBC is better treated than that resulting from extended aeration, but
reliability remains a problem with RBC units. Mechancial failures of some of the older systems has caused problems in
states, such as Pennsylviana, that do not allow the new
installation of these systems.
Land Surface Disposal
Spray irrigation, once a common solution, is now dwindling
f
/
^f^tmiumimmmi^t-^^
h^mi
/
26
COMMINUTION &
SCREENING
INFLUENT
i
FLOW
EQUALIZATION
(SURGE TANK)
nm
RETURN SLUDGE)
DISINFECTION
(CHLORINE CONTACT TANK)
EFFLUENT
(OVERFLOW)
(SUPERNATANT)
' r
/
AEROBICDIGESTER
FLOW
CONTROL
(WASTE SLUDGE)
FINAL
CLARIFIER
ROTATING BIOLOGICAL
CONTACTOR
PRIMARY CLARIFIER
#fr-.»^??ags
Wy.
-<S^
rf-^wSw*^
aftiK&
m
28
treatment plants or an appropriate on-site sub-surface
discharging facility. However, the most common use Figure 11
is in very remote areas, such as rest stops and farms, where treatment is absolutely necessary and where a great deal of land
is available. In some cases—when an existing system has
failed—a spray irrigation system may be allowed. The
restrictions on these systems are usually followed carefully for obvious reasons. The system needs to be as far away as is
practical because of odors and potential health problems.
Maintenance is important to prevent overloading of the soil and spray head fouling. The use of spray irrigation systems are acceptable if enough land is available and the treatment process does not interfere with adjacent property usage. "Dilution is
the solution" advocates have used spray irriagation for some time
and have adapted it for use in the treatment of hazardous and
hard-to-treat wastes.
For years, land application of liquified sludge on farm land has been done with good results. This practice differs from the
treatment for on-site disposal of effluent as the sludge spraying
on farmlands is intended for soil enhancement and is highly
monitored and normally applied professionally. The spray
irrigation method offers the greatest contrast to the
conventional septic system, which is out of sight and hardly ever
noticed versus the spray irrigation system which can be a
29
III. LOW PRESSURE PIPE SYSTEMS
From a researcher's standpoint, the major mechanism behind
the success of the LPP system has not been proven, but the
working system is easily observed. The system has evolved from
the common sense remedies from the failures of the conventional
tank septic system. The conventional system depends almost
entirely on the percolation through subsurface soils and the
absorptive properties of that soil. In particular, the system
relies on only a part of the absorption field at any one time.
The effluent is delivered to the system on a more or less
continuous basis. Evaporation and evapotranspiration are minor
factors in the operation of this system. The LPP system depends
on the soil's absorptive capacity, but uses only the upper 18
inches of the surface soil. This fact allows for the effluent to
be treated by a number of other natural mechanisms. Besides
percolation, the system is dosed evenly to prevent the "creeping
failure" process from occuring as it does predictably in all
conventional septic tank systems. Figure 14 shows the trench and
pipe diagram of a LPP system.
Under normal use conditions, the dosing of the field every 6 to 24 hours by the LPP system gives the soil time to adequately
treat the effluent before overloading and soil failure can occur.
The failure of a CSS is usually caused by the matting of dead
bacteria in the trenches, which leads to the effluent's eventual
breakthrough to the surface. This quite often occurs during the
30
5'-0"
itein=in=iii
[o
TigTrrmrnnmrgnrg m nil ;iii>ffrrTTT^Tr=nr=iTi?Trr?TfrrTnfTi
= /||=lii?. 7 lll^l|l=lllS||i = iii = m= iii^i|i = lll=l|l=iir=iiisiii=ii|;
11'="* «»»... illsiil=lli=Mts(li?lil=ltl =lirHill=(( =
8 MIW. =lllr =lli=\il
^^. ___ J___ '" z-4"-^-T
,FlK/|SHeD<?iCAt>E
lllrlllrjIIH Mfelll
III
C^l^VEL : ''/a" TD I * '^IZ-E ^T^ypiCAU) 1^3%
STEAW
,, 12'-5w.iTABte-SOIL ^aaikji/v^um")
Figure 14. Trench and pipe diagram for an LPP system
31
overloading of poor soil, inadequate designs, and compaction of
the system may also cause failure to occur prematurely. In
addition to the treatment by the septic tank an LPP system acts
to some extent as an anaerobic and aerobic filter bed (Kennedy,
1981). The low cell yield of anaerobic processes in this manner
produces much less problems with matting. This more efficient
assimilation of organics converts the organics to methane, carbon
dioxide and nitrogen gases rather than fixed as new cell
material, which decays into the matting material. The proximity
to the surface allows this assimilation process to occur with the
addition of the other treatment benefits of evapotranspiration,
evaporation and assimilation of nutrients into plant material.
As long as the soil can contain viable populations of bacteria in
low numbers, the soil will remain a good treatment medium.
Evapotranspiration is probably the main fate of the effluent
from the field in the warmer parts of the year. Vegetation cover
is therefore important to the proper functioning of an LPP system.
During the cooler parts of the year evapotranspiration is less of
a factor. However, evaporation is still important, especially in
systems in open areas where the sun's warming the field causes a
temperature differential between the surface and the soil
immediately below. Therefore, even frozen soils will sublimate^
significant amounts of effluent.
Downward movement of wastes in LPP fields is also a factor
in dependable operation. If the effluent does not leave the
surface, infiltration through the bottom and sides of the
32
Core samples taken in systems operating for different
amounts of time show only a significant movement of effluent
below the bottom of the trench between the oldest and most
recently activated systems (Table 1). This observation seemed to
varify the idea that most of the effluent in a LPP system is
assmilated in a smaller area of soil then a conventional septic
tank system because of upward effluent movement. CSS operating
over a similar time period have shown movement of 12" or more.
In unusually high problem areas, the convenience of
monitoring accounts for an increased number of LPP installations.
System failure is instantly revealed by the high water alarm
indicated from the pump tank. Failure of this type is usually
minor, and results from such problems as pump failure or wiring
damaged from lightning. Figure 8 shows the workings of a typical LPP pump tank including the high water alarm float. The location
and repair of the failure usually takes only a few hours.
Overloading of the field is usually also immediately obvious, as
revealed by odor, ponding at low points, or streaming on the
surface. Normally this problem is easily remedied by setting the
floats below the maximum pumping volume. This often is all that
is needed to allow loadings of smaller amounts of effluent more
often which gives the soil time to accomadate the load. The
system's dosing volume should be set at no more than 50% of the
calculated daily loading rate; it is desirable that it be only
25%. Many installers fail to recognize the importance of proper
float setting and end up guessing at the proper setting, which
33
TABLE 1
SUBSURFACE PROFILES OF THREE LPP SYSTEMS (EDAC, Inc., 1985)
DOP= Depth of profile
DOD= Depth of discoloration below trench bottom DF= Design Flow
Site Age DOP POD Location DF
Chatham 2 years 2 feet 2-3 inches Open field 480 gpd Durham 6 years 2 feet 5-6 inches Wooded 360 gpd Orange 4 years 2 feet 4-6 inches Open field 360 gpd
(TWO SIMILAR CONVENTIONAL SYSTEMS)
Orange 3 years 5 feet 12 inches Open field 500 gpd Orange 8 years 5 feet 18 inches Wooded 500 gpd
Note;
This sampling was performed in order to get an indication of the
movement of effluent as indicated by soil discoloration. More
study would need to be done to prove that this is actually the
34
In a conventional septic system the primary treatment tank
must be below the lowest water use point and the drain field
below the tank to accommodate gravity flow. In the LPP system,
the primary treatment tank is located in the same manner, but the
field can be located anywhere on or off the site where there is
suitable soil. A CSS can also be designed this way, but the LPP
system has the advantage of reduced size and flexibility in its
field design.
When a CSS is installed, all the trees that may be in the
way of the intaller's backhoe must be removed to a minimum of a
12-foot path and are usually cleared for about 18 to 22 feet. In
many cases this takes some aesthetically valuable trees off the
lot, clears a vegetation buffer and causes an unnatural look to
the residential property. The LPP system is installed using a
small trencher usually not more then five feet wide. In addition
the lines do not have to be straight or symmetrical. This
characteristic of the LPP system makes up for any of its
installation disadvantages when placement in an open field is not
possible.
When the LPP system is installed in a open field, the area
must be cordoned off and protected from vehicles that may travel
over the field. The proximity of the laterals close to the
surface subjects them to the possibility of damage. In addition,
the compaction of the surface soil would decrease the functioning
of the LPP system. Installation of the LPP system in the woods
helps eliminate vehicle traffic because of the natural barriers
35
However, a major problem with a CSS near trees is the
invasion of roots into the leaching field; these roots clog the
pipes and cause premature failure. The very nature of the LPP
system would encourage root growth into the system and allow the
roots to become part of the treatment process. Because the
system is under pressure and is flushed regularly the possibility of clogging of a properly operated system is unlikely. There
have been a few cases of roots closing some of the holes at points in a lateral system, but this has been shown to be an
installation fault. Part of the two systems excavated showed
roots growing inside the PVC pipes at a number of points in a
system. It seemed obvious that this occurred for three reasons.
The first was that the holes in the laterals were l/4"-holes
where they should have been l/8"-holes as well as the fact the
installer had put the holes every five feet. If he were going to
use l/4"-holes, further spacing would have been necessary.
Quarter-inch holes are not recommended for residential use for a
number of reasons, the encroachment of root systems being only
one. Another reason is that most residential systems do not have
a large enough output to require such relatively large holes.
The second problem was that the rooted areas were always at the
end of the laterals where the ends had been pushed down during or
after installation. The result was an accumulation of effluent
in the end of the pipe—effluent was always present in these
pipes up to the first hole from the end. It is believed that
even these first two factors together were not the main reason
36
that the residence—after being occupied for three years—was vacant for almost a year and only sporadically occupied for
another year. The owners, who separated and had been leasing the
property, finally sold the house. This long period of vacancy
gave the trees around the system time to encroach into the system
and seek out the nutrients and moisture in the pipes, primarily
because of the lack of normal flushing of the system. The new
occupants discovered ponding after being there for about a year. It was also suggested that the new owners should be living in a
five bedroom house rather than the house in question, because of the number of occupants was usually around seven people and the house had only three bedrooms and a den (this usually means 4-5 occupants according to head count design standards of 75-125 gallons per day per person). The increase in occupants over the
expected design flow probably contributed greatly to the observed
failure.
A major benefit from the introduction and use of the LPP
system is the possibility of repair to failed conventional septic
systems. Traditionally, there were only two ways in which to
repair a CSS: one is to add more line to the end of the system;
the other is to simply place the system in another location on
the property. Both alternatives work well and are viable options
in most situations.
The problem occurs when the system should not have been allowed orginally and when there is no room on the site for
replacement of or addition to the existing system. The LPP
37
In summary, the major advantages of the Low Pressure Pipe
38
IV. DESIGN AND SPECIFICATIONS
Short Journey Center is a retreat for the Roman Catholic
Diocese of Raleigh, (location map. Figure 15). It was originally
a school and then served as a number of community office centers
before being put up for sale by Johnston County. The Diocese of
Raleigh bought the property in good faith for its youth training
and retreat center. It was well aware of the building's problems
and property, but the low purchase price made the project worth
pursuing.
During the remodeling program, it was discovered that the
existing sand filter had failed and that discharge could not be
allowed under the new stipulations of facility's use. The
facility was being prepared to handle about 100 people overnight.
As a school and office space, the center had no showers and could only conveniently serve one meal a day. For the center's new
uses, the treatment system would have to treat about 6,000
gallons a day rather than the 3,000 to 4,000 gallons for which it
was originally designed. However, an important factor in this
facility was that it would be intended for only weekend use.
Nevertheless, regulatory requirements would stipulate that the
facility be able to treat about 6,000 gallons per day. The
possible use of a discharging system was out of the question
because a pond on an adjoining property would cause a near zero
ViClNTN/ MaT> NlO <=5CAL£
SMirwFie.LO
40
property can handle sub-surface treatment then it must use a
sub-surface method for its wastewater treatment.
This was the case at the Short Journey Center property. The
siting and design for a LPP system was originally carried out by an engineer in Raleigh according to available design information.
The design was simply a residential system brought up to
"commercial" scale. The initial cost estimate, not including new treatment tanks, was about $65,000; new treatment tanks would add
another $15,000 to $20,000. Other related costs, such as fencing
and finish landscaping, would put the cost of the system as
designed at about $100,000. This is almost twice what the
Diocese paid for the entire property.
A member of the reviewing staff for the Diocese asked that
the project be reevaluated from another direction. Environmental
Designs and Consulting (EDAC), which was set up to design and
install innovative on-site treatment systems, began to examine
the project. It was suggested that the company could probably
reduce the cost substantially by designing the system using a
larger storage capacity and smaller treatment field. This would
take advantage of the intended "weekend use only" of the facility. Since this type of design had not been approved under these
cicumstances, the system would have to be designed and proven to
the satisfaction of the appropriate regulatory agencies. The
cost estimates would reduce the cost of the system by almost
$30,000, EDAC was given the go-ahead to design and to acquire
41
The Specifications for a LPP system for Short Journey Center
as submitted to the Department of Natural Resources and Community
Development are contained in Appendix III. Appendix III refers
<7
s/
Pu>tP TAhiYL*>
o o
EX t STl Ni<^
BUUUDlNXa
CONC. V/A
iLNDez^EoujMo ELarre:\CAi.5ez.vice to k^ew pohp <:»iot^ols
6iZEA5ETZ;\P
EXIST|NJ<S
ro
(^ULITEZ. CULK) -OFF TO BS DiVECTSP
CSOMC. WAUL
ALL LAT=2^L5 l"^ "
(5' O.C.)
FIELD * 1
100 ͣ^5
Figure 16b. System Placement (EDAC, Inc., 1985)
ExiSTKjQ o;"n:^H
44
1TT>^^,-^lll , lltelll^lllHIII |li=lll=lll =
= 111=11
'_n'» 5'-0
'<FlKilSHED<?^EADE
8 MIN
A
= 111^ ? 111=111
III
Z-4"-6-8"'
r IZ'-JU-IT/ABLE -5.0IL {aIIKJIAMAm")
/ ?rii5iiiH
=111=111 nfeiii rill
B/*CHFI
LL-CSil^AVEL: =5/8" TD I*'7ILE ^T'yplCAU) Lg"
STZAW
45
14* DlSn^lBUTIOtO
lATEZAL (lZ.00 P-^ITMIKJ-WALL P'VC pipe")
BACfCF\UL WITH 1:111=111=111= = 111=111=111 iiiHliiHiniJL =111=111=1^ III m iZOC'C
TU^N-UP FLUSH WITH
C5)E.ADE ^ CLEANJ - OUT ,
2"-SLEEVE d CAP.
NO HOLES IKJ LATEEALS IN OC OUCTJlDE OF EACTHEK) "D>AH
111=111=111=111 =1115 illi = in=iiisiii=ill feiii = iii=iii = /ii= «IEI|I« SlJIS
2 =111
^ imm
E|ll = ' = iii=iifliQr||rtiii='(iis111=111=
iil = lll=lli
Ills-III
tllS
II = 111= Ml FMISIIISill
11 = 111
EACTHEK) DAM
^PACKED WITH-soil)
OF PIPE. ^EE^CHED.HOLE'S IK) BOTTOMV TEES (e:educe
AS e.EG?u.i&eo.
3"'SUPPLY MAfOIFOLD-KJO HOLES
&EQLLIIJ1ED. MD CqIZAVEL ^lEQLLieED
IKJ DITCH (-^CW 4-0 PVC PIPEY
'^HEpULE DP HOLES IIQ PIPE
Field * 1 4 ͣ*"Z.
ALL LATEEALS "SHALL HAVE ^Az'-DIA. HOLES ^ IQ-O" O. C.^ 10
PEIZ-LATEEAL. 3" AAIK). F^oM HMD cTAPS . HOLES STAC^EElED BETWEEIO
LATEE^LS.
Mote ; All laterals must be laid level, usimg, a t^aw^it,
LATE^^LS Oei. ditches shall k)OT SLOPE AV^An/ F^oM
MAKJIFOLP.
G"! iZ.'-0"
¥A
c
Tt? Fieuo -*"
CO\lBZ. WITH A\C vewTS
•2" CONDUjT FDC
PUJ-tP CONTEOL i
4" J o a: 3"vAue« OE run:
30" DlA, MANKOUE
4, 000 (S/M-LOMITMOJi.
"3 <^ iKistoe -mioe.
-iris"i5iiisiii«
r i(i5iii-=!iisiii3iKi I n
^
COt^C- or. MAMSCZ^ MAKJHOLS
^ \h±l___\MA______m\j' Oil '.,; ill.._______i i=iiigiii=iii=_________________________________
PeECAST" CDNC. TAIOC
FlWlSH<5ZADe f'='lll=fTI:flHJ^
11151115(11 = 111 = 11131115111 = 11
"^eAU AL1.J01MT5 yv/iTEZ.T!<^HT
NJyLON PU-U-IZOPS
^ " CHECi^ VALV5
Hi(3H WATEZ-ALAEM S'-G" ABOVE CHACISB^
FLOOC
Ml
Pump (z im PuMPTAtocT)
S" F'esCAST BOTTOM ^oig ͣ
r~~--_ J rs"A3'';4-'\:owc, PiAMPP'Ao
PUMF»-0»J PLDAT SWITCH
PCSCaST (TOOC.TAMt:
"•'. '^J^:^.S'<-^" <3 • STDlOe SSD
Kjore : ALL e>^P02iEP v/ieiNC^ -5hau, 3E in
c:X»^V»JL\r. \<[Z.]hi3^ TO V*lLMP^ "^^ALL BE IN cTONDaiT
.PUMPcroioTEou PAWEL (tvr")
BggyAt'Fr. BOA
?mi^
111=111 = 11
= IMSIIi =
= 111 = 111 =
(113/IISiil = lll=ll|S
'i2./ll = !ll
|/1I = |!IS
'^ in=iii
ii>=iil I »u
,-5-n£Sl-ANJ<:^LE FeAHE
(S-"x G" X 4. -o" WEATHE^PW30f=
EXISTING'S'EZLVlCJ
POLE WEATHEZ>4EAD
PROVIDE EXTZA<:>VBL£TD enjablE <:roMKjE<rr;oKJ
B^ UTiLiry
^ xV-' ^)
c-AI-By UJILIT^
ik\3Tau_^::abls. in} 2." siqiD ^teeu crOMDU-lT TiD G" BELOW C^iS-^OE
FlNJlSHED C^SADE —;:>
2^ !l_iJi =
I-^8 1(0 '5/4-'' C.
sm=~ 2Em=iii=iii = sni=ii!== 111
/
6
^ -^ 3 U:5E 5ECV. C:ABI^ipr
Figure 19. Electrical installation (EDAC, Inc., 1985)
48
POMP L PUHPl.
AAAGiWETlC STAETEei
1
A1ECMAM--"^^
^
ICAL _*^ 1
M
_ BCEAtiE^
CLOCVi
o
D a P ͤ
r
o
D P
D a BOX
/
/
K
-ri HE-LAPSE1 KiDiGATOC/e
FLDAT L
ITIKlCq AT
1, OOO
C^ALLOK)*?
r-JT
)
POWECITDPUHP'
POYVeCTOPUHP^ '12.-22,0^.
49
V. CALCULATIONS
Area Needed For Treatment; Absorption Area
The assigned loading rate for the soil at Short Journey
Center was calculated at 0.2 gallons per square foot per day.
This was based on a soil evaluation by the soil scientist from
EDAC, Inc. The report reads as follows:
My investigation of the soils on the Catholic Retreat
Center in Johnston County found soils suitable for a low
pressure pipe dosing system on a majority of the site. These soils have an eight (8) to nine (9) inch loamy sand surface with a sandy clay loam subsoil to 36 inches. The
water table was below 24 inches across the site except for
a small area to the left of the left hand driveway. Soils
with water tables above 24 inches are not suitable for a
LPP system. Health service regulations allow for a loading rate of 0.3 to 0.4 gallons per day per square foot on a sandy clay loam soil. However, for systems greater than 3,000 gallons per day the guideline is to cut the loading
rate in half to 0.15 to 0.2 gpd/ft^. Considering the size
of the purposed system, 5,000 gpd, I recommend a design
loading rate of no more than 0.2 gpd/ft^.
Table 2 shows maximum loading rates for LPP systems based on
soil texture and estimated permeability. The amount of water
used by the Center could not be estimated by conventional means. Usually the local health department will assign a usage level per
person for a facility's designed system. In this case there were
too many variables for this assignment of usage to work. The
most similar facility would be a day camp with a water use of 75
gallons per day per person. This would give the SJC facility a
daily flow of 7,500 gallons. This may be a good flow rate, but
for a system of this size it would be best to be more secure in
USDA Soil Texture* Estimated Permeability Maximum Loading Rate**
Sand, loamy sand Sandy loam, silt loam Sandy clay loam, clay loam Silty clay loam, sandy clay Silty clay, clay
minjin.
20
20-40
40-60 60-90
90-120
gpdlft^
0.50-0.40 0.40-0.30
0.30-0.20 0.20-0.10 0.10-0.05
This table does not consider the effects of clay mineralogy on soil permeability. A sandy clay composed of 1:1 clays may be more
permeable than a clay loam of 2:1 clays.
These loading rates should be used only for calculating the size of LPP systems—not for other types of systems.
Table 2. Maximum loading rates for LPP systems based on soil
texture and estimated permeability. (EPA, 1980)
51
realistic estimation of water use at the Center, a water meter
was placed on the well water supply to calculate per person usage
over a two month period.
Data from the meter showed that the usage per person was
about 25 gallons. If 100 people were to use the system in one day, the daily flow would be 2,500 gallons. This figure had to
be adjusted for a number of important factors.
1. The water use figures were for the cooler months of March
and April. Water usage for this type of facility would
expected be much higher in the summer months considering
the increased number of showers by the teenagers using the
facility.
2. Even though a limit may be set for overnight usage of no
more than 100 people, the facility had at one time 250
people camping on the grounds for one weekend. The use of
the facility was multiple and therefore the treatment
system had to accommodate any expected use of this sort.
3. One limiting factor was that the storage tank held only
5,000 gallons and once filled had to be turned off. If
more water was needed the pump would have to be turned on
to slowly fill the tank again.
Considering these factors, a peak daily flow rate for the
52
gallons per day for 2 days a week and 400 gallons a day for the
other five days.
Normally the system would have to be designed for the
maximum daily flow of 6,000 gallons per day and given the loading
rate of 0.2 gallons per square foot. Consequently, the area
needed for treatment would be 30,000 square feet, the repair area
would be 30,000 square feet, yielding a total of 60,000 square
feet or about 1.4 acres. There was not enough suitable land
available on the 3 acre site and the cost of such a system would be about $80,000 to $90,000. At this point, calculations were
made to reveal the least amount of absorption area that could be
used, taking advantage of the peak flow occurring during a
two day period.
The balance of cost had to made among storage cost, treatment cost and area available. The best treatment area
available was approximately 25,000 square feet, which would handle 5,000 gallons per day. The cost of storage tanks and
their installation age tanks would be about $2.50 per gallon. An
estimated cost per square area of treatment was $2.00, based on
previous installations and price per unit of materials and labor.
The following calculation resulted:
Peak Load = 3,000 gallons for 1/2 day Friday
6,000 gallons for Saturday 3,000 gallons for Sunday
Total Load = 12,000 gallons for weekend
53
nicely). An optimal field would be two 100 x 100 foot absorption
fields with a capacity of treating 4,000 gallons per day. This size was arrived at by fitting the field in an area that had the best soil for treatment and splitting the system to avoid the use
of excessively large pumps requiring 3-phase electrical service,
which the facility lacked.
Minimum Pumping Volume
For such large fields and especially in this case, the
minimum pumping volume (MmPV) was important to the calculation of storage. Since the fields were to be split, the MmPV would be
for each field. A check value in the pump take would be added to
prevent back flow after pumping since the supply lines would hold
an excessive amount of effluent (180 gallons for each 4" x 300'
supply line). By doing this, the volume of the supply lines and
manifold can be ignored in calculating the minimum dosing
volumes.
MjnPV = 0 gallons for supply
0 gallons for manifold
388 gallons for laterals (5x volume)
Total = 388 gallons
This amount of liquid had to be available before the fields
could be loaded. The maximum dosing volume would be 1/4 to 1/2
the maximum loading rate of the field. Therefore, each time the
54
day field. This is higher than the minimum pumping volume, so is
therefore adequate.
Storage Capacity
The pump tanks would normally be required to store a full
day's maximum flow in addition to another day's in case of pump
failure. This would equal 12,000 gallons. However, the facility would only need to store 9,000 gallons for any weekend period.
In addition, its maximum water use for a weekend is usually
limited to its water supply capacity (6,000 gallons). At this point, one must speculate on the worst scenerio to arrive at the proper storage capacity, high water alarm placement and planned
remedies. Refer to Figures 21a and 21b for the expected pumping
curves.
The system would be set to pump only if there was at least
the dosing volume available, which was calculated to be 1,000
gallons per field. In addition, the fields would be dosed twice
a day, once every 12 hours. For the two fields, this would be a
total of 4,000 gallons a day discharged to the treatment fields.
The clocks would be set for discharge at 12:00 AM for Field #1,
6:00 AM for Field #2, 12:00 PM for Field #1 and 6:00 PM for Field
#2. The use during some weekends could be the maximum usage of
12,000 gallons begining with 3,000 gallons on Friday and a
maximum residual from the week of 800 gallons (an amount just
under the pumping volume of 1,000 gallons that allows pump down
£XPGCT€D P£>^< 9P00-^
ͣ
D ^ ^OOO-J
®
MOOO^
0
J4?O0
"aooi
,lOC?A>
/y\orJ. Twes. A>e!> THwes.
Figure 21a. Pumping curve for a 6,000 gallon/day flow rate
4,000 H
CqALLOKia
zpoo -I
•^Rl ͣ 3ftT
PEAK STOKACA
SUN
Figure 21b. Pumping curve for a 4,000 gallon/day flow rate
57
VI. INSTALLATION
The most important part of the functioning of the Low
Pressure Pipe System is the installation. Most plans are subject
to multiple reviews, but the installation is only intermittently
supervised. The failure or poor functioning is usually the
result of poor installation. The installer should also be
responsible enough to advise the designing engineer or sanitarian
of any unforeseen problems with the installation or design. Most
installers are not competent to do this for a number of reasons.
Contractors who install LPP systems also install other type
systems and more than likely these jobs are not their primary type of work. The installation of LPP systems are by no means unusual or complicated, but there are procedures that most be
followed or the system will not function properly. The
contractor may understand how the system is installed and how it
works, but of all the contractors surveyed none knew why it
worked. Most actually believed the system did not actually work and was only a temporary system or some sort of last ditch effort
for treatment.
There are a number of chronic mistakes made by contractors during installation. All seem to be related to a lack of
understanding as to why the proccess works or to an unwillingness
to make the effort to install the system as designed. This is
especially true during the installation of a LPP system among
58
of stone can be frustrating. It takes a combination of proper
supervision and competent workmen to get the system in as
designed.
Supervising engineers or sanitarians should watch for and insist on correction of the following problems:
1. Trench depth should be as indicated on the specifications
and not vary more than 2% in grade. If there must be more than 2% fall in a lateral, the grade should be evened out between dams as needed to give level ground between the dams.
2. Stone should be at least 4-8" in the bottom of each trench.
Two to three inches of stone on top of the pipes are also important for stability and insurance against infiltration
of backfill material. In addition, 3/4 inch stone should be the maximum size used in these systems. Any stone much
larger is too hard to handle when trying to level the stone
in the trenches.
3. There should be a straw cover between the stone and the
back fill; untreated building paper or weed cloth can also
be used. This prevents fine particles of soil from sealing
the void spaces in the stone bed.
4. Despite the standard specifications in design manuals.
59
of any LPP system. The difference in price is nominal. The thicker pipe is necessary for sureness of installation and insurance against breaking of the turn-ups when mowing
the field.
5. The holes in the pipes should face down. Many systems excavated have some of the laterals with holes pointed up,
mainly because of carelessness of the untrained workers. This is another cause of the soil filling in the void space and the effluent breaking to the surface. Whether this is
really a major problem is unknown.
6. When installing control valves, release couplings, backflow preventers, or any other valves or equipment in the pump, be careful not to block entry into the tank. Also, try to make it convenient to remove the pump without entering the
tank.
7. All electrical connections, switches, clocks and meters
should be made outside the tanks for convience and to
prevent corrosion. There is no standard way of connecting the electrical system of a LPP system. However, it is best to make the connections as diagramed in Figure 8 to prevent inadvertent disconnections and shorting out of the system
60
Contractors who install these systems regulary have devised
a number ways of saving time during installation. The most time-consuming part of the installation is laying the stone. This
used to be done entirely by wheelbarrow and buckets. When the systems started being used for larger homes and small
subdivisions, this method became impractical. Currently small
61
VII. CONCLUSIONS
After the system had been functioning for more than six months, the first complete maintenance work-up was performed on the system. The system was functioning as designed and no
problems were encountered. There was one lateral that had been broken due to mowing, but this was the only problem encountered. As is always the case with these systems, if care is taken during installation the system should function properly.
LPP systems are replacing the conventional septic system in many areas of low permebility in North Carolina and other states where the soils are only slightly suited for sub-surface
treatment (Proceedings, 1981). Their reliability and dependability are just recently being doucumented.
The major reason for the success of LPP systems in North Carolina soils seems to be due to the rest period between
loadings, which gives the slowly percolating soils time to
accommodate the waste. The system was orginally designed solely as an evapotranspiration system, where the mean rainfall exceeded the estimated evapotranspiration rate. In a study of alternative systems in Oregon, the systems were only permitted in an area where the rainfall was less than 25 inches annually (Oregon 1982),
North Carolina has a mean rainfall of about 55 inches annually, (Figure 22). The Oregon systems were called evapotranspiration
absorption systems (ETA), but evapotranspiration was the main designed assimilation parameter. It has been observed that the
+ Potential Evapotranspiration more than mean annual precipitation
-20
4-1 0
17 0 +; 0
Potential Evapotranspiration less than
mean annual precipitation
Figure 22. Potential evaporation versus mean annual
63
As exemplified by the Short Journey Center system, the
components of an LPP treatment process can be exploited to solve a wide range of site restrictions: a low building site can have the effluent pumped up to the system; a wooded lot need not be stripped or the trees irreversibably damaged; unconventional uses of the facilities may be accommodated by larger storage capacity and extension of the discharge time. Finally the opportunity to decrease surface discharge by having the waste properly assimilated into the environment is a great advantage
64
Appendix I
FALLING HEAD PERCOLATION TEST PROCEDURE (EPA, 1980)
1. Number and Location of Tests
Commonly a minimum of three percolation tests are performed within the area proposed for an absorption system. They are spaced uniformly throughout the area. If soil
conditions are highly variable, more tests may be required.
2. Preparation of Test Hole
The diameter of each test hole Is 6 In., dug or bored to the proposed depths at the absorption systems or to the most limiting soil horizon. To expose a natural soil surface, the sides of the hole are scratched with a sharp pointed instrument and the loose material is removed from the bottom of the test hole. Two inches of 1/2 to 3/4
in. gravel are placed in the hole to protect the bottom from scouring action when the
water is added. 3. Soaking Period
The hole is carefully filled with at least 12 in. of clear water. This depth of water should be maintained for at least 4 hr and preferably overnight if clay soils are present. A funnel with an attached hose or similar device may be used to prevent water from washing down the sides of the hole. Automatic siphons or float valves may be employed to automatically maintain the water level during the soaking period. It is extremely important that the soil be allowed to soak for a sufficiently long period of time to allow the soil to swell if accurate results are to be obtained.
In sandy soils with little or no clay, soaking is not necessary. If, after filling the hole twice with 12 in. of water, the water seeps completely away in less than ten
minutes, the test can proceed immediately.
4. Measurement of the Percolation Rate
Except for sandy soils, percolation rate measurements are made 15 hr but no more than 30 hr after the soaking period began. Any soil that sloughed into the hole during the soaking period is removed and the water level is adjusted to 6 in. above the gravel (or 8 in. above the bottom of the hole). At no time during the test is the water level allowed to rise more than 6 in. above the gravel.
Immediately after adjustment, the water level is measured from a fixed reference point to the nearest 1/16 in. at 30 min intervals. The test is continued until two successive water level drops do not vary by more than 1/16 in. At least three
measurements are made.
After each measurement, the water level is readjusted to the 6 in. level. The last water level drop is used to calculate the percolation rate.
In sandy soils or soils in which the first 6 in. of water added after the soaking period seeps away in less than 30 min, water level measurements are made at 10 min intervals for a 1 hr period. The last water level drop is used to calculate the
percolation rate.
5. Calculation of the Percolation Rate
The percolation rate is calculated for each test hole by dividing the time interval used between measurements by the magnitude of the last water level drop. This calculation results in a percolation rate in terms of min/in. To determine the percolation rate for the area, the rates obtained from each hole are averaged. (If tests in the area vary by more than 20 min/in., variations in soil type are
65
Appendix II
SUGGESTED SITE EVALUATION PROCEDURE (EPA, 1980)
Step Data Collected
Client Contact Location and description of lot
Type of use
Volume and characteristics of
wastewater
Preliminary Evaluation Available resource Information
(soil maps, geology, etc.)
Records of onslte systems In
surrounding area
Field Testing Topography and landscape features
Soil profile characteristics
Hydraulic conductivity
Other Site If needed, site suitability for Characteristics evaporation or discharge to
surface waters should be
evaluated
Organization of Field Compilation of all data Into
66
Appendix III
SPECIFICATIONS FOR AN LPP SYSTEM
FOR THE SHORT JOURNEY CENTER, SMITHFIELD, NC
1. Work Description;
The existing septic tank system shall be modified as
specified herein and as shown on the drawings. It is the intent under this contract to provide a complete working system for the
proper treatment of wastewater. Should there be any deviation of existing conditions from those shown on the drawings, the
contractor shall notify the owner and shall take all steps
necessary to provide a proper system incorporating required
changes necessitated by existing conditions, which shall be noted on the record Drawings. See Figure 16, System Placement.
2. Manufacturers:
In order to define requirements for quality, function,
sizes, gauges, grades, colors, etc. for manufactured products,
brand names have been specified for products that conform to
minimum standards. Equivalent products are acceptable provided
that they do not create conflicts with other materials regarding