King 1 Diabetic Retinopathy Screening Using a Digital Retinal Camera with Remote
Interpretation at Piedmont Health Services Program Plan and Evaluation
By Bradley King
A Master’s Paper submitted to the faculty of the University of North Carolina at Chapel Hill
in partial fulfillment of the requirements for the degree of Master of Public Health in
the Public Health Leadership Program.
Chapel Hill
2010
_____________________________ Advisor:
_____________________________ Date
_____________________________ Second Reader:
King 2 Table of Contents
Introduction ... 4
Background and Rationale ... 6
Burden of Suffering ... 6
Natural History of Diabetic Retinopathy ... 6
Diabetic Retinopathy Prevention: Screening and Early Treatment ... 7
Guidelines ... 8
Current Level of Adherence to Diabetic Retinopathy Screening Guidelines ... 8
Barriers to Screening... 9
Ethnic Minority and Low Income Groups are Disproportionately Affected ... 9
Existing Policy Frameworks Prioritize DR Screening ... 11
Improving Screening Rates with Telemedicine ... 13
Piedmont Health Services: Reducing Health Disparities by Improving Access to Preventive Eye Care in a High Risk Population ... 15
Literature Review ... 19
Introduction ... 19
Methods ... 19
Results ... 27
Discussion ... 34
Program Plan ... 38
Overview ... 38
Context of the Program plan ... 38
Goals and objectives ... 39
Relevant program theories ... 40
King 3
Sustainability ... 46
Evaluation Plan ... 51
Rational and Approach to the Evaluation ... 51
Evaluation Design and Methods ... 53
Evaluation Planning Tables ... 56
Dissemination of Results ... 59
Discussion ... 61
Acknowledgements ... 63
Appendix A. Organizational Structure of Piedmont Health Services ... 64
Appendix B: Common ICD-9 Diagnosis Codes For Fundus Photography ... 65
Appendix C: North Carolina Vision Resources 70 ... 66
Appendix D: EYEPACs Educational Flyer (Spanish) ... 67
Appendix E: EYEPACs Educational Flyer (English)67 ... 68
King 4 Introduction
This master’s paper is a program and evaluation plan for preventing vision loss due to complications from diabetes. Prevention in this population by screening identifies high risk
individuals appropriate for early intervention during the asymptomatic period, before irreversible vision loss occurs. Current data shows that adults with diabetes in the United States do not
receive adequate preventive vision care. 1-3 Patients with low income and minority groups have a
higher burden of disease but less access to care.4, 5 This program plan describes an
interdisciplinary collaborative approach for reducing health disparities and improving access to eye care by offering screening services in the primary care setting with an emerging technology:
digital retinal photography with remote interpretation.
Geoffrey Rose’s landmark paper “Sick Individuals and Sick Populations” describes the
identification of individuals with screening as the “high risk” strategy for prevention. Potential
benefits of this approach are cost effective use of resources, motivation of subject and physician, and a favorable ratio of risks and benefits. A negative tendency of screening, however, is that those who are at the least risk of the disease are the ones who are most likely to seek care.
Conversely, those who would benefit most from screening encounter barriers that inhibit access to care.6 This plan uses descriptive epidemiologic data to effectively target a population with
health disparities, and offers a coordinated, efficient technologic solution to improve access to
preventive eye care services.
In the background section of this master’s paper, the evidence demonstrating the rationale behind digital retinal photography and telemedicine for diabetic retinopathy (DR) screening is
King 5 for application of this technology in a primary care setting. Then community based program
plan theory is applied to describe the implementation of a screening program in the specific setting of Piedmont Health Services (PHS), a private non-profit federally qualified health center (FQHC) with approximately 3100 patients with diabetes across 6 clinic sites in central NC:
Carrboro, Prospect Hill, Siler City, Scott (Burlington), Drew (Burlington) and Moncure.
The evaluation plan addresses the research question: Does placing a digital fundus
camera with remote interpretation in primary care community clinics improve diabetic
retinopathy screening rates? The evaluation study design is a multiple group time series. Pre-implementation screening rates are gathered by chart review, and post Pre-implementation rates are
King 6 Background and Rationale
Burden of Suffering
The American Diabetes Association (ADA) reports that 7.8% of Americans (23.6
million) have diabetes.7 Diabetic Retinopathy (DR) is a complication of diabetes and is the
leading cause of blindness in the US among adults aged 24-75 years. Approximately 12,000 -
24,000 persons become blind each year from DR.8 The number of people with DR and vision threatening DR is high (4.1 million and 899,000, respectively), and is expected to increase to
7.2 million and 1.6 million, respectively, by the year 2020.9 In North Carolina, approximately
125,000 people have DR.10 Blindness due to diabetes costs the US about $500 million annually
in healthcare and services.11
Natural History of Diabetic Retinopathy
The natural history of DR is well characterized and progresses in a predictable pattern.
After diabetes has been present for twenty years, almost all people with DM1 (diabetes mellitus, type 1), and most of those with DM2 (diabetes mellitus, type 2) have DR.12 13 In the earliest
clinically detectable stage, nonproliferative diabetic retinopathy (NPDR) is characterized by retinal abnormalities including microaneurysms, intraretinal hemorrhages, and cotton-wool
spots. Increased retinal vascular permeability may result in thickening (edema) and lipid deposits (hard exudates). As diabetic retinopathy progresses towards severe NPDR, retinal vessels
gradually close, which results in impaired perfusion and retinal ischemia signified by venous
beading, intraretinal microvascular abnormalities and increased intraretinal hemorrhages. Proliferative diabetic retinopathy (PDR) is characterized by retinal neovascularization induced
King 7 vitreous hemorrhage. These pathological vessels may undergo fibrosis and contraction, which
leads to retinal traction.14 Thus, vision loss from DR results from several mechanisms. Most
commonly, central vision may be impaired by macular edema. Second, bleeding from the fragile new blood vessels may cause preretinal or vitreous hemorrhage. Third, fibrovascular contraction
may cause retinal detachment or tears, often resulting in severe, irreversible vision loss.
Diabetic Retinopathy Prevention: Screening and Early Treatment
Risk factors for development of DR include duration of diabetes, hyperglycemia, hypertension, hyperlipidemia and pregnancy. DR progression can be prevented or delayed through systemic control of hyperglycemia, hypertension and hyperlipidemia (secondary
prevention). Multicenter placebo-controlled randomized trials have demonstrated that the risk of developing severe visual loss from PDR and diabetic macular edema can be significantly
reduced by laser photocoagulation administered at the appropriate stage.15-17 Since DR is often
asymptomatic at the time treatement is required, screening is essential to avoid irreversible vision loss occurs (tertiary prevention). Even patients with PDR may be unaware of the threat to sight until a serious hemorrhage into the vitreous occurs.
The gold standard for diagnosis of DR consists of stereoscopic photography of seven standard fields on color film as developed for the Early Treatment Diabetic Retinopathy Study
(ETDRS).18 This method is the most accurate (highest sensitivity and specificity) means of
classifying diabetic retinopathy; however, this method is not practical for routine DR screening because it is costly and time consuming. It requires specialized equipment and trained
photographers to capture the images. For population based identification of asymptomatic
King 8 effective screening method. For diabetic retinopathy screening, the current standard of care is an
annual (at minimum) dilated retinal exam using indirect ophthalmoscopy and slit lamp biomicroscopy by an eyecare professional.
Guidelines
The American Diabetes Association (ADA) guidelines recommend an annual dilated eye
exam beginning 5 years after diagnosis of DM1 and at the time of diagnosis of DM2 unless patients are otherwise indicated to be at low risk for DR by their eye care provider. Similar
guidelines have been published by the American Academy of Ophthalmology (AAO), World Health Organization (WHO), National Committee for Quality Assurance (NCQA), National Eye
Institute (NEI) and Centers for Disease Control and Prevention (CDC).
Current Level of Adherence to Diabetic Retinopathy Screening Guidelines
Despite recommendations and public awareness campaigns from the above organizations, screening rates among diabetics are low, ranging from 30-75%, depending on the population and methods. According to the Behavior Risk Factor Surveillance System Survey (BRFSS) in 2007,
71.0% (95% CI 69.0 – 73.0) of adult North Carolinians with diabetes self reported that they had a dilated eye examination within the previous twelve months. This is likely an overestimation of
actual rates, since it is relies on self-report, and people without telephones or of limited English proficiency are underrepresented. The National Health Interview Survey (NHIS) determined a
baseline DR screening rate for Healthy People 2010 of 47%.19 According to NCQA’s Health Plan Employer’s Data Information Set, the average rate of DR screening in 2007 was 55% for
commercial health plans, 62% for Medicare plans, and 51% for Medicaid plans.20 Similarly, a
King 9 given 15 month period.2 An older study showed 32% of diabetics had never received an eye
examination.3
Barriers to Screening
Patients with diabetes in the U.S. who have never had their eyes examined tend to be older, less educated, live in rural areas, and be more recently diagnosed compared to those
receiving regular eye care.3 Cultural barriers such as language further contribute to disparities
among minorities.21 Other studies have identified inadequate access to screening because of
financial constraints, or geographic and transportation barriers.22 Focus groups of patients from
a qualitative study in New Orleans identified finances as the major barrier, while focus groups of physicians cited poor patient education as the main reason for low adherence. Both focus groups agreed that poor access to care, with wait times for an appointment as long as 1year, was a
barrier.23 The risk of blindness from lack of screening is compounded by low adherence to
treatment as well. Less than 40% of patients with diabetes at high risk of vision loss receive
recommended treatment.3
Ethnic Minority and Low Income Groups are Disproportionately Affected
Minority groups, especially Latinos, are at higher risk for developing DR and are less likely to be screened. The National Health and Nutrition Examination Survey (NHANES III)
study demonstrated disparities in ethnic groups for diabetic retinopathy. Even after controlling for covariates, only 18.2% (95% CI 12.9 to 23.6) of non-Hispanic whites had any level of diabetic retinopathy, 33.4% (26.7 to 40.1) of Latinos and 26.5% (19.3 to 33.6) of blacks had
some level of diabetic retinopathy.24 Other cross sectional studies demonstrate higher prevalence
King 10 NHANES. In the NHANES, a single nonstereoscopic nonmydriatic fundus photograph was
obtained from one randomly selected eye of each participant, whereas other studies utilized more sensitive screening techniques (3 or 7 field stereoscopic images bilaterally). Similarly, in a Veterans Affairs (VA) study, risk factors such as age, time since diabetes diagnosis, and HbA1c
did not account for the higher prevalence of diabetic retinopathy in Hispanic and black
participants.25 In the Salisbury Eye Evaluation, African Americans were found to have an increased risk of visual impairment due to diabetic retinopathy compared to whites: (17% vs
8%).26 In the Los Angeles Latino Eye Study (LALES), almost half (46.9%) of Latinos with
diabetes had diabetic retinopathy.27 A similar study of Hispanic adults over 40 years old in
Arizona (Proyecto VER) found the prevalence of diabetic retinopathy to be 48%.28 All of these studies concur that racial and ethnic minorities are disproportionately affected by diabetic
retinopathy. The higher prevalence of diabetic retinopathy in Latinos primarily of Mexican ancestry emphasizes the public health importance of early diagnosis and management among
Latinos.
Besides being at higher risk for developing DR, minorities are less likely to be screened. In the LALES study, 65% of Mexican American patients with DM2 had not received an eye
exam in the past year. Latinos who had not been screened were more likely to be less educated, to lack health insurance, to not have had a physical exam in the past twelve months, and to have
a glycosylated hemoglobin level ≥ 9.0%.4 Likewise, a study by Brechner et al found that 63% of
Mexican Americans with DM2 had not received a dilated eye exam in the previous year.29
King 11 Low income North Carolinians have particularly low screening rates. A study examining
the quality of diabetes care delivered to low-income, underserved populations at fourteen North Carolina agencies demonstrates that the most vulnerable populations have poor access to eye care. Only 6.3% of the aggregate population (n = 429) had a dilated eye exam or retinal
photography in the past year.5 Likewise, in 55 community health centers in the Midwest
Clinicians Network only 26% of sampled patients with diabetes (n = 2865) had an annual dilated
eye exam.30 Data for both of these studies were gathered by chart review. Since the authors relied on documentation of an eye examination, the number of exams actually performed may be
higher. Nevertheless, these studies identify a high risk subgroup with poor access to care.
Existing Policy Frameworks Prioritize DR Screening
Healthy People 2010 (US Dept of Health and Human Services) identifies diabetes as a target chronic condition for focusing prevention efforts to reduce the disease and economic
burden and improve the quality of life of adults with diabetes. Likewise, the WHO’s Right to Sight initiative has DR screening campaigns as part of its plan to eliminate avoidable blindness by the year 2020. Objective 5-13 of Healthy People 2010 sets an achievable, objective,
measurable for DR screening at 75%. Much work is needed to improve the 1998 baseline screening rate of 47%. This policy framework cites four reasons for the disparities in the burden
of suffering from diabetes among ethnic groups:
1. Greater number of cases of diabetes. 2. Greater seriousness of diabetes.
King 12 Healthy People 2010 categorizes the opportunities to meet the challenges of diabetes in four
transition points in the natural history of the disease:
1. No Diabetes Diabetes present (Primary Prevention)
2. Diabetes not recognized Diabetes Recognized (Early Diagnosis) 3. No Care Diabetes Care Applied (Access)
4. Improper Care Proper Care (Quality of Care, Secondary and Tertiary Prevention)
The program plan outlined in this paper is an intervention at Transition point 4: From Improper to Proper Care (Quality of Care and Tertiary Prevention).
A regional policy framework that mirrors the national objectives, Healthy Carolinians
2010 has a useful policy framework for this program plan.31 Their objectives must meet the
following criteria:
Be measurable;
Include measures to benefit our disadvantaged populations;
Emphasize individual and community intervention;
Emphasize the value of health promotion and disease prevention to our society; and
Be obtainable by the Year 2010.
With regards to diabetic retinopathy, their objective is to increase the proportion of older adults with diabetes who have an annual dilated eye examination from 66.9% (1995 to 1999) to 73.6%
by the year 2010.32
Likewise, the North Carolina Diabetes Prevention and Control Strategic Plan 2005-2010
lists seven lead priorities for the state public health system to address:33
1. Social Marketing Reaching Consumers and Policy Makers
2. Enviromental Change and Policy Supporting Healthy Behaviors 3. Ensuring Quality Diabetes Care
King 13 7. Use Health Professionals More Effectively33
Another policy framework is provided by the National Committee for Quality Assurance. Accreditation and certification from this nonprofit organization for diabetes care performance
measures can increase participating payor reimbursements to providers who meet the quality performance measures. They have as part of their diabetes management accreditation program:
at least 60% proportion of adults with diabetes must have documented level of severity of diabetic retinopathy and presence or absence of clinically significant macular edema to meet the performance goals.
A systematic review of interventions to promote DR screening identified a variety of successful interventions from 48 trials that focused on one of the following: (1) patients or
populations, (2) providers or practices and (3) healthcare system infrastructure and processes.34
While a variety of interventions were shown to improve screening rates, the largest gains were in the studies that made system infrastructure improvements. Interventions were less likely to increase screening rates if they were in rural areas, in a population with a high proportion of
ethnic minorities, or in a large study population. By contrast, the authors identified that health care systems equipped with computerized databases or multidisciplinary collaboration were more
successful.
Improving Screening Rates with Telemedicine
An emerging strategy for DR screening is the use of digital retinal imaging with remote interpretation. Use of telemedicine with digital retinal cameras can help overcome barriers to
King 14 are posed by an additional appointment with a specialist. It is potentially more convenient,
comfortable and affordable for the patient.
The first important feature of a DR screening program using telemedicine is that it accurately and reliably detects disease. A systematic review of screening and monitoring tests
for DR by Hutchinson et al confirmed that mydriatic (with pharmacologic dilation) retinal
photography is the most accurate screening modality.35 Likewise, studies show high correlation of non-mydriatic single field retinal images with the reference standard 7 field stereoscopic
photos (kappa = 0.97).36 A review by Whited summarizes the existing literature comparing the
accuracy of teleophthalmology screening modalities to clinic based examinations.37 He concluded that specificity is universally high for all DR screening methods studied, and that
sensitivity for screening with retinal photos and telemedicine is comparable or better than clinic based methods for detecting and classifying DR. Telemedicine systems that involve digital
images that are compressed and transmitted via the internet should conform to the American Telemedicine’s 2004 consensus recommendations to ensure operational performance standards
are met.38
A few countries have implemented national DR screening programs using telemedicine: France’s OPHDIAT is composed of 11 screening centers, and a retrospective study showed DR
screening rates improved from approximately 50% to 70%.39 40 The UK has also issued a national mandate for DR screening. Their National Health Service reports offering screening with telemedicine to 85.2% of the nation’s 2,064,800 people with diabetes in 2007.41
King 15 In the United States, the Veteran’s Administration (VA) has the only nationally organized
DR screening program utilizing telemedicine. The VA has achieved efficiency and quality of care for its patients with diabetes that exceed that of the private sector.42 In 2005, they reported a
biennial retinal screening rate of 79%.43 A pilot study beginning in the year 2000 using the
Joslin Vision Network determined that teleretinal imaging provided the highest quality and most
cost effective strategy for DR screening.44 Nationwide implementation at 17 of the 21 Veterans
Integrated Service Networks was initiated in 2006.
Existing policy frameworks and efforts to improve quality and coordination of care in a cost effective manner make screening with telemedicine an attractive solution for the private sector as well. Several pilot studies demonstrate promising results. These are discussed in the
literature review.
Piedmont Health Services: Reducing Health Disparities by Improving Access to Preventive Eye Care in a High Risk Population
National and regional public health policy frameworks must be tailored and implemented locally, at the community level. Targeting subgroups with a high prevalence of disease and low
screening rates can reduce the population attributable risk (etiologic fraction) of vision loss from DR. A systematic review conducted to assess the effect of interventions to increase the use of
retinal screenings found that focusing an intervention on high-risk subgroups is a valid strategy for improving overall rates.45 Therefore, in order to address health disparities and improve public health using a “high risk” screening strategy in the Piedmont of North Carolina, a local
King 16 The patient population served by Piedmont Health Services belongs to a high-risk
subgroup for three distinct reasons:
1. Poverty: 98% of PHS patients are poor, defined as having an income less than 200% of the
Federal Poverty Level.
2. Insurance status: 68% of adult PHS patients are uninsured.
3. Ethnic minorities: 54% of PHS patients are Hispanic (17,943/33,141), and 19% are African
American (6,336/33,141). The United States Census Bureau estimates the 2004 Hispanic population of North Carolina at 517,617, (6% of the total population). The prevalence of
Hispanics with diabetes in North Carolina (7.1%) is similar to that of whites (8.2%), but lower than African Americans (14.6%).46 More importantly, Hispanics in North Carolina
have less access to health care. Compared to whites and African Americans, fewer Hispanics have health insurance or a personal physician, and are more likely to not see a doctor due to
King 17 Figure 1
Unfortunately, educational interventions do little to improve adherence to DR screening guidelines among low-income persons (<200% FPL) with diabetes. The North Carolina Project
IDEAL (Improving Diabetes Education Access and Living) Initiative sought to improve six evidence based diabetes care processes at locations that served primarily low-income persons such as community health centers and free clinics. While the pre/post evaluation revealed large
improvements in other measures such as glycemic control (39.6% at baseline compared to 64.9%
at 3 year follow-up), there was little change in DR screening rates (6.3% to 7.3%).47 Therefore, an infrastructure improvement such as the one proposed by this program plan may be a more
King 18 In summary, a significant body of evidence from peer review literature demonstrates that
persons with low income and minority groups, especially Latinos, African Americans, and Native American populations have a higher prevalence of DR and have lower screening rates. Existing policy frameworks designate DR screening rates as the measurable target for reducing
health disparities and improving healthy vision among patients with diabetes. These objectives can be achieved locally by implementation of a DR screening program using a digital retinal
King 19 Literature Review
Introduction
The goal of this mini systematic review is to compile and analyze existing evidence on
diabetic retinopathy screening programs utilizing telemedicine in primary care settings. The search was guided by the following focused PICOS (population, intervention, comparator,
outcome) question: For diabetics who receive care at a primary care center, how effective is diabetic retinopathy screening utilizing digital retinal photography with remote interpretation for
detecting referable diabetic retinopathy compared to referral for a clinical exam by an eye care provider? For this review, effectiveness of the intervention includes compliance with screening
guidelines such as the impact on population screening rates and referral for treatment.
Methods:
A MEDLINE search was performed using the MESH search terms: “diabetic
retinopathy” AND “screening” AND “telemedicine.” Limits were placed to include only articles
published in the last ten years (February 2000 – February 2010). No limits were placed on the search for published language, duration of study, study design, or number of participants.
Articles were excluded if the title or abstract emphasized other interventions such as behavioral interventions or automated software analysis. Technology assessments which sought to validate the accuracy of a particular screening system were excluded. For the most relevant studies,
Google Scholar’s “related articles” feature was used to identify additional studies. The abstracts were reviewed to confirm the study’s relevance. Hand searches of citations in the included
King 20 and the following information was summarized in Table 1: time period, study design, technology
utilized, setting (location, population), accuracy of the screening test compared to a reference standard (sensitivity and specificity), proportion of ungradable images, proportion of patients screened, classification of diabetic retinopathy, and other secondary findings. The studies are
King 21 Table 1. Summary of Selected Studies
Study Technology Setting Ungradeable
Images Referral / % Screened Diabetic Retinopathy Comments
Farley et al48 2001-2004
Program description and evaluation: analysis of DR screening rates with retinal photography.
Nonmydriatic Canon single 45° field with
polaroid back. 2 cameras: one permanently placed, one shared between 3 clinics. Two clinics were required to refer to the other clinics.
Rural multisite (6) community health centers in northern Colorado 65% Hispanic, largely migrant population Payor mix: 75% uninsured 6% Medicaid 9% Medicare 10% private 302/1,040 (29%) had ungradeable images due to poor camera technique, dirty optics, small pupils, dense cataracts.
314/673 (47%) at clinic with permanent camera 261/587 (44%) 114/297 (38%) 130/519 (25%) at clinics with a camera ½ time; 95/368 (26%), 30/142 (21%) for the two clinics that had to refer patients to another clinic. = 944/2,568 (37%) across all sites.
113/1,040 (10.9%) of diabetics had any DR
46/1,040 (4.4%) had “severe” DR.
Study focused on whether primary care physicians could be trained to read fundus images: PCPs failed to refer 35/344 (10.2%) patients
King 22
Study Technology Setting Ungradeable
Images Referral / % Screened Diabetic Retinopathy Comments
Taylor et al49
September 2003 – August 2004. Retrospective pre/post study comparing screening rates before and after implementation of a digital retinal screening program.
Mydriatic Canon CR6-45NM 2 fields with Canon EOS D-30 camera back, Dell Latitude D-600 laptop connected to T-1
Vine Hill Community Clinic, Nashville, TN 90% Medicaid 45% white 45% black Ungradeable images: 1/201 (0.5%) due to pupil misalignment. Ongoing evaluation and feedback of image acquisition produced consistent gradable images. Screening rates improved from baseline rate 23% to
293/495 (59.2%) post implementation. 104/201 (51.7%) screen with telemedicine were negative (includes no DR, mild and
King 23
Study Technology Setting Ungradeable
Images Referral / % Screened Diabetic Retinopathy Comments
Wilson et al50
1999-2003 Retrospective pre/post study comparing screening rates before and after implementation of a digital retinal screening program. Joslin Vision Network: Nonmydriatic Topcon TRC NW-5S with 3 stereoscopic 45° images + telemedicine to Beetham Eye Institute Phoenix Indian Medical Center Phoenix, AZ Indian Health Service: no out of pocket expenses 100% Native American
N/A % with annual examinations increased from 1,455/2,910 (50%) to 3,051/4,068 (75%)
Rate of laser therapy
increased from 19.6 per 1,000 (1999) to 29.5 per 1,000 in 2003
N/A At a similar
satellite clinic (Salt River Clinic) that did not implement the digital screening program, rates remained stable, near 50% over the same time period.
Leiner et al51 2006-2008
Retrospective pre/post study comparing screening rates before and after implementation of a digital retinal screening program. Nonmydriatic Optos Optomap digital retinal imaging wide field (130°) scanning laser ophthalmoscopy with telemedicine University of Virginia’s primary care clinic: University Medical Associates >2,500 patients with diabetes. Most have no health insurance. 18/186 (9.7%) had ungradable images Overall screening rate demonstrated marginal improvement from 968/2,438 (39.7%) in 2005 to 1,079/2,438 (44.3%) in 2007
29/186 (15.6%) with DR;
7/186 (3.8%) had other retinal pathology.
No show rates for
King 24
Study Technology Setting Ungradeable
Images Referral / % Screened Diabetic Retinopathy Comments
Davis et al52
2003 RCT of telemedicine retinal screening program vs. standard of care (referral to an ophthalmologist).
Nonmydriatic digital: Topcon with
telemedicine and real time video conferencing by an ophthalmologist. Primary care setting rural, ethnically diverse population in South Carolina.
N/A 23/30 (77%) were screened with retinal photographs on site vs. 4/29 (14%) completed referral for a clinical exam by an
ophthalmologist.
N/A Small trial size (n = 59) limits reliability. Article is brief and offers few details on methods, so there is potential for significant selection and measurement bias.
Massin et al53 April – November 2002
Program description and evaluation of DR screening: comparison of referral to retinal photo with telemedicine vs referral for clinical exam. Nonmydriatic digital: Topcon TRC-NW6S with five 45° images + telemedicine Primary care Practices Paris, France 18/358 (5%) had ungradable images 309/417 (74.1%) were screened in telemedicine group vs.
298/417 (71.5%) in standard care (non significant)
King 25
Study Technology Setting Ungradeable
Images Referral / % Screened Diabetic Retinopathy Comments Zimmer-Galler et al54
October 2002 – March 2003 Program description and evaluation Mydriatic, Digiscope ten fields generate equivalent 55° mosaic with telemedicine to Wilmer Eye-Tel Reading Center
51 Primary Care Practices 7 states and the District of Columbia
295/2,771 (11%) were ungradable, most ungradable patients were >70 yo
N/A 468/2,771 (17%)
had DR Nonurgent referral, 71/2,771 (3%) had urgent referral
Training staff to use Digiscope required less than one hour.
Conlin et al55
2004-2005
RCT: 448 patients randomly assigned to teleretinal imaging or control: are patients screened with teleretinal imaging more likely to have a dilated eye exam within the next 12 months compared to usual care
Joslin Vision Network: Nonmydriatic Topcon TRC NW-5S with 3 stereoscopic 45° images + telemedicine to Beetham Eye Institute Department of Veterans Affairs (VA) Boston Healthcare System 98% male 88% white 10% African american, mean age: 67 yo
80/223 (36%) of patients had ungradeable images. Average ungradeable pupil diameter: 3.2 vs 4.1 mm for gradable images.
194/223 (87%) vs. 173/225 (77%) p < 0.01 had a
documented followup dilated eye exam within the next 12 months.
teleretinal imaging graded patients as having more DR compared to followup dilated eye exam ĸ = 0.42 (moderate agreement)
King 26
Study Technology Setting Ungradeable
Images Referral / % Screened Diabetic Retinopathy Comments
Cavallerano et al56
June 1999 – October 2000 Program description and retrospective evaluation Joslin Vision Network: Nonmydriatic Topcon TRC NW-5S with 3 stereoscopic 45° images + telemedicine to Beetham Eye Institute Joslin Diabetes Center Outpatient Intensive Treatment Program: 3.5 day multidisciplinary comprehensive diabetes counseling and evaluation Boston, MA 57% MA residents 53% DM1 68/525 (13%) had at least one
ungradable image. 50/61 (82%) of patients with ungradeable images had findings that would have resulted in referral. JVN diagnosis agreed with clinical exam by retina specialist within one level of DR for 478/ 535 eyes (89.3%)
268/525 (51%) patients referred: due to DR (17.1%), other disease (25.9%), ungradeable images (12.9%) or >12 months since last exam (11.4%) None (43.3%) Mild (30.7%) Moderate(8.3%) Severe (5.9%) Very Severe (3.9%) PDR < HR (2.8%) PDR > HR (2.1%) DME (3.6%) CSME (5.4%)
King 27
Results:
The MEDLINE search strategy returned 82 articles. Nine articles were identified which
met search criteria. No articles were found that addressed long-term patient centered health outcomes such as blindness or loss of visual acuity. Only one of the articles evaluated the effect of screening on treatment. Six studies directly addressed the implementation of the program’s
effect on screening rates for the diabetic population. Two studies took place in the setting of community health centers.
All six studies which evaluated the proportion of the population screened showed increased screening rates with implementation of a digital retinal imaging system. On average, screening rates improved by about 25% (range = 3%-63%) when compared to preimplementation
screening rates or to a control group; however, there was significant heterogeneity in study design, methods used for measurement, populations, and a wide range of improvement among
studies.
Farley et al.: Salud Family Health Center
Farley et al. is the most relevant study for this program plan and evaluation, since it was
conducted at a multisite community health center serving a largely uninsured Hispanic
population, similar to Piedmont Health Services. This is the only study that evaluated the impact on screening rates of resource sharing across multiple sites. Two cameras served six sites: a
camera was permanently installed at one clinic, and the second camera was transported between three clinics so that it was available twice yearly at each site. Patients from the other two clinics
King 28 camera achieved the highest screening rate (47%), while the 3 clinics that shared a camera had
lower rates (44%, 38% and 25%), and the two clinics who referred their patients included the lowest screening rates (26% and 21%). The authors explain that the wide variation in screening rates for clinics with intermittent camera availability is due to lack of standardization in
procedures used by the various clinics: some clinics were more aggressive than others in
recruiting patients and using the “no-missed-opportunities approach.” Interviews with clinicians
suggested that the intermittent nature of the camera availability made it less likely for them to remember to refer patients for screening. Although this study did not evaluate
preimplementation screening rates, they estimated historic screening rates in this population to be less than 10%.
They also described their method of recruitment. First, clinicians were informed of the
program and encouraged to schedule their patients for a screening appointment. They also sent letters to their patients encouraging them to schedule retinal screening appointments. Finally, in clinics where the camera was available, clinicians offered walk-in appointments at the
conclusion of clinic visits. One of the other strengths of this article is that it included the costs of the program: they spent $25,000/camera ($50,000 for two cameras) and $30,000/year/camera
operator.
One study limitation is how they determined screening rates: patients were considered screened if they had any photographs taken during the 3-year study period, regardless of whether
King 29 opacity, out of focus). This is not a patient-oriented outcome; rather, it is a measure of the
program’s activity.
Another interesting part of this study was the relatively large number of ungradeable images. Compared to the Vine Hill Study, where only 1/201 (0.5%) patients had images that
were deemed ungradeable, nearly one third of these patients had ungradeable images (302/1,040 = 29%). In the discussion section, the authors disclose that since the end of the study period,
they changed their protocol to use mydriatic drops as needed, and their inadequate photo rate is now less than 1%.
Farley’s study would be strengthened if they had included more information about patient
demographics, particularly age. Specifically, the number of patients with any level of DR
113/1,040 (10.9%) is low compared to the landmark prevalence studies LALES27 and Proyecto
VER,28 which demonstrated a DR prevalence of 47% and 48%, respectively, in Latino populations over the age of 40. Since Salud Family Health Center’s population is largely
composed of migrant workers, the discrepancy is likely due to a younger patient population.
Several lessons learned from this study can be applied for program implementation and evaluation. First, clinics with a permanent camera achieve higher screening rates. Second, the
number of ungradeable images can be drastically reduced with use of dilating drops. Third, to best evaluate the impact of a program, some evaluation has to be done before implementation so
that a measurement can be made and compared to the baseline. Finally, although the authors conclude that PCPs can be trained to interpret fundus photographs, I believe this is an
King 30 ophthalmologist reading the same images, why not use a telemedicine approach and transmit the
images to an expert via the internet? The authors concede that, “It would be difficult to develop a curriculum that could address all of the myriad abnormalities found in retinal examinations unrelated to diabetic retinopathy.”
Taylor et al: Vine Hill Community Clinic
The Vine Hill study was conducted in the setting of a single community health center
serving a largely indigent population. The preimplementation baseline DR screening rate was 23%, despite prior initiatives to improve rates consisting of provider education and clinical
reminder systems. After making digital fundus screening available, the screening rate improved to 59.2%. This still falls below the goal of 75% established by Healthy People 2000, but it shows that enormous improvement can be made in one year. The quality of evidence in this
article is excellent, given the explicitly described methods and strong study design.
The authors of the Vine Hill Study identified visual acuity testing as an important
component of any good fundus photography screening program, and they screened all patients using a desktop visual acuity testing machine (Optec 800X). Their protocol led to nearly half of all patients to be referred to ophthalmology (48.3%). Decreased visual acuity accounted for the
majority (50/97) of all referrals, and only 1/201 patients screened had an ungradeable image. In the discussion section, the authors attribute their low failure rate (ungradeable images) to
pharmacologic pupil dilation.
King 31 patients opted out of the screening: for the 495 diabetics seen during the year, only 201 (40.6%)
elected to have screening performed.
Wilson et al: Phoenix Indian Medical Center
Evaluation and measurement of short term program outcomes (treatment by laser photocoagulation) set this study apart from the others. The Indian Health Service’s EMR was
used to measure annual screening rates before and after installation of the Joslin Vision Network
(JVN). The screening rate increased from 50% to 75% over 3 years. Ancillary data showed a steady screening rate of about 50% over the same time period at a satellite clinic that did not
implement the intervention, which further bolsters the conclusion that the improvement in screening rates can be attributed to the addition of the retinal imaging technology. Likewise, the number of people treated for diabetic retinopathy increased from 19.6 per 1,000 diabetics in 1999
to 29.5 per 1,000 diabetics in 2003; however, the rate of treatment for diabetics screened remained stable: 39.2 per 1,000 screened were treated in 1999 vs. 39.3 per 1,000 screened in
2003. Thus, the increase in preventive treatment is due to improved surveillance.
Although the study had excellent internal validity, generalizability is limited because the Indian Health Service (IHS) operates the Indian Medical Center and the population of Native
Americans receive care with no out-of-pocket expenses. The authors claim they are comparable to general population since they have similar baseline screening rates to the general population
(about 50%), and describe the chief barrier to adherence as transportation.
King 32 Leiner et al’s model used a slightly different technology for screening. Whereas other
systems use a digital camera to acquire an image of the retina, Optomap utilizes a confocal scanning laser that captures a wider angle (130°) to include more of the peripheral retina. This seems to be a reasonable technology, but it is newer and less proven. Although a trial comparing
the Optomap to digital fundus photography has shown similar sensitivity and specificity for DR
screening,57 it has not been validated against the gold standard stereoscopic 7 field ETDRS photographs. Implementation of this screening method resulted in a small but statistically
significant increase in screening rates from 39.7% in 2005 to 44.3% in 2007 (p = 0.005). The authors attribute the relatively low increase in screening rates to, “staff training and technical
issues.”
Leiner’s evaluation is unique because they measured the program’s impact on no-show
rates for ophthalmology referral appointments and found slight improvement from 17.4% in
2005 to 23.6% in 2007.
Davis et al.: Primary Care in Rural South Carolina
Davis’s randomized controlled trial found that 23/30 (77%) of patients assigned to a
telemedicine retinal screening program obtained an eye examination compared to 4/29 (14%) of patients assigned to usual care, who were simply reminded to schedule an eye examination with
their eye care provider. This article was brief and did not provide a detailed description of the program, or report any other results.
King 33 Massin’s study evaluated whether a centralized DR screening location could serve a
larger population. A network of primary care clinics referred their diabetic population to a designated screening site. The authors demonstrated that similar screening rates could be achieved using a centralized retinal photography screening program (74.1%) compared to usual
care (71.5%) Secondarily, they evaluated patient satisfaction towards that screening method and found that 99.1% of patients screened were ready to have their next exam performed with a
nonmydriatic camera.
The remainder of the studies did not measure screening rates in the population; the
primary outcome measured was the level of DR detected and the reasons for referral.
Zimmer-Galler et al.: Digiscope in 51 Primary Care Offices
This program description and evaluation measured the referrals resulting from screening:
17% had non-urgent referral, 3% had urgent referral, and 11% were referred for ungradeable images. The authors claim that referral for ungradable image was not a drawback, “because
older individuals are at higher risk for ocular pathology and should be seen by an
ophthalmologist even if they do not have diabetic retinopathy.” A potential weakness of this study is the financial conflict of interest: the author is entitled to a share of sales royalty for
Digiscope cameras, owns stock and is a paid consultant for EyeTel Imaging.
Conlin et al: Veterans Affairs, Boston
Conlin’s study asked the question: does addition of teleretinal imaging increase the rate
King 34 dilated eye exams by an ophthalmologist annually. The authors credit the educational aspect of
their program for the increase in adherence to dilated eye exam within 12 months (87%) compared to usual care (77%), p <0.01. After completing the imaging protocol, the imager educated the participant about the importance of optimal blood glucose and blood pressure
control and demonstrated to the participant the basic anatomical structures of the ocular fundus (optic nerve, macula, retinal blood vessels). In this model, the screener also acts as a care
manager, contacting patients and facilitating follow-up visits. The educational component of the imaging encounter reinforced the need for regular eye care. This study has limited external
validity, since the population was mostly older white men. As patients age, they develop cataracts (lens opacities), and their pupils become smaller. These factors contributed to a large number of ungradable images (36%). Similar to Zimmer-Galler, Conlin et al further justify the
high rate of ungradable images with the argument that 56/80 (63%) of those with ungradable images had one or more ocular findings that warranted referral: cataracts (40%), glaucoma
features (23%), macular degeneration (16%) nevus (4%) and emboli (2%).
Cavallerano et al: Joslin Diabetes Center Outpatient Intensive Treatment Program
External validity of the study is limited because much of the study population was
designated as having DM1 (53.1%) based on the operative definition of insulin use and diabetes onset prior to age 40. The authors concluded that the low number of patients referred for retinal specialist examination who did not have eye disease on examination support its value in
follow-up and use in assessing patients with diabetes for eye examination.
King 35 While studies evaluating detection of diabetic retinopathy in the community using
nonmydriatic cameras go back as early as 1991, new technologies have constantly been adopted in an effort to improve the quality, convenience and efficiency while lowering cost. In the 1991 study by Higgs et al, 34% of patients had unreadable images. Therefore, while the study was
able to increase detection of DR in a rural population, it did a poor job of ruling out disease and required a high referral rate.58 More recently, the transition to digital imaging and the
transmission of acquired images over the internet have made a complex multistep process more streamlined. User-friendly image capture devices that can be operated by clinic staff in a
primary care setting have the potential to dramatically improve DR screening rates; however, some programs show only marginal improvement.
One issue that most studies addressed is whether or not to routinely employ
pharmacologic dilation (mydriasis) for patients undergoing screening. Of the nine studies included in this review, only two (Taylor et al and Zimmer-Galler et al) utilized mydriasis. The advantages of comfort and convenience with a non-mydriatic approach must be balanced with
the disadvantages of potential lower quality and higher proportion of ungradeable photos when compared to mydriatic photographs. Other studies show the proportion of ungradable photos
using nonmydriatic photographs range from 10-35% and drop to 2-7% when papillary dilation is used.59, 60 Farley et al report in the discussion section that since the end of the study period, they
changed their protocol to use mydriatic drops as needed, and their inadequate photo rate is now less than 1%. Some screening programs shy away from dilating patients because the very small
King 36 alone. The risk of inducing acute glaucoma with tropicamide and phenylephrine combined is
about 1 in 20,000.61 Applying these lessons to this program plan, the best approach is to first
attempt to acquire images without mydriasis. In case of poor image quality due to small pupils, the screener may use tropicamide for mydriasis, and reattempt image acquisition.
The percent of patients whose images were ungradeable was addressed in most studies.
At one end of the spectrum, Conlin et al report 80/223 (36%) of patients with ungradeable images. They found a significant correlation between smaller pupil sizes in ungradable vs.
gradable images (3.2 mm ± 0.1 vs 4.1 mm ±0.1, p <0.001), and attributed their high rate of ungradeable images to the rigorousness of the image grading protocol, “which used much higher
standards than are typically applied in a clinical setting.” A weakness in this argument is that the
qualities of a good DR screening exam should be to identify new cases of referable DR. The Joslin Vision Network (JVN) system appears to shift the balance of screening towards diagnostic
evaluation at the expense of time, convenience and flexibility that characterize successful screening programs.
This leads us to ask if the additional information gathered by seven stereoscopic images
per eye in the more rigorous JVN protocol are worth sacrificing convenience and simplicity? For this program plan, a single 45° image is recommended, since it provides sufficient
information for DR screening. Single field nonmydriatic imaging has shown excellent agreement (kappa = 0.97) with the diagnostic reference standard.36 . Furthermore, this
King 37 as having a marker for macular edema. Bresnick et al showed this strategy has a sensitivity of
94% for detection of clinically significant macular edema.62
The rate of referral varied from about 10-20% for most studies. The dominant reason for referral was diabetic retinopathy; however, other ocular pathologies were identified such as age
related macular degeneration, lens opacities, and features suggestive of glaucoma.
The evidence summarized in this literature review demonstrate that significant improvements in DR screening rates can be made by implementing a program in the primary
King 38 Program Plan
Overview
This plan describes a program for diabetic retinopathy screening at Piedmont Health Services (PHS), a federally qualified health center (FQHC) with six clinic sites in central NC:
Carrboro, Prospect Hill, Siler City, Scott (Burlington), Drew (Burlington) and Moncure. This document briefly addresses the context, theory and implementation of an innovative intervention that seeks to prevent vision loss among the diabetic population of PHS. The cornerstone of the
program is to improve patient adherence to screening guidelines among a population that has poor access to specialist care (annual dilated eye exams by an ophthalmologist). Placing a digital
retinal camera in the primary care setting will reduce barriers to access and increase the
proportion of patients screened in this population. In this manner, patients can be identified in the asymptomatic stage of diabetic retinopathy, and timely referral and treatment substantially
reduces the risk of vision loss.
Context of the Program plan
Overall, the context of the program plan can be characterized as welcoming, but guarded due to limited financial resources required for the initial investment. An agricultural analogy would
be that the program seed is falling on fertile soil, but a heavy rain of dollars is required before the program can begin to take root and grow.
King 39 have adapted over the years to accommodate a diverse population with a significant proportion
of minorities.
Likewise, studies show that patients prefer screening with a nonmydriatic camera in the
primary care setting compared to visiting an ophthalmologist. Results of a satisfaction survey in a prospective cohort study in France showed preference for the shorter duration of testing (96% compared to 82% for controls, p <0.001) and decreased visual impairment induced from
screening (86% compared to 66% with dilated exam, p<0.001). Indeed, 99.1% of patients from the experimental group were ready to have their next annual screening exam performed with a
non-mydriatic camera.53
Awareness about diabetes in general is already high among the public; however, more
patient education about preventing complications from diabetes is needed. This program plan will create a new opportunity for education by the staff at the time of screening. Patients will be
able to see the digital retinal image on the output monitor immediately after it is taken.
Considering the current economic climate, competing priorities are definitely an issue with PHS. In general, a wide range of needs must be met with funding from a small handful of
sources. Therefore, priorities must be designated so the most important needs are allocated resources as determined by both PHS and potential funders. The priorities of this program are
consistent with national, state and local priorities as outlined by Healthy People 2010, as well as Healthy Carolinians 2010.19, 31
King 40 GOAL: To prevent vision loss among persons with diabetes.
SHORT TERM OBJECTIVES:
By January 1, 2011, a nonmydriatic digital retinal camera will be acquired and installed in one clinic location
By January 1, 2011, at least 2 staff members will be trained in acquisition of digital retinal images
By January 31, 2011, at least 2 staff members will be proficient at acquiring images, with a 90% success rate
By December 31, 2012, 50% of adult diabetes patients at Piedmont Health Services (Moncure site) will be screened for diabetic retinopathy in the previous 12 months.
LONG TERM OBJECTIVES:
5 years after initiating the program, 75% of adult diabetes patients at Piedmont Health Services will be screened for diabetic retinopathy in the previous 12 months.
5 years after initiating the program, 90% of patients found to have vision threatening retinopathy will be referred and appropriately treated by a specialist.
10 years after initiating the program, 50% fewer patients will have vision loss due to diabetic retinopathy, compared to the previous 10 years.
10 years after initiating the program, total practice costs (including initial capital costs) will be offset by revenue generated.
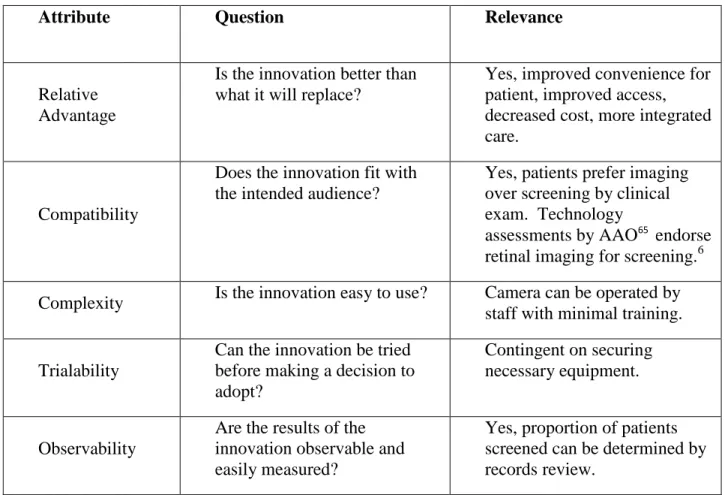
Relevant program theories
The diffusion of innovations is the most relevant program theory to apply to this program
plan. The central tenet behind this theory as defined by E. M. Rogers is, “the process by which an innovation is communicated through certain channels over time among the members of a social system.”63
King 41 primary care office with retinal imaging, rather than traditional screening by an eye
specialist. According to the diffusion of innovations theory, there are 5 benefits of an innovation which influence the degree it will be adopted, and if it will ultimately become institutionalized: relative advantage, compatibility, complexity, trialability and observability
(see Table 2).64 Analyzing the elements of the program through this theory helps to identify
and maximize its novel benefits. For example, in order to maintain the relative advantage for this screening program, the service must be more accessible and cost less than traditional
screening.
Table 2. Attributes of an Innovation
Attribute Question Relevance
Relative Advantage
Is the innovation better than what it will replace?
Yes, improved convenience for patient, improved access, decreased cost, more integrated care.
Compatibility
Does the innovation fit with the intended audience?
Yes, patients prefer imaging over screening by clinical exam. Technology
assessments by AAO65 endorse retinal imaging for screening.6
Complexity Is the innovation easy to use? Camera can be operated by staff with minimal training.
Trialability
Can the innovation be tried before making a decision to adopt?
Contingent on securing necessary equipment.
Observability
Are the results of the innovation observable and easily measured?
King 42 The process of adopting new technologies follows a bell curve with the following categories:
innovators (the first 2.5%), early adopters (next 13.5%), early majority adopters (next 34%), late majority adopters (next 34%) and laggards (final 16%). At the organizational level compared to other United States primary care providers, the program participants are innovators, since they
are on the cutting edge of adopting a new technology to enhance the quality of their health services. On a global scale, however, the United States falls into the early adopters category,
lagging behind innovators such as the UK and France who have instituted national screening programs using retinal imaging.
Secondarily, we can apply the CDC’s sociocultural environmental theory to demonstrate how
this program plan seeks to reduce health disparities. The sociocultural environment framework was created by the CDC’s Task Force on the Guide to Community and Preventive Services (see
Figure 1) to demonstrate how to target interventions to reach populations, not just individuals.66
In this program, the population that stands to benefit most is made up of those with diabetes and poor access to specialist care who attend the federally qualified health center (FQHC). This group is largely made up of an underserved low income Hispanics with poor access to eye care
providers and a high burden of suffering of a preventable disease. This program aims to create healthy populations at strategic intervention points 5 (opportunities for education and developing
capacity) and 6 (health promotion, prevention and care opportunities). Patient education occurs at the time of screening. The captured retinal images on the output screen can serve as a visual learning tool to assist patients in understanding the pathophysiology and asymptomatic nature of
King 43 strategic point 6 in the CDC’s sociocultural model, this program seeks to improve access to
King 44 Figure 1. Sociocultural Environment Logic Framework
Guide to Community Preventive Services: Sociocultural Environment Logic Framework
DETERMINANTS
SOCIETAL RESOURCES concerns the presence
of essential resources
while EQUITY and SOCIAL JUSTICE concerns the distribution
of those resources
within the population
IMMEDIATE OUTCOMES
*links 1-6 indicate strategic points for intervention
HEALTH OUTCOME
A pathway that will not be examined
' ' ' ' ' ' ---~
Source: Institute of Medicine. Speaking of Health: Assessing Health Communications Strategies for Diverse
King 45
Program Implementation
The first step in implementing the diabetic retinopathy screening program will be to develop
and document a protocol for the patient flow. Existing handbooks for DR screening can be tailored for PHS.67, 68 Besides serving as a set of instructions for acquiring the images, the
protocol should determine a schedule for rotating the resources among the separate branches of PHS. Since PHS has six separate sites, scheduling and transporting the equipment will need to
be carefully coordinated with the staff at all the sites. A well documented plan must be
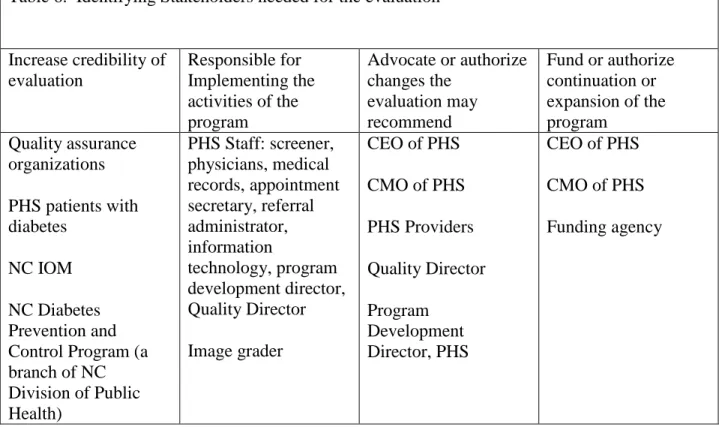
disseminated to the other stakeholders at PHS so they have an opportunity to contribute from its inception. Specifically, the physicians will be more likely to refer their patients for screening if
they approve of the overall design of the protocol. Likewise, the scheduling and referral staff need to be aware of when the screening resources will be available at their site.
Next, one of the most critical steps in the implementation plan is advertising and hiring a new staff member to actually conduct the screenings. This person will serve as a champion of the screening process from start to finish. Ideal traits for a candidate are excellent organizational
and communication skills, and a willingness to adapt. For a screening program with multiple locations, there has to be some constant factor that keeps things moving smoothly. The screener
will serve that vital role.
Ideally, the camera should be purchased before the screener is hired so that training can occur right away. The timeline assumes that outside grant funding has already been secured in
order to purchase the retinal camera, and a specific model has been selected. At the same time the camera is being installed and the screener is being trained, it is time to start advertising the
King 46 assist the physicians in educating their patients about the rationale for screening. Next, it is time
to deliver the program. Screening will take place per the protocol developed and revised by the stakeholders at the six PHS locations. In order to meet the goal of screening 75% of
approximately 3100 patients with diabetes at PHS, 2325 patients will be screened in a given
year. If screening is performed on 200 days/year, that translates to 11.6 patients/day. Inevitably, there will be some challenges the protocol did not anticipate early in the process, so the screener
will need the support of staff at the given location, as well as from the medical director to resolve problems.
After the images are acquired, they are electronically transmitted to an expert reader who
grades the image and provides a recommendation for follow-up. The reader sends this information in a report back to PHS medical records, who places the report in the patient’s
electronic medical record and mails a copy to the patient’s home address.
Sustainability
Regarding sustainability, it is an objective for this program to be able to fund itself in the long term; however, even after purchasing the initial equipment with grant funds, the revenues
gained from billing for this service may not offset the annual operating costs of the program. For the PHS population over the age of 20, 68% are uninsured, 8% have Medicaid, 8% have
Medicare and 16% have private insurance. If we apply these proportions to PHS’s 3100 patients
with diabetes (target audience), then we can generate a rough estimate for potential revenues (see Table 4). In North Carolina in 2010, CPT code 92250, Fundus photography with interpretation
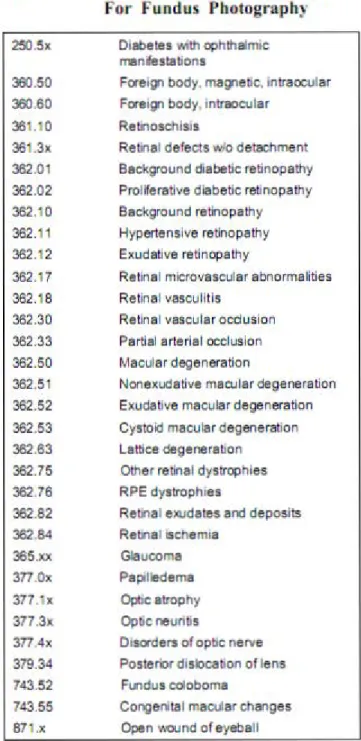
King 47 Reimbursement by other payors was assumed to be $0 for self-insured and Medicaid (free
service to those without insurance), and 110% of Medicare for private insurers. Medical necessity is designated by ICD-9 250.XX codes related to diabetes. Other ocular or systemic diseases may justify use of the camera for retinal screening, the most common are listed in
Appendix B.
Another issue that must be considered is the sustainability for the treating physician
(ophthalmologist). This program seeks to identify a subgroup of patients with low income and send them to specialists using existing referral patterns, but does not address funding or
reimbursement for treatment. Financial assistance including charity care at safety net hospitals
such as UNC discount a portion of the facility costs, but does not cover physician services fees. Other resources that provide financial assistance for preventive eye care are listed at Prevent
Blindness of North Carolina’s webpage (see Appendix C), but these are limited to children or U.S. citizens.
Besides financial sustainability, the project must have key champions who take clear
responsibility in maintaining and improving the program. The medical director of PHS will assume oversight of the program and reviewing its process improvement. It is critical that the
medical director of PHS has strong buy-in and feels that this is a worthwhile to direct the necessary resources for delivering the program. There must also be another key champion who oversees the day to day operations of the screening and shepherds the process through on a
regular basis. Since screening is a complex process and requires technical equipment, the process will inevitable fail without a champion who takes personal responsibility for managing
King 48 between the parties involved. This model assumes that the administrative tasks involved with
this program can be absorbed by the existing personnel and resources. In other words, the medical records staff will have additional information to include in the patient record, and the appointment secretary will be able to schedule screening appointments without additional
expenses. Finally, strong internal communication among all relevant parties at PHS will be required so that everyone understands and accepts their new roles and responsibilities.
Figure 2. Timeline for Program Implementation
Activity
2010 2011 2012
7 8 9 1 0
1 1
1
2 1 2 3 4 5 6 7 8 9 1 0
1 1
1
2 1 2 Develop screening
protocol X X Advertise for
personnel X X
Acquire and install
camera (Moncure) X X Hire personnel
X Train Personnel
X Advertise the
program X
Deliver the
program X X X X X X X X X X X X X X
Conduct process
evaluation X X X
Conduct outcome
evaluation X
Analyze outcomes,
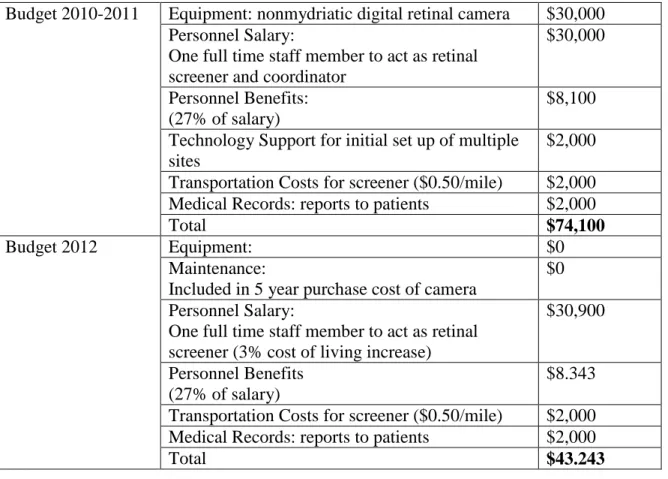
King 49 Table 3. Budget
Budget 2010-2011 Equipment: nonmydriatic digital retinal camera $30,000 Personnel Salary:
One full time staff member to act as retinal screener and coordinator
$30,000
Personnel Benefits: (27% of salary)
$8,100
Technology Support for initial set up of multiple sites
$2,000
Transportation Costs for screener ($0.50/mile) $2,000 Medical Records: reports to patients $2,000
Total $74,100
Budget 2012 Equipment: $0
Maintenance:
Included in 5 year purchase cost of camera
$0
Personnel Salary:
One full time staff member to act as retinal screener (3% cost of living increase)
$30,900
Personnel Benefits (27% of salary)
$8.343
Transportation Costs for screener ($0.50/mile) $2,000 Medical Records: reports to patients $2,000
Total $43.243
Table 4. Estimated Annual Revenue Generated from Screening
Payor (%) # of
diabetics % screened
Anticipated Number Screened
Reimbursement Totals
Uninsured 68% 2093 0.75 1570 $ - $ 0 Medicaid 8% 244 0.75 183 $ - $ 0
Medicare 8% 232 0.75 174 $ 41.28 $ 7,193.22 Private 16% 498 0.75 373 $ 45.41 $ 16,953.40
King 50 Table 5: Logic model
Resources/Inputs Activities Outputs Short & Long term Outcomes Impact Funding source for capital improvement (purchase retina camera) Planning resources PHS staff for coordinating appointments and capturing images PHS Clinicians Technical support for network connectivity Trained retina image reader Ophthalmologist for referral Data
Acquire and install camera Develop and implement screening protocol Train staff to screen patients Screen patients Educate patients Readers grade images and develop treatment plan Refer patients needing treatment to appropriate specialist Higher compliance with screening guidelines (% screened) More DR detected Referrals completed for those needing treatment (appointment attended and report returned and included in EMR) Patients informed of retinopathy status Increased awareness of vision complications to diabetes for providers and patients Increased awareness by patients of how to prevent vision loss from diabetes Increased access to preventive services. Increased referrals for treatment