"*'*1!BSS"-ABSTRACT
ACKNOWLEDGEMENTS
First of all, I want to thank my advisor. Dr. Cass T. Miller, for his constant
encouragement and guidance.
Thanks to Dr. Lucy Sonnenberg, Alex Mayer, Jim Jersey, and Joe Pedit for
their suggestions and assistance in developing analytical methods and experimental
protocol.
To my husband, David, and my lovely children, Cindy and Michael, I couldn't
have done it without your love and support.Thanks to de Numours & Co. for providing the analytical grade diuron.
Finally, my sincere appreciation goes to the United States GeologiccJ Survey
TABLE OF CONTENTS
Page
Abstract... ii
Acknowledgements... iii
Table of Contents... , iv
List of Tables... vii
List of Figures ... viii
Notation... x
Abbreviation... xii
1. Introduction... 1-1
1.1 Background and Motivation... 1-1
1.2 Objectives... 1-4
2. Literature Review... 2-1
2.1 Sorption Equilibria... 2-1
2.1.1 Sorption Equilibrium Models ... 2-1
2.1.2 Factors Affecting Sorption Equilibrium... 2-3
2.1.2.1 Solid Properties... 2-3
2.1.2.2 Solute Properties... 2-3
2.1.2.3 Temperature... 2-4
2.1.2.4 Sohd/Solution Ratio... 2-4
2.2 Desorption Equilibria ... 2-5
2.3 Sorption Rates ... 2-10
2.4 Desorption Rates... 2-10
2.5 Desorption Hysteresis Theories... 2-13
2.5.1 Nonattainment of Equilibrium... 2-13
2.5.2 Loss of Solute... 2-15
2.5.3 Artifact of Experimental Method... 2-15
2.5.4 Sorption to Nonsettling Particles... 2-16
2.5.5 Centrifugation Effect... 2-17
2.5.6 Accumulated Measurement Error... 2-17
2.5.7 Presence of Implicit-Sorbate... 2-17
2.5.8 Physical or Chemical Interactions ... 2-18
3. Materials and Methods... 3-1
3.1 Materials... 3-1
3.1.1 Solid... 3-1
3.1.2 Solute ... 3-1
3.1.3.1 Buffer Solution... 3-2 3.1.3.2 Diuron Standards... 3-4
3.1.4 Glassware... 3-4
3.2. Bottle-Point Methods... 3-4
3.2.1 Degradation Study... 3-5
3.2.2 Sorption Rate Studies ... 3-6
3.2.3 Desorption Rate Studies... 3-6
3.2.4 Sorption-Desorption Equilibrium Studies... 3-7
3.2.5 Sorption Age Study ... 3-7
3.2.6 Initial Concentration Study... 3-7
3.2.7 Other Sorption-Desorption Equilibrium Studies... 3-8
3.2.8 Single-Dilution Desorption Equilibrium Study... 3-9
3.3 Extraction Methods... 3-10
3.3.1 Solid-Phase Extractions... 3-10
3.3.2 GC Solvent Extraction... 3-11
3.4 Analytical Methods... 3-11
4. Experimental Results and Discussion ... 4-1
4.1 Degradation Study... 4-1
4.2 Sorption Rate Studies... 4-5
4.2.1 SoHd Concentration Effect... 4-5
4.2.2 Initial Concentration Study... 4-7
4.3 Desorption Rate Studies... 4-7
4.3.1 Sorption Age Effect on Desorption Rate... 4-7
4.3.2 Effect of Initial Concentration on Desorption Rate... 4-9
4.4 Sorption-Desorption Equilibrium Studies... 4-9
4.5 Complex pattern Sorption-Desorption Studies... 4-15
4.6 Single-Dilution Study ... 4-15
4.7 Normalized Desorption Equilibrium Model... 4-18
4.8 Desorption Hysteresis ... 4-23
5. Modeling of Experimental Results and Discussion... 5-1
5.1 Model Development... 5-1
5.1.1 Basic Assumptions... 5-1
5.1.2 Derivation of Algorithm... 5-1
5.1.3 Model VaUdation... 5-5 5.2 Model Parameters Determination... 5-8
5.3 Comparison of Experimental Data and Model Prediction .... 5-8
6. Conclusions and Recommendations ... 6-1 6.1 Conclusions... 6-1 6.2 Recommendations... 6-1
Appendix I. The Analytical Method of the Organic Carbon
Content of Solids... I-l
Appendix II. The Analytical Method of the Cation-Exchange
LIST OF TABLES
Page
2-1 List of Reported Linearity and Desorption Hysteresis of Sorption-De¬
sorption Isotherm... 2-6
2-2 List of Reported Sorption Equilibration Times in Sorption-Desorption
Experiments... 2-11
2-3 List of Reported Desorption Equilibration Times in Sorption-Desorp¬
tion Experiments... 2-14
2-4 Summary of Desorption Hysteresis Theories... 2-19
3-1 Physical and Chemical Properties of the Wagner Material... 3-2
3-2 The Operating Conditions of Diuron GC Analysis... 3-12
4-1 List of Experimental Conditions... 4-2
4-2 Soil Extraction Recoveries... 4-5
4-3 List of Freundlich Desorption Intensity Constants... 4-12
4-4 List of Freundlich Constants in Sorption-Desorption Equilibrium Ex¬
periments ... 4-22
LIST OF FIGURES
Page
2-1 Hysteretic Freundlich Sorption-Desorption Equilibrium Model .... 2-8 2-2 Normalized Freundlich Desorption Equilibrium Model... 2-9 3-1 Grain Size Distribution Diagram of the Wagner Material... 3-3 3-2 UV Response of Diuron and Azide... 3-13
3-3 Comparison of UV Data and GC Data (I)... 3-15
3-4 Comparison of UV Data and GC Data (II)... 3-16
4-1 Result of Liquid-Phase Solute Degradation Test... 4-3
4-2 Effect of Azide on the Rate of Sorption... 4-4
4-3 Effect of Solid Concentration on Sorption Rate... 4-6
4-4 Sorption Rate Studies... 4-8 4-5 Effect of Sorption Age on Desorption Rate... 4-10 4-6 Effect of Initial Concentration on Desorption Rate ... 4-11 4-7 Sorption-Desorption Equilibrium... 4-13 4-8 Short-Term Sorption-Desorption Equilibrium... 4-14 4-9 Comparison of SDDS Data to Sorption-Desorption Equilibrium Model . 4-16 4-10 Comparison of SDSD Data to Sorption-Desorption Isotherm Data . . . 4-17 4-11 Comparison of Single-Dilution Data to Consecutive-Desorption Model . 4-19 4-12 Normalized Desorption Data and Model Comparison ... 4-20
4-13 Comparison of Results from Different Desorption Equilibrium Studies . 4-21
5-1 Flowchart of Algorithm... 5-6 5-2 Validation of the Two-Site Model... 5-7
5-3 SSE as a Function of Km ... 5-9
5-6 Model Fit of Desorption Rate ...5-13
NOTATION
ABS' net absorbance.
C fluid-phase solute concentration (M/L^).
Co initial fluid-phase solute concentration {M(L^).
Ce equihbrium fluid-phase solute concentration (M/L^).
Cde desorption equihbrium fluid-phase solute concentration {M/L^).
Cjse sorption equilibrium fluid-phase solute concentration {M/L^).
Cme maximum equilibrium fluid-phase solute concentration {M/L^).
D mass of compound dissolved (Af).
foe mass fraction of organic carbon (M/M).
K Freundlich sorption capacity constant ((L^/M)").
Kd Freundlich desorption capacity constant {{Li^/M)^).
Kdf Freundlich desorption capacity constant associated with
fast-sites {{L^/MY).
Kds Freundlich desorption capacity constant associated with
slow-sites {{L^/MY).Kf Freundlich capacity constant associated with fast-sites
{{L^/MY)-Km mass transfer coefficient (1/T).
Koc organic carbon normalized partition coefficient (L^ /M).
Kow octanol water partition coefficient.
Kp linear equilibrium sorptive partition coefficient (L^/M).
Kp^oha observed equilibrium sorptive partition coefficient {L^/M).
Kg Freundlich sorption capacity constant ((L^/M)").
JCaa Freundlich sorption capacity constant associated with
slow-sites ((LVM)").
/, / + 1 old and new time level.
M mass of soil in reactor (M).
Mp mass of particle (M).
N mass of compound sorbed to nonsettling particles (M).
n Freiuidlich sorption intensity constant.
rid Freundlich desorption intensity constant.
nj Freundlich intensity constant associated with fast-sites.
rig Freundlich sorption intensity constant.
n^g Freundlich sorption intensity constant associated with
slow-sites.P mass of compound sorbed to settleable particles (M).
q solid-phase sorbate concentration {M/M).
q^c desorption equilibrium sohd-phase sorbate concentration {M/M).
9e equihbrium sohd-phase sorbate concentration {M/M).
qj solid-phase sorbate concentration associated with fast-sites {M/M).
1f,i=o solid-phase sorbate concentration associated with fast-sites
at < = 0 {M/M).
qg solid-phase sorbate concentration associated slow-sites [M/M).
qae sorption equilibrium solid-phase sorbate concentration {M/M).
qast sorption equilibrium solid-phase sorbate concentration associated with
slow-sites {M/M).
R mass of solid to volume of solution ratio {M/L^).
Rp ratio of the diuron peak aiea to the DCB peak area.
t time (T).
ABBREVIATIONS
atrazine 6-chloro-N-ethyl-N'(l-methylethyl)-l,3,5-triazine-2,4-diamine
bromacil 5-bromo-6-methyl-3-(l-methylpropyl)2,4-(lH,3H)pynmidinedione
2,4-D (2,4-dichlorophenoxy)acetic acid
DDT l,l'-(2,2,2-trichloroethylidene)bis[4-chlorobenzene]
diquat 6,7-dihydrodipyrido[l,2-2',l'-c]pyrazinendiiumion
diuron N'-(3,4-dichloropheny)-N,N-dimethylurea
fluridone r-methyl-3-phenyl-5-[3-(trifluoromethyl)phenyl]-4-(l-H)-pyridinone
HCBP 2,4,5,2',4',5'-hexachlorobiphenyl
lindane 7-1,2,3,4,5,6-hexachlorocyclohexane
linuron N'-(3,5-dichloropheny)-N-methoxy-N-methylurea
paraquat l,l'-diniethyl-4,4'-bipuridiniuni ion
PCB poly chlorinated biphenyl
picloram 4-amino-3,5,6-trichloro-2-pyridinecarboxylic acid
prometone 6-methoxy-N,N'-bis(l-niethylethyl)-l,3,5-triazine-2,4-diamine
prometryn N,N'-bis(l-metthylethyl)-6-(methylthio)-l,3,5-triazine-2,4-diamine
1 INTRODUCTION
1.1 Background and Motivation
Recently, more and more groundwater contamination has been reported, in¬ cluding leaking of subsurface storage tanks, leakage from the land disposal of haz¬ ardous waste, leaching of pesticides or herbicides applied to crops and lands, and so on. In order to prevent or remediate groundwater contamination, it is necessary to understand the fate and transport of contaminants in the subsurface environment. Many physical, chemical, and biological processes are involved in the transport of contaminants in groundwater systems, including hydrodynamic transport,
sorp-tion/desorption, volatilization, biodegradation, hydrolysis, and retention by plant
roots. Sorption is the physico-chemical process in which a substance is transferred from a liquid phase to a solid phase; the reverse reaction is called desorption. Sorption-desorption determines the relative fraction of the contaminant in the solid
and liquid phase. The contaminant concentration in each phase will subsequently
influence other processes. Therefore, it is important to know the sorptive charac¬ teristics of a contaminant to aquifer solids to predict contaminant transport.
Numerous investigations of organic solute sorption to aquifer solids have been
done. Most of these investigations have focused on single solute sorption equilib¬
phase distribution depends on the sorption history. When desorption hysteresis
occurs, the solid-phase sorbate concentration at desorption equilibrium is different
from-— usually higher than— that predicted from the sorption equilibrium equa¬
tion. If such behavior is manifest in the natural environment, any solute transport
model that does not account for the hysteretic nature of sorption-desorption would
produce inaccurate results. Therefore, it is important to have an understanding of
hysteresis.
Several possible explanations have been advanced to describe the observed
desorption hysteresis (Brusseau and Rao, 1989):
(1) Nonattainment of equilibrium
If sorption equilibrium is not attained before the desorption process begins, the
obtained sorption isotherm is not the true isotherm. Thus desorption equilibrium
obtained will be different from sorption equilibrium. Similarly, desorption hystere¬
sis may be incorrectly inferred if sorption equilibrium is attained but desorption
measurements are made on a system that has not achieved equilibrium.
(2) Loss of solute
Volatilization, chemical transformation (e.g. hydrolysis), sorption to the con¬
tainer wall, and biodegradation of the solute can occur during an equilibrium ex¬
periment. The solid-phase solute mass, hence concentration, is usually computed
as the difference between the original mass in the system, minus the mass removed
from the system, and minus the fluid-phase mass. Thus, any unaccounted for loss
in mass results in an overestimation of the solute concentration on the solid-phase.
(3) Artifact of experimental method
The traditional method applied to investigate desorption equiHbrium is the
successive-dilution technique, which uses a series of
centrifugation-dilution-resuspen-sion steps. It has been reported that the repeated process of resuspencentrifugation-dilution-resuspen-sion may cause
under normal conditions (McCloskey and Bayer,1986). The hypothesis is that the
soHd-phase weathering increases the sorption capacity of the solid phase— leading
to desorption hysteresis.
(4) Sorption to nonsettling particles
Failure to separate the dissolved organic matter (DOM), or nonsettling parti¬
cles (NSP), in the supernatant from the solution phase by centrifugation can cause
the washout of DOM. Because solvent extraction of a fluid-phase sample includes
solute bound to colloidal particles, apparent sorption equilibrium fluid-phase con¬
centrations are actually the sum of these two phases. If a large fraction of fine
particles are removed during the sorption step, the apparent desorption equilibrium
will result in a lower fluid-phase concentration for a given solid-phase concentration.
(5) Centrifugation effect
Repeated centrifugation may cause a partially irreversible compaction of the
solids, which increases the time required to re-establish desorption equilibrium giv¬
ing the impression of desorption hysteresis.(6) Accumulated measurement error
Measurement error is another disadvantage of applying the successive-dilution
method. This method may allow the small deviation of measurements in each step
to accumulate to a large overall error after the sample is handled several times.
(7) Implicit-sorbate
The existence of an implicit-sorbate (unidentified organic substances) that is
initially sorbed on the solids before the experiment starts and is released to the solu¬
tion phase during the sorption and desorption steps may give an increasing amount
of available sorption sites to an experimental solute. This increase of sorption sites
may lead to apparent desorption hysteresis.
(8) Physical or chemical interactions
to the solid phase during the sorption process. The bound sorbate may be desorbed only in part— when compared to the sorption equilibrium relationship—- by lowering the fluid-phase concentration.
These potential causes of desorption hysteresis are described in more detail in chapter 2.
1.2 Objectives
The objectives of this research are:
(1) to investigate experimentally a variety of possible explanations of the desorp¬
tion hysteresis phenomenon; and
(2) to develop a mathematical model to simulate the sorption-desorption process
2 LITERATURE REVIEW
This chapter will present a brief summary of research on rates and equilibrium of sorption-desorption, and desorption hysteresis. The literature reviewed includes discussion of types of sorption isotherms, linearity of isotherms, factors affect¬
ing sorption, characteristics of sorption-desorption processes (sorption-desorption
rates), and explanations of desorption hysteresis.
2.1 Sorption Equilibria
2.1.1 Sorption equilibrium models
Sorption of organic compounds to natural sorbents has been described as mass
transfer of compounds from a fluid-phase to a solid-phase. A solid-solute-solution
system is at sorption equilibriiun when the distribution of a solute between the
soUd-phase and the fluid-phase is no longer a function of time. The equilibrium relationship is described by a sorption equilibrium model, often referred to as a sorption isotherm model.
Both hnear (Sabljic', 1987) and non-Hnear (Weber and Miller, 1989) sorption
isotherms have been reported to describe the sorption equilibrium of organic com¬
pounds to natural sorbents . Four types of isotherms were devised, according to the
shape of the isotherm curves, to characterize the sorption mechanism of solutes by
sorption of solute (one-point attachment). The L-type isotherm, which is associated
with a system in which specific bonding sites exist, is most commonly observed in sorption of organic compounds to solids. The H-type isotherm, which indicates that a solute is easily sorbed by a sorbent, is a special case of the L-type isotherm. The
C-type isotherm is found in the sorption of solutes to porous media, usually within a
narrow solute concentration range resulting in a linear isotherm (Weber and Miller,
1989).
The linear isotherm model is
qe = KpC, (2-1)
where qe is the sorption equilibrium, mass-average, solid-phase sorbate concentra¬
tion; Kp is a linear partition coefficient; and Cg is the sorption equilibrium,
volume-average, solution-phase solute concentration.
The Freundlich equation is often used to describe the nonlinear sorption iso¬
therm data for organic compounds in natural solid-water systems (Weber and Miller,
1989). It is expressed as
Qe = KC: (2-2)
2.1.2 Factors affecting sorption equilibritma
2.1.2.1 Solid properties
Many researchers have reported that Kp is positively correlated to the organic
carbon content of the solid (Steen et al., 1978; Karickhoff et al., 1979; Peck et al.,
1980; Brown and Flagg, 1981; Horzempa and DiToro, 1983; Nkedi-Kizza et al.,
1983; Corwin and Farmer, 1984). The consensus of this work is that Kp is a linear
function of organic carbon content. Tliis is often expressed in equation form asKp = focKoc (2-3)
where foe is the mass fraction of organic carbon and Koc is the organic carbon
normahzed partition coefficient.
It was also found that sorption of organic compounds to montmorillonite and
kaolinite clay (low organic carbon content) may be approximated by the
cation-exchange capacity of the solid (Weber and Weed, 1968; Mustafa and Gamar, 1972;
Peck et al., 1980). In addition to cation-exchange capacity, surface area, chai-ge
density, and percent mineral content of the sorbent have also been reported to be
correlated with the partition coefficient (Weber and Weed, 1968; Horzempa and
DiToro, 1983; Corwin and Farmer, 1984; McCloskey and Bayer, 1986).
2.1.2.2 Solute proyerties
The partition coefficient that describes the linear equilibrium relationship can be estimated from the 1-octanol-water partition coefficient (Kow) of the solute and
the organic carbon content of the sorbent (Means et al., 1980; Schwarzenbach and
Westall, 1981; Chiou et al., 1983; Karickhoff, 1984). Sabljic' (1987) summarizes
empiri-cal models for predicting sorption equilibrium, and presents an alternative predictive
model based upon molecular connectivity of the solute.
Chiou et al. (1983) investigated the sorption of 12 aromatic compounds on a
Woodburn soil and found that the extent of solute insolubility in water is the pri¬
mary factor affecting the soil organic matter to water partition coefficient
(Kom)-Equilibrium isotherms of binaxy nonionic organic compounds indicated no compet¬itive effect between two solutes (1,3-dichlorobenzene and 1,2,4-trichlorobenzene).
This supported the hypothesis that sorption to the soil organic phase is a primary
process for sorption of nonionic organic compounds on soil.
2.1.2.S Tem-perature '
Temperature was found to be inversely correlated to the partition coefficient of
diuron by sediments (Peck et al., 1980). On the other hand, Horzempa and DiToro
(1983) reported a positive relationship between the temperature and the pai'tition
coefficient of PCB to sediments. This contradiction was attributed to factors other
than sorption equilibrium (e.g. kinetics, solubility etc.).
2.1.2.4 Solid/solution ratio
the solids concentration (O'Connor and Connolly, 1980).
2.2 Desorption Equilibria
Desorption is the reverse of sorption. It occurs when the solid-phase sorbate
concentration exceeds the level that would be in equilibrium with the fluid-phase solute concentration. A decrease of solution-phase solute concentration, a change
of solution composition, and a change of temperature are the major causes of des¬
orption (Miller, 1984).
Like sorption, the desorption process reaches a final distribution of solute
between the solid-phase and the solution-phase at equilibrium. Many contami¬
nant transport models assume that desorption equilibria may be described by the
same equilibrium relationship as sorption equilibria. However, several researchers
(van Genuchten et al., 1974; Koskinen et al., 1979; Peck et al., 1980; DiToro and
Horzempa, 1982, 1983; Koskinen and Chen, 1983; Isaacson and Frint, 1984; Corwin
and Farmer, 1984; Curl and Keoleian, 1984; Miller, 1984; Gschwend and Wu, 1985;
Bowman and Sans, 1985; JafFe, 1986; Uchrin and Mangels, 1987; Hermosin et al.,
1987; and McCloskey and Bayer, 1987) have observed that the desorption process is
hysteretic or nonsingular, i.e. desorption isotherms are different from the sorption
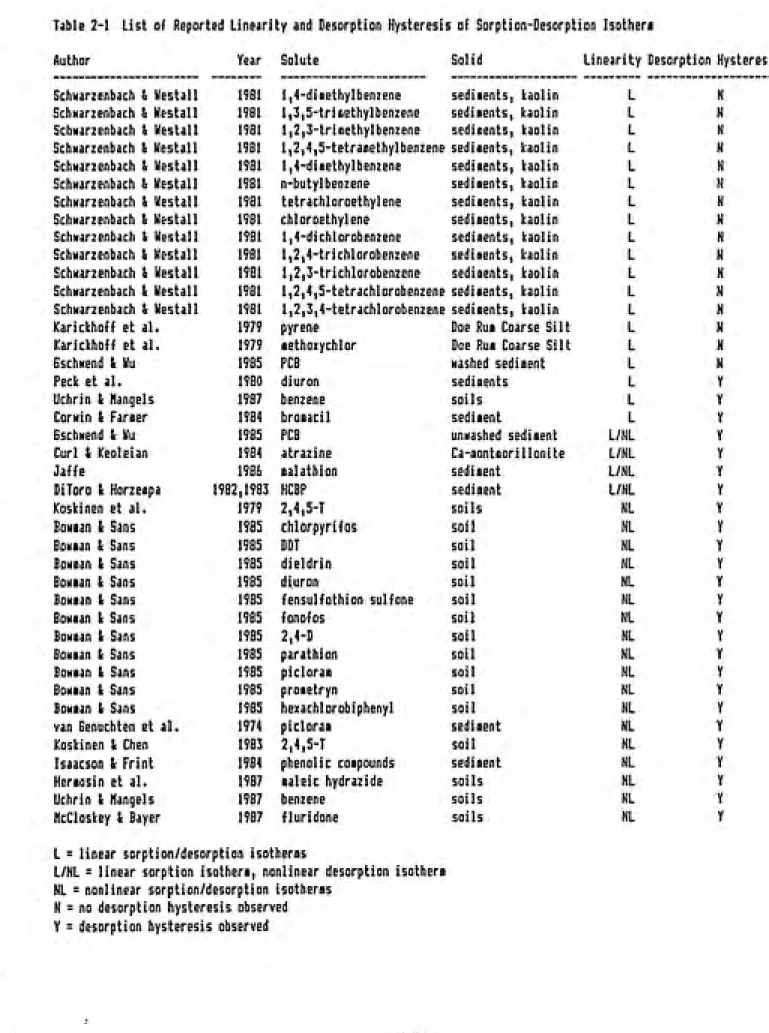
isotherm (see Table 2-1).
The Freundlich sorption-desorption equilibrium model has been used to de¬
scribe desorption hysteresis
9,e = KsC:: (2-4)
qde = KiCy^ (2-5)
Table 2-1 List oi Reported Linearity and Desorption Hysteresis of SDrption-Desorptian Isothera
Author Year Solute Solid Linearity Besorption Hysteresis
Schwarzenbach it Nestall 19Si l,4-dii!ethylbenzene sedisents, kaolin N
Schttarzenbach & tlestall 19BI 1,3,5-trifiBthylbenzene sediaents, kaolin N
Schttarzenbach 4 Westall 1981 1,2,3-trimethyl benzene sediments, kaolin N
SchHarzenbach & Kestall 19BI 1,2,4,5-tetraijethyl benzene sediaents. kaolin N
Schwarzenbach & Uestall 1981 1,4-dijiethylbenzene sediients, kaolin N
Schwarzenbach l Hestall 1981 n-butylbenzene sediaents. kaolin N
Schwarzenbach I Westall 1981 tetrachioroethylene sediaents, kaolin N
1981 chloroethylene sediaents. kaolin H
Schwarzenbach it Hestall 1981 1,4-dichlorobenzene sediaents. kaolin N
Schwarzenbach & Nestall 1981 1,2,4-trichlarobenzene sediaents. kaolin N
Schwarzenbach & Uestall 19B1 l|2,3-trichlarobenzenB sediaents, kaolin N
Schwarzenbach Si Uestall 1981 1,2,4,5-tetrachlDrobenzenE sediaents. kaolin N
Schwarzenbach Si Uestall 1981 1,2,3,4-tetrachlorDbenzEnE sediaents. kaolin N
KarickhoH et ai. 1979 pyrene Doe Rua Coarse Silt N Karickhoff et al. 1979 •ethoxychlor Doe Rub Coarse Silt N
Gschwend k Uu 1985 PCB washed sediaent Peck et al. 1980 diuron sediaents Uchrin k Hangels 1987 benzene soils Corwin J; Parser 19B4 broiacil sediaent
Gschwend ti Uu 1985 PCB unwashed sediaent L/NL
Curl ti Keoleian 1984 atrazine Ca-aontffior illonite L/NL
JaTfe 19Bi aalathion sediaent L/NL
DiToro ti Horzespa 1982,1933 HCBP sediaent L/NL Koskinen et al. 1979 2,4,5-T soils NL Bowaan & Sans 1985 chlorpyrifos soil NL
Bowaan i Sans 1985 DDT soil NL
BowBan I Sans 1985 dieldrin soil NL
Bowaan k Sans 1985 diuron soil NL
Bowtan k Sans 1985 fensulfothion sulfone soil NL
Bowian !i Sans 19B5 ^ono^os soil NL
Bowian k Sans 1985 2,4-D soil NL
Bowian ti Sans 1985 parathion soil NL
Bowian k Sans 1985 pidoran soil NL
Bowtan k Sans 1985 proietryn soil NL
Bowian k Sans 1985 hexachlorobiphenyl soil NL
van Benuchten et al. 1974 pidoraa sediaent NL
Koskinen ( Chen 1983 2,4,5-T soil NL
Isaacson k Frint 1984 phenolic coapounds sediaent NL HeriQsin et al. 1987 aaleic hydrazide soils NL
Uchrin ti Hanqels 1987 benzene soils NL
HcCloskey k Bayer 1987 fluridone soils NL
L = linear sorption/desorption isotheras
L/NL = linear sorption isothera, nonlinear desorption isothera
NL = nonlinear sorption/desorption isotheras N = no desorption hysteresis observed
Kd = K,C::,T' (2-6)
where qse is the sorption equilibrium, mass-average, solid-phase sorbate concen¬
tration; qie is the desorption equilibrium, mass-average, solid-phase sorbate con¬
centration; Cae is the sorption equilibrium, volume-average, solution-phase solute concentration; Cde is the desorption equilibrium, volume-average, solution-phase
solute concentration; Cme is the maximmn equilibrium, volume-average,
solution-phase solute concentration; Kg is a sorption capacity constant; Kd is a desorption
capacity constant; n^ is a sorption intensity constant; and Ud is a desorption in¬
tensity constant. A typical sorption-desorption isotherm that includes hysteresis is
shown in Figure 2-1.
For the Freundlich desorption equilibrium model, the desorption equilibrium
path is dependent upon the maximum solid-phase sorbate concentration. Different
desorption capacity constants {Kd) correspond to different sorption equilibrium
concentrations (5ae,
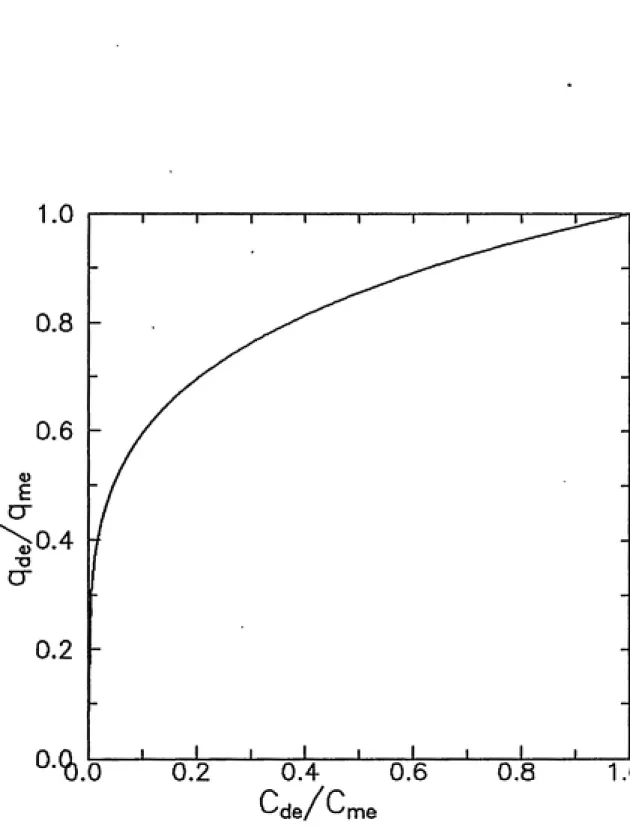
Cje)-Brusseau and Rao (1989) presented a normalization procedure to simplify the desorption isotherms. In this procedure, the desorption series were normalized to
derive one equivalent desorption isotherm by using the equation
qdelqm. = {CdelCmeT' (2-7)
where qmt is the maximum equilibrium solid-phase sorbate concentration; and Cme is the maximum equilibrium solution-phase solute concentration. This equation
is predicated upon the assumption that Ud 7^ f{Cme)- An example normalized
2.0
1.6
1.2
cr
en
Oo.8
0.4
0.0
T---r 1---r I r
--- Sorption Equilibrium Model
~ — Desorption Equilibrium Model
J_______I_______L I I_______L
-1.0 ͣ0.6 ' -0.2 0.2
Log Ce
0.6 1.0
1.0
0.8
0.6
E
cr
0)
cr
0,4
0.2
0.
%,
0I 1 I I I I______I______L
0.2 0.4 0.6
Cde/C,
'me0.8 1.0
2.3 Sorption Rates
The rate of the sorption process is important in assessing contaminant transport in groimdwater systems, because it determines the time required to reach sorption
equiUbrium. If the sorption rate is rapid, an assumption of instantaneous
equihb-rium between the solute and the soHd is feasible— greatly simplifying the analysis
of contaminant transport in such systems. The rate of sorption is dependent on both solute properties and solid characteristics. An inverse relationship was noted
between the octanol-water paxtition coefficient of a solute and the time required
to reach equilibrium (Wu and Gschwend, 1986). It may take a long time (months
to years) for some hydrophobic solute-natural solid systems to reach trvie sorption
equilibrium (Miller, 1984; KarickhofF, 1984; Coates and Elzerman, 1986). Reported
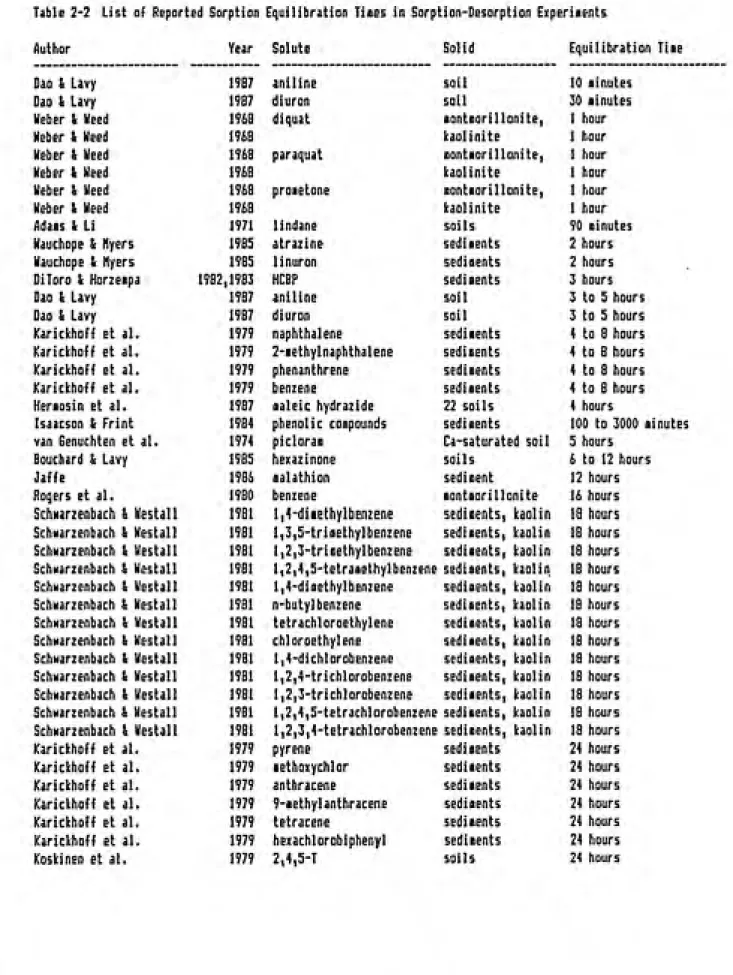
times required to reach sorption equilibrium have ranged from a few minutes to years (see Table 2-2).
2.4 Desorption Rates
Desorption rate has often been assumed to be the same as the sorption rate in
equilibrium studies performed to date (Mustafa and Gamar, 1972; van Genuchten et
al., 1974; KarickhofF et al, 1979; Koskinen et al., 1979; Peck et al., 1980;Schwarzen-bach and Westall, 1981; DiToro and Horzempa, 1982, 1983; Koskinen and Chen,
1983; Corwin and Farmer, 1984; Bouchard and Lavy, 1985; Bowman and Sans, 1985; Gschwend and Wu, 1985; JaiFe, 1986; Hermosin et al., 1987; McCloskey and Bayer,
Table 2-2 List of Reported Sorption Equilibration Tines in Borption-Desorption Experiients
Author Year Solute Solid Equilibration Tiie
Dao & Lavy 1987 aniline soil 10 ainutes
Dao & Lavy 1987 diuron soil 30 ainutes
Ueber k Heed 1968 diquat ͣonteorill onite. 1 hour
Heber & Need 1968 kaolinite 1 hour
Heber & Meed 1968 paraquat Bontaorillonite, I hour
Heber & Need 196G kaolinite 1 hour
Neber l> Weed 1968 prooetone Bontiorillonite. 1 hour
Heber & Heed 1968 kaolinite 1 hour
fldass & Li 1971 lindane soils 90 ainutes
Hauchope S: Hyers 19B5 atrazine sedisents 2 hours
Hauchope l Myers 1985 linuron sediaents 2 hours
DiToro k Horzeapa 1982,1983 HCBP sediients 3 hours
Dao & Lavy 1987 aniline soil 3 to 5 hours Dao & Lavy 1987 diuron soil 3 to 5 hours Karickhoff et al. 1979 naphthalene sediaents 4 to 8 hours
KarickhoH et al. 1979 2-flethylnaphthalene sediments 4 to 8 hours Karickhoff et al. 1979 phenanthrene sediaents 4 to 8 hours Karickhoff et al. 1979 benzene sediaents 4 to 8 hours HerfiQsin et al. 1987 aaleic hydrazide 22 soils 4 hours
Isaacson It Print 1984 phenolic conipounds sediaents 100 to 3000 ainutes
van Genuchten et al. 1974 pidorai Ca-saturated soil 5 hours
Bouchard 8t Lavy 1985 hexazinone soils 6 to 12 hours Jaffe 1986 aalathion sedinent 12 hours Rogers et al. 1980 benzene aontaorillonite 16 hours
Schnarzenbach & Hestall 1981 I,4-di«ethylbenzene sediaents, kaolin la hours
Schxarzenbach i Westall 1981 1,3,5-triiiethylbenzene sediaents, kaolin IB hours
Schwarzenbach I Westall 1981 1,2,3-triiiethylbenzene sediaents, kaolin 13 hours SchMarzenbach & Hestall 1981 1,2,4,5-tetra«ethylbenzene sediisents, kaolin IB hours
Schwarzenbach l Hestall 1981 1,4-difflethylbenzene sediaents. kaolin 18 hours SchMarzenbach & Hestall 1981 n-butylbenzene sediaents, kaolin IB hours
SchHarzenbach Si Hestall 1981 tetrachloroethylene sediaents, kaolin 13 hours
Schwarzenbach k Hestall 1981 chloroethylene sediaents, kaolin 18 hours
Schwarzenbach & Hestall 1981 1,4-dichlorohenzene sediaents. kaolin 18 hours
Schwarzenbach l Hestall 1981 1,2,4-trichlorobenzene sediaents, kaolin IB hours
Schwarzenbach h Hestall 1981 1,2,3-trichlorobenzene sediaents. kaolin 18 hours Schwarzenbach & Hestall 1981 1,2,4,5-tetrachlorDbenzenE sediaents. kaolin 18 hours
Schwarzenbach h Hestall 1981 1,2,3,4-tetrachlQrQbenzenE sediaents, kaolin 18 hours Karickhoff et al. 1979 pyrene sediaents 24 hours Karickhoff et al. 1979 ͣethoxychlor sediaents 24 hours Karickhoff et al. 1979 anthracene sediaents 24 hours
Karickhoff et al. 1979 9-flethylanthracenB sediaents 24 hours
Table 2-2 continued
Author Year Solute Solid Equilibration Tiie
BoHtan k Sans 1985 chlorpyrifos soils 24 hours Bowiian l Sans 1985 DDT soils 24 hours BoHian tc Sans 1985 dieldrin soils 24 hours
BoMian ii Sans 1985 diuron soils 24 hours
BoMian it Sans 1985 ^ensuHothion suHone soils 24 hours
BoHian I Sans 1985 fonofos soils 24 hours BoNian & Sans 1985 2,4-D soils 24 hours 1985 parathion soils 24 hours BoMian ti Sans 1985 picloran soils 24 hours
BoMian & Sans 1985 proietryn soils 24 hours Hustafa St Basar 1972 diuron soils 24 hours Peck et al. 1980 diuron sedinents 24 hours Nkedi-kizza et al. 1987 atrazine soil 24 hours Nkedi-kizza et al. 1987 aniline soil 24 hours Koskinen k Chen 1983 2,4,5-T soil 24 hours ChiQU et al. 1983 benzene soil 24 hours
Chiou et al. 1983 ethylbenzene soil 24 hours ChiDU et al. 1983 chlorobenzene soil 24 hours
Chiou et al. 1983 anisole soil 24 hours Chiou et al. 1983 1,2-dichlorobenzene soil 24 hours Chiou et al. 1983 1,3-dichlorobenzene soil 24 hours Chiou et al. 1983 1,4-dichlorobenzene soil 24 hours Chiou et al. 1983 1,2,4-trichlQrobenzene soil 24 hours Chiou et al. 1983 2-PCB soil 24 hours Chiou et al. 1983 2,2'-PCB sail 24 hours Chiou et al. 1983 2,4'-PCB sell 24 hours Chiou et ai. 19B3 2,4,4'-PCB soil 24 hours CorHin i Farier 1984 bronacil sediaent 48 hours
Cornin k Farter 1984 diquat sedieent 48 hours Sschwend k Hu 1985 PCB sediaent 48 hours
Heber k Hiller 1988 nitrobenzene aquifer sands 100 hours Heber & Hiller 1988 lindane aquifer sands 100 to 200 hours McCloskey k Bayer 1987 fluridone soil 6 days
Killer 1984 lindane soils longer than 7 days KarickhoH 1984 organic pollutants sediaent or sail weeks to aonths
Elzerman (1986) also indicated that if the desorption process was initiated after at¬
tainment of sorption equilibrium, the desorption rate for a hydrophobic solute a^ a
function of sorbent concentration should be constant if particles did not aggregate.
However, if particle aggregation occurred during the sorption-desorption process,
the desorption rate would become slower due to the increasing length of diffusion
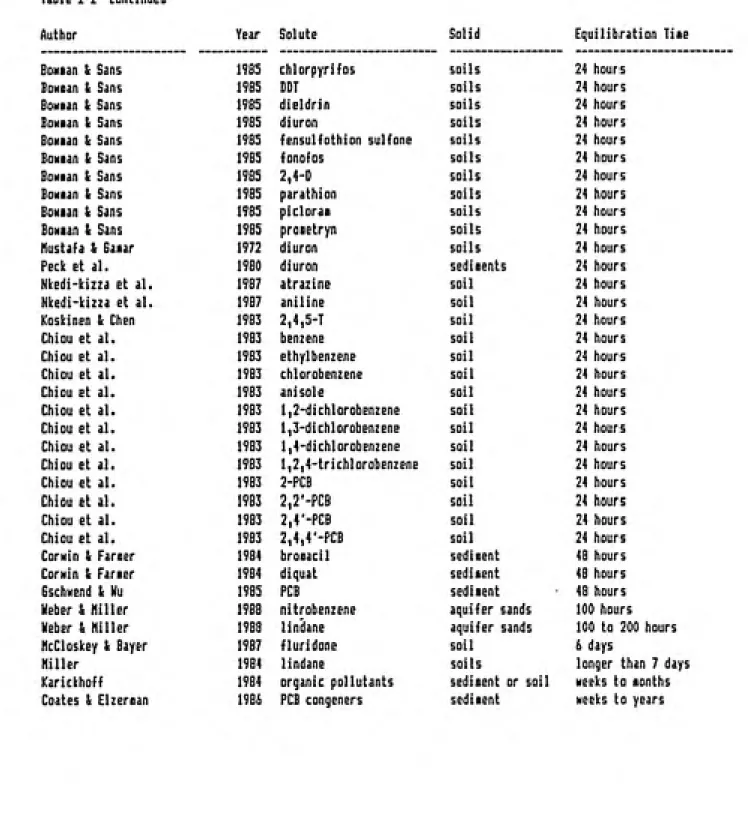
path. Reported desorption equilibration times in sorption-desorption experiments
are listed in Table 2-3.
2.5 Desorption Hysteresis Theories
The mechanism of desorption hysteresis is not well understood; several possible
explanations to describe this phenomenon include nonattainment of equilibrium,
loss of solute, artifact of experimental method, sorption to nonsettling particles,
centrifugation effects, accumulated measurement error, presence of implicit-sorbate,
and physical or chemical interactions. This section will briefly summarize each of
these theories.
2.5.1 Nonattainment of equihbrium
If sorption equilibrium is not established before the desorption process is ini¬
tiated, the observed sorption relationship is not the true equilibrium distribution.
Thus, the desorption relationship obtained will be different from the obtained sorp¬
tion isotherm. Miller (1984) observed desorption hysteresis in experiments of short
equilibration times (24 to 48 hours), but no desorption hysteresis was observed in
experiments of longer equilibration times (7 to 20 days).
Table 2-3 List of Reported Desorption Equilibration Tiaes in Sorption-DesDrption Experiaents
Author Year Solute Solid Equilibration Ti«e
DiToro & Horzeapa 1982,1983 HCBP sediaents 2 hours
van Senuchten et al. 1974 pidorat Ca-saturated soil 5 hours
Bouchard I Lavy 1985 hexazinone soils 6 hours
Heriosin et al. 1987 ealeic hydrazide 22 soils 12 hours
Jaffe 1986 nalathion sediaent 12 hours
Schwarzenbach It Hestall 1981 1,4-diBethylbenzenB sedijients, kaolin 18 hours
SchNarzenbach & Uestall 1981 1,3,5-triiiethylbenzene sediaents, kaolin 18 hours
Schwarzenbach & Mestall I9B1 1,2,3-triaBthylbenzene sediaents. kaolin 18 hours Schwarzenbach tt Westall 1981 1,2,4,5-tetraaethylben2en6 sediaents, kaolin 18 hours
SchHarzenbach k Nestall I9BI l,4-dii!ethylbenzene sediaents. kaolin 18 hours
Schwarzenbach k Uestall 1981 n-butylbenzene sediaents, kaolin 18 hours SchMarzenbach k Westall 1981 tetrachloroethylene sediaents, kaolin 18 hours
SchMarzenbach k Uestall 1981 chloroethylene sediaents. kaolin 18 hours
SchHarzenbach k Uestall 1981 1,4-dichlorobenzene sediaents, kaolin 18 hours
SchMarzenbach k Uestall 1981 1,2,4-trichlorobenzenB sediaents. kaolin 18 hours SchMarzenbach k Uestall 1981 1,2,3-trichlarobeniene sediaents. kaolin 18 hours
SchMarzenbach k Uestall 1981 1,2,4,5-tetrachlQrobenzBnB sediaents, kaolin 18 hours
SchMarzenbach k Uestall 1981 1,2,3,4-tetrachlorQhBnzene sediaents, kaolin 18 hours flustafa k Saoar 1972 diuron soils 24 hours Peck et al. 1980 diuron sediaents 24 hours Koskinen k Chen 1983 2,4,5-T soil 24 hours
HcCloskey k Bayer 1987 fluridone soils 24 hours
KarickhoH et al. 1979 pyrene Doe Rui Coarse Silt 24 hours Karickhoff et al. 1979 aethoxychlor Doe Rua Coarse Silt 24 hours Koskinen et al. 1979 2,4,5-T soils 24 hours BoHian k Sans 1985 Chlorpyrifos soils 24 hours BoHsan k Sans 1985 DDT soils 24 hours BoMian k Sans 1985 dieldrin soils 24 hours BoHian k Sans 1985 diuron soils 24 hours BoMian k Sans 1985 fensulfothion suHone soils 24 hours Bowian k Sans 1985 fonofos soils 24 hours BoMsan k Sans 1985 2,4-D soils 24 hours BoMnan k Sans 1985 parathian soils 24 hours BoMian k Sans 1985 pidoraa soils 24 hours Bowian k Sans 1985 proietryn soils 24 hours BoHian ti Sans 1985 hexachlorobiphenyl soils 24 hours CorMin k Faraer 1984 broaacil sediaent 48 hours CorNin k Famer 1984 diquat sediaent 48 hours
GschNend & Hu 1985 PCB sediaent 43 hours
Hiller 1984 lindane soils longer than 7 days Coates k Elzeraan 1986 PCB (less than 4 CI ataas) sediaent 6 weeks
corresponding sorption rate (Hance, 1967; Isaacson and Frink,1984; Bouchard and
Lavy,1985), and a longer time would be required to reach desorption equilibrium.
If the desorption equilibrium is not attained, solid-phase concentration would be higher than the true equilibrium value— giving a solute phase distribution suggest¬
ing hysteresis. Under such conditions, the calculated sorbate concentration would
be greater than the true equilibrium sorbate concentration, causing the deviation of desorption isotherms from the sorption isotherm (Corwin and Frint, 1984).
2.5.2 Loss of solute
Loss of solute has been reported as a key reason for desorption hysteresis. During the sorption-desorption experiments, volatilization, biodegradation, chem¬
ical decomposition, and sorption to the container walls can cause loss of solute.
Due to the mass-balance method usually used to compute the sorbate concentra¬
tion, any solute lost will be assumed to exist on the solid phase. This will result
in an overestimation of the sorbate concentration and apparent desorption hys¬
teresis (Koskinen, O'Connor and Cheng,1979; Rogers, McFarlane and Cross, 1980;
Bouchard and Lavy, 1985; Hermosin, Cornejo and Rodriguez, 1987).
2.5.3 Artifact of experimental method
The use of the suspension-centrifugation-resuspension method in batch reactor
sorption-desorption isotherm experiments has been reported as a possible cause of
hysteresis. The repeated suspension may cause weathering of the solid thereby
increasing available sorption sites. Also, the repeated washing of the solids (adding
a solute-free solution to the decanted soil sample) may alter the organic matter of
the solid and reveal additional sorption sites. Both procedures may increase the
2.5.4 Sorption to nonsettling particles
Sorption of solutes on nonsettling organic particles (NSPs) may also cause
apparent desorption hysteresis. Sorbates sorbed to soluble organics or colloidal
particles may not be separated by centrifugation and could thus be incorrectly
reported as free chemicals in solution. Under such circumstances, the apparent
sorption equilibrium solute concentration actually includes both free solute and
solute sorbed to colloidal particles, thus overestimating the sorption equilibrium
solute concentration. Also, nonsettling organic particles may be removed from the
system during decanting of the soil samples, resulting in a smaller amount of NSPs
remaining in the batch reactor. A decrease in NSPs during desorption steps can
lead to lower apparent fluid-phase concentrations compared to the apparent sorption
equilibrium relationship, hence apparent hysteresis. Both of the above situations
can cause erroneous equilibrium interpretations (O'Connor and Connolly, 1980).
Gschwend and Wu (1985) described the NSP effect by presenting the equation
^P-"''- (D + N)/V l^ »i
where Kp^obs is the observed partition coefficient; P is the mass of compound sorbed to settleable particles; Mp is the mass of particles; D is the mass of compound
dissolved; JV is the mass of compound sorbed to NSPs; and V is the volume of water.
If the suspended solid loadings are small, such that D ^ N, then Kp^oba ~ i'^p-However, if the suspended solid loadings are large such that D is not much greater
than N^ then Kp^obs < ^p- Gschwend and Wu conducted sorption-desorption equi¬
2.5.5 Centrifxigation effect
Browman and Sans (1985) investigated the cause of hysteresis by using the consecutive-desorption method (which uses a series of centrifugation steps) and a single-dilution method (which uses centrifugation only once for all samples). The
results showed that the isotherm obtained using the single-dilution method exhib¬
ited considerably less hysteresis than the isotherm obtained using the
consecutive-desorption method. They postulated that repeated centrifugation might cause a
partially irreversible compaction of the solids, which would greatly increase the
desorption time required to re-establish equilibrium.
2.5.6 Accumulated measurement error
The consecutive-desorption (or successive-dilution) technique applied in des¬
orption isotherm studies requires several successive sampling steps. Individual mea¬
surement error in each step may accumulate to give a large overall error, resulting
in a deviation of desorption isotherms from the sorption isotherm (Brusseau and
Rao, 1989).
2.5.7 Presence of implicit-sorbate
Curl and Keoleian (1984) presented an implicit-sorbate model to explain the hysteresis in sorption-desorption of organic chemicals to natural sorbents. The
model is based on competitive sorption between two sorbates, the one under study
and the implicit one which was initially sorbed on the sorbent. The implicit-sorbate
could be any unidentified organic substances that were sorbed on the sorbent before the experiment started. During the sorption-desorption experiments, the
implicit-sorbate desorbs and reveals more sites for the solute under study, thus increasing
/
/
2.5.8 Physical or chemical interactions
Horzempa and DiToro (1982,1983) investigated the reversibility of
sorption-desorption of hexachlorobiphenyl (HCBP) on sediment, and postulated a
two-component theory. Nonattainment of equilibrium, loss of solute, and centrifugation
eiFects were found not to be the causes of desorption hysteresis. They attributed
the desorption hysteresis to the formation of HCBP-sediment bonds of different
strengths, described by a readily desorbed reversible component and a component
resistant to desorption.
The related research about desorption hysteresis is briefly summarized in Table
Table 2-4 Suasary of Desarption Hysteresis Theories
Author Year Solute Solid
Koskinen et al. 1979 2,4,5-T soils
Explanation of Desorption Hysteresis
DiToro k HorzEftpa 1982,1983 HCBP
Koskinen it Chen
Isaacson ( Print
CorMin l Far«er
Curl k Keoleian GschNend k Uu
BoMsan k Sans
Jaffe
HeriQsin et al.
McClosdey & Bayer
1983 2,4,5-T
1984 phenolic coapounds
1984 bronacil, diquat
1934 atrazine 1985 PCB sedifients Palouse silt loaffi soil sedisient sedinent Ca-ffiontiiorillonite sedisent
1985 chlorpyrifos, DDT, soils
dieldrin, diuron, fensulfothion sulfone,
fonoofos, pidorani
parathion, pronEtry, ,4-D, hexachlorabipyenul
i93& fialathion
1987 naleic hydrazide
1987 fluridone
sedisent
soils
soils
loss of solute
(biochesical degradation)
fomation of HCBP-sedisent bonds of
different strengths
(reversible + resistant canpanents)
artifact of eisperiaental iiethod,
physical/chesical properties of the soil/water systee were changed in sorption-desorption processes
nonattainiient of equilibriui, a fraction of sorbate was irreversibly held by sediient nonattainaent of equilibria presence of iaplicit-sorbate
sorption to non-settling particles
incoaiplete phase separation
centrifugation effect
cuJipact of sorbent by centrifugal force,
loss of sorbate,
instability of solute in soil-water systea
sorption to non-settling particles
loss of solute
(precipitation and/or biodegradation)
3 MATERIALS AND METHODS
3.1 Materials
3.1.1 Solid
A subsurface solid sample (Wagner) was collected from Ann Arbor, Michigan.
The Wagner sample was air-dried and passed through a 2-mm sieve before use.
The physical and chemical properties of the Wagner material are listed in Table
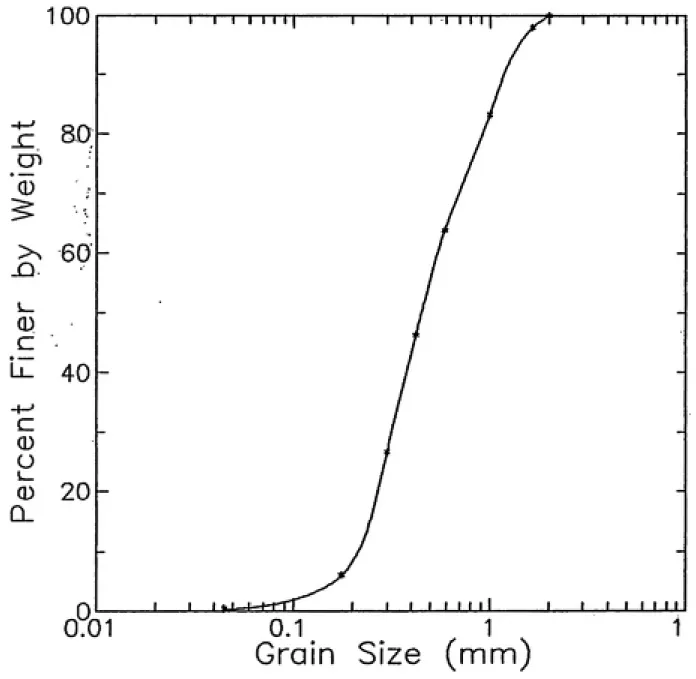
3-1. A grain size distribution diagram of the Wagner material is shown in Figure
3-1. Grain size analysis of the Wagner sample was done by fractioning with sieves of
different opening sizes. Organic carbon content of the Wagner sample was analyzed
by the ampule method with an O.I. Corporation Model 700 TOG analyzer. The
cation-exchange capacity was determined by the sodium saturation method (Black,
1965). Detailed experimental procedures for the determination of the organic car¬
bon content and the cation-exchange capacity are described in Appendix I and II,
respectively.3.1.2 Solute
Diuron [3-(3,4-dichlorophenyl)-l,l-dimethylurea] is a herbicide of relatively low
water solubihty (42 mg/1 at 25"C) and is widely used for selective long-term weed
Table 3-1 Physical and Chsnical Properties of the Kagner Material
Median grain size diameter 0,45 an
Grain size uniforsity coefficient 2.476
Organic carbon content 1.2 I
Cation-exchange capacity 3 neq./lOO g soil
tree and bush fruits. The mean value of logiiTou, (octanol-water partition coefficient)
of diuron is 2.92 (Hansch and Leo, 1979). Phototoxic residues of diuron in soil
disappeared within one season at application rates of 0.6 to 4.8 kg/ha (The Pesticide
Manual, 1983). Its rate of hydrolysis is negligible at ordinary temperatures and
neutral pH . It decomposes at 180 to 190° C and is degraded in soil by demethylation,
50% loss was reported in 90 to 180 days (Sheets, 1964). Diuron is a stable chemical
of fairly long persistence in soil. Since it is highly persistent in soil, it constitutes a
possible residue hazard.
Preliminary studies showed diuron is non-volatile (the vapor pressure of diuron
at bQ°C is 3.1 X 10"^ mm Hg), doesn't degrade in a buffer solution of pH 8.42, and
can be analyzed by gas chromatography or UV spectroscopy. Diuron was cliosen as
the target compound for this work because it is easy to handle in lab experiments,
convenient to analyze for concentration, and potentially a hazardous residue in
subsurface systems. Analytical grade diuron (98%) was obtained from de Nemours
h Co. and it was used as received.
3.1.3 Reagents
3.1.3.1 Buffer solutions
exper-100
80
u^
CD
>> 60 o
L-0)
c
Ll. 40
-4-'
c
CD
U
L_
(D 20
n
"1---1—I I f I I 11---1---1—\—r I I I 11---7t---1—II I If r
0%
I I I I I___r I I I I I I_______I____I___I I M I I
0.1 1
Grain Size (mm)
iments. It contained tetraborate, calcium chloride dihydrate, and sodium azide.
Tetraborate was used in the experiment as a buffer to control the change of pH in
the batch systems. Calcium chloride dihydrate was added to the buffer solution
to help obtain good separation of solids from the solution, while sodium azide was
used to inhibit biodegradation in the system.
The buffer solutions were made of 0.005 M A.C.S. grade calcium chloride di¬
hydrate (CaCh
ͣ
2H2O), 0.005 M A.C.S. grade sodium borate {Na2B407
ͣ
IOH2O),
and 0.005 M purified sodium azide (NaNz). The pH of the buffer solution was
adjusted to 8.42 by adding concentrated hydrochloric acid (HCl).
S.1.3.2 Diuron standards
Diuron standards were made by dissolving diuron in the buffer solution.
3.1.4 Glassware
Kimax glass centrifuge bottles were used as the bottle point reactors. The cen¬
trifuge bottles and sample vials were soaked in Alconox cleaning solution overnight,
brushed 15 times with tufted-end brushes, then rinsed approximately 10 times, and
air-dried for two days or oven-dried overnight before use.All other glassware was acid-washed with Nochromix in sulfuric acid, rinsed
with distilled water at least ten times, then air-dried for two days or oven-dried
overnight.
3.2 Bottle-Point Methods
A bottle-point technique that uses a tumbled glass centrifuge bottle for each
data point was applied to investigate the sorption of diuron to the Wagner material.
Several studies using this method were performed:
the solute in the solution phase. A study was performed to observe the effect of
sodium azide on inhibiting the rate of biodegradation of diuron in the presence
of the Wagner material.
(2) Sorption rate studies were performed to obtain the time required to reach
sorption equilibrium.
(3) Desorption rate studies were conducted to determine the time needed to estab¬
lish desorption equilibrium.
(4) Sorption-desorption equilibrium studies were performed.
(5) A study was conducted to observe the effect of sorption age on the rate of
desorption.
(6) A study was performed to investigate the effect of initial solute concentration
on the rate of desorption.
(7) Complex concentration history sorption-desorption equihbrium experiments
were conducted to investigate non-ideal sorption-desorption behavior.
(8) A single-dilution method was applied to a desorption eqviilibrium study to ob¬
serve the effect of centrifugation and dissolved organic matter (DOM) removal
on desorption.
3.2.1 Degradation study ;
A diuron stock solution of 14 mg/1 was made in the standard buffer solution.
Two sets of sample vials were filled with the stock solution and the buffer solution,
capped with teflon-lined caps, and stored in a covered black box at room temper¬
ature. At different times, samples were taken out of the box and analyzed by UV
absorption spectroscopy, and then put back into the box for subsequent sampling
and analysis. The absorbance of the samples were recorded and the concentration
of the stock solution was calculated.
conduct-ing two parallel sorption rate studies, with and without azide in the soil/solution
system. The study lasted for a period of 20 days.
3.2.2 Sorption rate studies
The experimental procedure used for sorption rate studies was:
(1) 10 g of Wagner material and 10 ml of buffer solution were put in each
35-ml centrifuge bottle, capped with teflon-lined screw caps, and the solid was
hydrated for a minimum of 12 hours;
(2) 10 ml of 28 mg/1 diuron stock solution was added to each bottle to obtain a solid-solution ratio of 1:2 and an initial diuron concentration of 14 mg/1, whicli is one third of diuron solubility in water (10 tnl of buffer solution instead of diuron stock solution were added to the blanks);
(3) the tightly capped bottles were then put on a tumbler to ensure mixing of the
solid material and the solution;
(4) at different times, the samples were taken off the tumbler, and centrifuged at
2500 rpm for 30 minutes; and
(5) supernatants were decanted and saved for the diuron concentration analysis. A high initial concentration (28 mg/l) long-term sorption rate study was con¬ ducted in the same way, but 10 g of soil, 4 ml of buffer and 16 ml of 35 mg/1 stock solution were used for each diuron sample in the experiment.
3.2.3 Desorption rate studies
The desorption rate studies were conducted following the same procedure as the
sorption rate studies, except a 10-day sorption period was allowed for all samples.
Following the sorption period:
(1) the samples were centrifuged, and 15 ml of supernatant was replaced with 15
(2) the solid-solution mixtures were tumbled again, sets of bottles were removed
at different times then recentrifuged; and
(3) the supernatants were removed and analyzed for diuron concentrations.
3.2.4 Sorption-desorption equilibrium studies
Sorption-desorption equilibrium studies were performed using the following
protocol:
(1) 15 g of solids and 30 ml of solution of different diuron concentrations (2 to 28
mg/1) were prepared (6 ml of buffer solution was used to hydrate the solid) in
the centrifuge bottles;
(2) samples were tumbled for 44 days then centrifuged; 25 ml of the supernatant
was removed and saved for diuron concentration analysis; 25 ml of buffer solu¬
tion was added to each bottle;
(3) the bottles were then put on tumbler again for another seven days then re¬
centrifuged;
(4) 25 ml of supernatant was replaced with 25 ml of buffer solution, the super¬
natants were saved for diuron concentration analysis, the soil-solution mixtures
were put on the tumbler, re-equilibrated and then re-centrifuged; and
(5) the process was repeated for a total of four desorption steps.
3.2.5 Sorption age study
A sorption age study was conducted following the same procedure as the des¬
orption rate study except the sorption times of the samples were 1, 10, and 20 days.
3.2.6 Initial concentration study
An initial concentration study was conducted following the same procedure as
the desorption rate study except that three different initial solute concentrations of
7, 14, and 21 mg/1 were used.
3.2.7 Other sorption-desorption egtiilibriimi studies
(1) A short-term sorption-desorption equilibrium study was conducted following
the same procedure of the sorption-desorption equilibrium study, but initial
concentrations of 2 to 14 mg/1, a sorption equilibration time of 10 days, and a
desorption equilibration time of 5 days were used.
(2) Two sets of samples of initial concentrations of 14 mg/1 and 9.3 mg/1 were used
in the sorption-desorption-consecutive sorption-consecutive desorption (SDSD)
study. The procedure of this study is basically the same as that of
sorption-desorption equilibrium study. Following the initial sorption equilibration:
a. 25 ml of the supernatant was removed and saved for diuron concentration
analysis; 25 ml of buffer solution was added to the bottle;
b. the bottles were then put on the tumbler again for another 5 days then
re-centrifuged;
c. 25 ml of the supernatant was replaced with 25 ml of 2.8 mg/1 stock solution,
the supernatants were saved for diuron concentration analysis, the
soil-solution mixtures were put on the tumbler for another 10 days then
re-centrifuged;
d. 20 ml of the supernatant was replaced with 20 ml of 4.2 mg/1 stock solution, the supernatants were saved for diuron concentration analysis,
the soil-solution mixtures were put on the tumbler,equilibrated and
re-centrifuged;
e. 20 ml of the supernatant was replaced with 20 ml of 5.6 mg/1 stock solution, the supernatants were saved for diuron concentration analysis,
re-centrifuged;
f. 20 ml of the supernatant was replaced with 20 ml of 14 mg/1 stock so¬ lution, the supernatants were saved for diuron concentration analysis,
the soil-solution mixtures were put on the tumbler,equilibrated and re-centrifuged;
g. 25 ml of the supernatant was removed and saved for diuron concentration analysis; 25 ml of buffer solution was added to the bottle; the bottles were
then put on the tumbler again for another 5 days then re-centrifuged; and h. the desorption process was repeated for another two times.
(3) A Sorption-desorption-consecutive sorption (SDDS) study was performed. The
procedure of this study is similar to the procedure of the SDSD study. Following
the initial sorption equilibration:
a. 25 ml of the supernatant was removed and saved for diiuon concentration
analysis; 25 ml of buffer solution was added to the bottle; the bottles were then put on the tumbler again for another 5 days then re-centrifuged;
b. the above desorption process was repeated again;
c. 25 ml of the supernatant was removed and saved for diuron concentration
analysis; 25 ml of 7 mg/1 stock solution was added to the bottle; the bottles
were then put on the tmnbler again for another 10 days then re-centrifuged;
and
d. the above sorption process was repeated for another two times.
3.2.8 Single-dilution desorption equilibrium study
A single dilution desorption equilibrium experiment was performed using the
following method:
(1) 3.5 g of Wagner solid and 3.5 ml of buffer solution were put in each of 16
(2) 3.5 ml of 28 mg/1 stock solution were added to eight diuron samples while 3.5
ml of buffer solution were added to the other eight blank samples, all samples were then tumbled to allow complete mixing for ten days;
(3) after ten days of sorption, two diuron samples and two blank samples were
centrifuged, and the supemantants were saved for determination of UV ab¬
sorbance;
(4) 10 ml, 20 ml, and 30 ml of buffer solution were added to the remaining bottles
after the ten-day sorption to dilute the liquid-phase concentrations further; and
(5) after a five-day desorption period, the samples were centrifuged, and the
su-pernatants were saved for UV spec analysis.
3.3 Extraction Methods
3.3.1 SoHd-phase extractions
Solid-phase extractions were performed on several samples at the end of some
experiments to check if there was any loss of sorbate during the experimental period.
It has been reported that methanol and acetone are much better extracting solvents
than water for extracting organic compoimds from solids (Ho and Daw, 1988). But acetone-extraction was not feasible in this research because it exerts a very high
background absorbance at the wavelength of interest. Therefore, methanol was
used as the extracting solvent in the solid extraction experiment. The following
procedure was used:
(1) Solid-solution samples were first centrifuged then decanted as completely as possible;
(2) 25 ml of methanol were added to the decanted samples, and the samples were
then put on tumbler for one day;
in 100-ml volvunetric flasks;
(4) to each 100-ml volumetric flask, enough methanol was added to bring the vol¬
ume of the sample to 100 ml;
(5) diuron methanol standards were prepared by dissolving diuron in methanol;
(6) the absorbance of methanol samples and standards were measured; and
(7) the diuron mass that was extracted was computed and compared to the original
mass of diuron in the system.
3.3.2 GC solvent extraction
Aqueous samples were extracted with hexane before performing GC analysis
using the following procedure:
(1) 5 ml of an aqueous sample and 5 ml of hexane were put in a sample vial, and
capped with teflon-lined cap;
(2) the sample was mixed for three minutes to allow complete extraction. (3) the solvent sample was stored in a refrigerator after shaking; and
(4) the solvent samples were warmed to room temperature before performing GC
analysis, and one fj.! of the upper-level liquid (hexane with diuron) was injected
into a GC for diuron concentration analysis.
3.4 Analytical Methods
Ditu-on can be analyzed by gas chromatography (GC) or ultra violet spec¬
trophotometry (UV spec). For the GC method, the diuron solvent samples were
analyzed on a Hewlett Packard 5890 gas chromatograph fitted with a 30-m, DB5 capillary column and an electron capture detector. The operating conditions axe
Hsted in Table 3-2.
di-Tahlg 3-2 The Operating Conditions of Diuron GC Analysis
Injector teaperature 275 degree C Detector te/sperature 300 degree C
Oven temperature 170 degree C, isothernal
Colusn flowrate 1.63 il/sin Split flowrate " 35 il/sin Purge flowrate 4,05 il/«in
uron peak area to DCB peak area (Rp) for each injected sample was computed.
The correlation between the ratio of peak areas (Rp) and the diuron concentration
of standards (C) was determined by performing a nonlinear regression on these
collected data. The calibration curve was found to be
i2p = -0.0027C2 + 0.1356C +0.0265 (3-1)
The Rp of each sample was computed and used to determine the diuron concentra¬
tion via the calibration curve.
For the UV method, the liquid-phase concentrations of diuron were determined
by measuring the UV light absorbance on a Perkin-Elmer Lambda 3 spectropho¬
tometer. The diuron in distilled, deionized water was found to exhibit maximum
absorbance at 210 nm and 248 nm, while the buffer solution exhibited a maximum
absorbance at 220 nm due to the presence of azide (see Figure 3-2). The absorbance
at 248 nm was used through all the studies for calculating diuron concentrations to
minimize the azide interference.
3.0
I---1---1---1---1---1---1---ooooo Diuron in DDI Water
^1^ * * * * Buffer Solution
Diuron in Buffer Solution
y 1.8
•^00 220 240 260
Wavelength (nm)
The meastued absorbance of diuron standards was subtracted by the absorbance
of the buffer solution with which the standards were made, giving a net absorbance.
The correlation between the net absorbance {ABS') and the concentration of stan¬
dards (C) was determined by performing a nonlinear regression on all the ab¬
sorbance data of the standards collected during the experimental period. The
calibration curve was found to be
v455'=-0.00049C2-I-0.08C - 0.002 (3-2)
The measured absorbance of each sample was subtracted by the corresponding absorbance of the blanks. The net absorbance of each sample was used to compute
the diuron concentration via the calibration curve. The amount of diiu-on that
disappeared from the solution was assumed to be sorbed by the solids. The amount of diuron measured in the solution in excess of the amount of diuron in the solution
at the beginning of the desorption process was assumed to be desorbed.
Figure 3-3 and Figure 3-4 show the comparison of experimental data obtained with the GC method and the UV method. The agreement between these two methods was good. The UV method was applied to all other studies in this research because solvent extraction was needed for the GC method, while aqueous solutions
were used directly for the UV-spec method, and preliminary studies showed that
en
o
c
o o
CD
0) a
_G CL
cr
'i-.U 1 1 1 1 1 1 1
1 1
«)
1,2
-****>>: QQ Data
-j
- ͣ ooooo UV Data
-8.4
-5.6
9 - *
o
-2.8 - © * -J
n n 1 1 1 1 1 i 1 1
6
-1
0 3 6 9 12
Sorption Tinne (days)
15
o
sz
-4->
(U
>
JZ
(U C
'o
O
c
o
o c
(U o
c
o
o
14.0
11.2
2.8 5.6 8.4 11.2 14.0
Concentration Obtained with GC Method (nng/l)
4 EXPERIMENTAL RESULTS AND DISCUSSION
This chapter will present all the experimental results in the same order as the
experimental methods were presented in section 3.2 (pp. 3-4). The experimental
conditions for all those studies are summarized in Table 4-1. All sample data points
of the rate studies are the average of two replicates and all sample data points of equilibrium studies are the average of four replicates.
4.1 Degradation Study
A study was performed to investigate the effect of solute degradation in the
Wagner-diuron system. A batch reactor method described in the methods section
was used to evaluate the change in solute concentration that occurred over 69 days.
The results of this experiment showed no evidence of loss of diuron (liquid phase
only, no solids) during a period of 69 days (see Figure 4-1).
ͣ
An experiment was performed to investigate the effect of azide on inhibiting
biodegradation in the Wagner-diuron system. The result of this experiment did
not show that azide had any significant effect in the Wagner-diuron system (Figure
4-2).
Solid-phase extractions were performed on samples that were suspended for 44
to 80 days. The average recovery of diuron from the soils was 95%, which indicated
that there was little biodegradation in the solid/water system (see Table 4-2).
Table 4-1 List of Experisental Conditions
Experiient
Naie Description
Sorpt Tide
ion (d)
Desorpt Use (d
ion ) M/U
Analytical
Method Co (iig/1 D6D solute degradation study UV 14 D-K sorption kinetics s:udy 15 1:1 6C i UV 12
SRI sorption kinetics study 20 1:1 GC 14
SR4 sorption kinetics study 23 1:2 UV 14 SRS sorption kinetics study 75 1:2 UV 28 AZ study of azide effect 20 1:2 UV 14
ftl desorption kinetics study 1 19 1:2 UV 14 DR2 desorption kinetics study 10 6 1:2 UV 14 fi20 desorption kinetics study 20 24 1:2 UV 14
D-C desorption kinetics study 10 21 1:2 UV 7,14,21
RI sorption-desorption equilibriui study
44 7 1:2 UV 2-27
ISO sorption-desorption equilibriui study
10 5 1:2 UV 2-14
SDDS sorption-desorption
equilibriua study
10 5 1:2 UV 9,14
SDSD sorption-desorption 10 5 1:2 UV 9,14 equilibriui study
15.0
^U.6
C
o
a c Q) a c
o
o
<u
en
o
JZ
14.2
-13.8
6 13.4
-cr
13.0
14 28 42
Ti'nne (days)
56 70
1.0?
0.8
O
O
o
0.6
0.4
0.2
0.0
1---1---1---1---r
*
O
*
o *
I r
° 90
0
ooooo No Azide System
*****With Azide System
^ 2
6
J______L
o
J_______\_______L
i)
4 8 12 16 20
Sorption Time (days)
Table 4-2 Soil Extraction Recoveries
Sasple Total Suspension Diuron
Na*e Tine (days) RecoverY SR5-i8 55 90.77 X
SR5-22 75 98.83 7. A20-12 44 96.85 7.
SDSl 80 92.17 7.
SDS2 eo 95.59 X
average = 94.84 X
biological mineralization (Ogram et al., 1985). Dao and Lavy (1987) also reported
that diuron was not susceptible to microbial degradation in short-term studies.
These reports support the finding that little degradation occurred in the
sorption-desorption experiments.
4.2 Sorption Rate Studies
4.2.1 Solid concentration effect
In order to have the resulting diuron concentrations fall in the detection limits
of the instrument, a proper solid to solution ratio must be found. Two sorption
rate studies of solid to solution ratio (M/V, mass of solid to volume of solution) of 1:1 and 1:2 were conducted. The results (Figure 4-3) showed that the higher solid concentration experiment (M/V=l:l) reached apparent equilibrium faster than the
lower one. The final liquid phase diuron concentrations were about one fourth of
the initial concentration in the M/V=l:2 experiment, which gave a clear view of
experimental results during the sorption process. Thus, a solid to solution ratio of