International Journal of Research in Engineering & Applied Sciences
http://www.euroasiapub.org 30
TO IMPROVE THE PRODUCTIVITY IN A PROCESS INDUSTRY BY USING
LABOURS
PARDEEP KUMAR
ASSISTANT PROFESSOR IN NIILM UNIVERSITY, KAITHAL, HARYANA
DILBAGH SINGH
ASSISTANT PROFESSOR IN NIILM UNIVERSITY, KAITHAL, HARYANA
ABSTRACT
Today the world is moving from an era of separate national economies to the networked global economy. The expectations of human beings have risen tremendously. Achieving Manufacturing Excellence is the new paradigm for the industries to survive and sustain in the age of global competition and so improving productivity. I visit the process industry with a team of four persons. The purpose of my visiting was to check or improve the productivity by utilizing the labours. During my visit I found a lot of factors due to which the rate of the production was low or in other words we can say that by making some improvement in these factors we can improve our productivity. Some of these factors were: Labours, Breakdowns of machines, Continuous use of old & unrepaired machines, Ideal time taken by workers, Rate of interest in work taken by workers, Shortage of raw material
International Journal of Research in Engineering & Applied Sciences
http://www.euroasiapub.org 31
INTRODUCTION
As we know that there is no standard one-shot formula or prescription for raising productivity. No proven best method; no perfect solution. Human knowledge and creativity have raised productivity over thousands of years and will also continue to do so in the years to come. So on the basis of these there is five ways to improve productivity: Maintain input but increase output, Decrease input but increase output, Decrease input but maintain output, Decrease input with smaller decrease in output, Increase input but get a greater increase in output. In other words increase in output by itself is not increase in productivity. If input of resources has gone up in direct proportion to the increase in output, productivity has remained unchanged. Had resource-input risen higher in proportion to output, productivity would have, in fact, deteriorated. Improving productivity levels in industries is a necessary for survival and economy growth of any country. Productivity level s is alarmingly low in most of the industries there are multiple reasons for this serious malady. These include: Low capital investment, Low capital-Labour ratio and Low level of labour-utilization, Government regulations, Low work ethics and High energy costs. Hence improving labour utilization levels in the industries will directly influence productivity levels. Productivity is the index of economic growth and so concern at the national level to conserve scare resources and to encourage deployment or use of available resources in such a way so as to maximize the yield.
As we know that total productivity is equal to: Ptotal = Ot / Il + Ic + Ir + Im
Where, Ptotal =Total productivity Il = Labour input
Ic =Capital input
Ir =Raw material and finished parts inputs
Im = other miscellaneous goods and services inputs
International Journal of Research in Engineering & Applied Sciences
http://www.euroasiapub.org 32
METHODOLOGY
The success of any kind of survey is more or less directly proportional to methodology adopted for it. The methodology tells us way in which whole process was carried out, right form beginning up till end. Technology used for evaluating Labour productivity is Work Sampling. It is a technique which is based on algorithm for determining utilization of labour. The discussion of various methods used to improve the same is as follows:
Identifying elements such as working idleness viz. W & X Conducting the work sampling study in pressure vessel (PV) shop-I & Weight age of all the nine idleness elements.
Observations are taking at different time estimated for 10 days.
Cumulative chart for showing idleness percentage along with cumulative time in minutes for all individual idleness of different elements (Day wise) for PV shop-I
Cumulative chart for showing idleness percentage along with cumulative time in minutes for all different sub elements (from X 1 to X 9) for PV shop-I is prepared for analyzing capacity utilization deeply.
Finally, labour utilization is concluded along with out of total percentage of idleness for PV-I shop.
Identifying maximum weighted idleness elements. Improving layout of domain area.
Determining improvement factor for PV-I shop in division.
TECHINQUE USED FOR IMPROVING PRODUCTIVITY IS WORK STUDY
Technique used for improving productivity is Work Study. Formula Used:
International Journal of Research in Engineering & Applied Sciences
http://www.euroasiapub.org 33
Preliminarily survey of pressure vessel shop I on 14-2-2008 Estimate of P (Working) for PV-I = 67/100= 67 % (working) For not working:
Estimate of P (not Working) for PV-I = 33/100= 33 % (not working) So no. of observation=n=4p (1-p)/A2= 4* 0.67* 0.33/ (0.03)2= 983 Accuracy Achieved
A=√ 4p (1-p)/n
=√ 48 0.33 *0.67/3200=1.76 %
RESULTS
Result of preliminary survey of Pressure Vessel-I (PV-I)
No. of Workers Estimate activity Accuracy desired No. of Observations
Accuracy achieved
10 67 % (working) 3 % 983 1.76 %
True value of idleness percentage: P¯ =755/3200=0.2359 or 23.59 % Now, Upper Control Limit (UCL) UCL=p¯ + 3√P (1-P¯)/n
Where n= no. of observation in a day, i.e. 320 So, UCL= 0.2359 + 3√0.2359 * 0.7641/320
=0.4184 41.84 %
International Journal of Research in Engineering & Applied Sciences
http://www.euroasiapub.org 34
LCL=p¯ - 3√P (1-P¯)/n
Where n= no. of observation in a day, i.e. 320 So, UCL= 0.2359 - 3√0.2359 * 0.7641/320 =0.1533
15.33 %
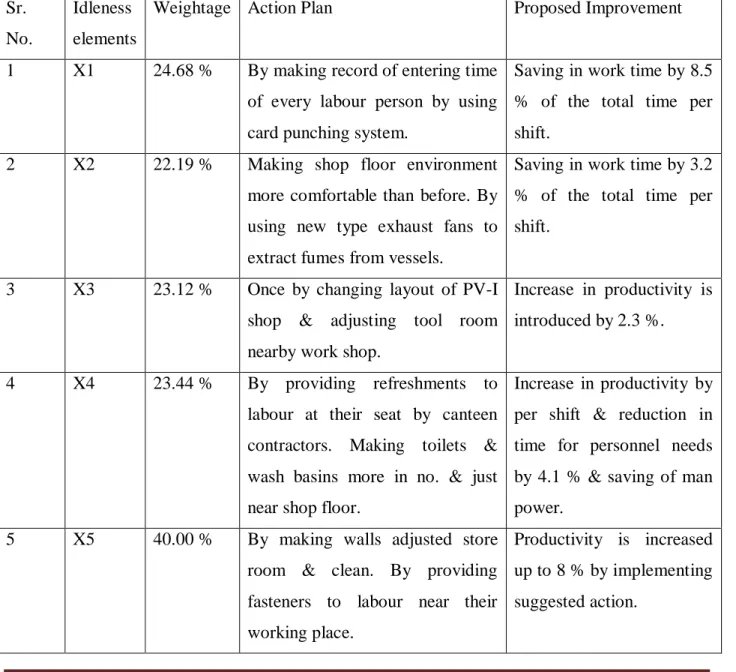
Table for improvement
Sr. No.
Idleness elements
Weightage Action Plan Proposed Improvement
1 X1 24.68 % By making record of entering time of every labour person by using card punching system.
Saving in work time by 8.5 % of the total time per shift.
2 X2 22.19 % Making shop floor environment more comfortable than before. By using new type exhaust fans to extract fumes from vessels.
Saving in work time by 3.2 % of the total time per shift.
3 X3 23.12 % Once by changing layout of PV-I shop & adjusting tool room nearby work shop.
Increase in productivity is introduced by 2.3 %.
4 X4 23.44 % By providing refreshments to labour at their seat by canteen contractors. Making toilets & wash basins more in no. & just near shop floor.
Increase in productivity by per shift & reduction in time for personnel needs by 4.1 % & saving of man power.
5 X5 40.00 % By making walls adjusted store room & clean. By providing fasteners to labour near their working place.
International Journal of Research in Engineering & Applied Sciences
http://www.euroasiapub.org 35
6 X6 20.00 % To qualify workers at starting of their relevant jobs by their supervisors.
Saving in working time by 2.5 % as compared to present manual working. 7 X7 21.56 % Material required to workers is
pre-checked by their supervisors & inspection staff.
Productivity is raised by implementing suggested plan to 2 %.
8 X8 15.94 % Study was conducted once to change layout of PV-I shop, however, there was good saving.
Increase in productivity by per shift & avoidance of involvement of waiting of crane by 1.2 % & saving of man power.
9 X9 27.81 % By providing rewards as incentives to non or less absentee labour.
Saving in working time by 3.4 % as compared to present manual working.
Cumulative Chart for idleness % showing % of the different reasons of idleness (Day wise)
PV Shop-I
Sr. No. Date No. of Obs.
No. of Idles
Cum. No. of Obs.
Cum. No. of Idles
Idle % Cum.
XI Cum XI
Cum % XI
International Journal of Research in Engineering & Applied Sciences
http://www.euroasiapub.org 36
Cumulative Chart for idleness % showing % of the different reasons of idleness (Day wise)
PV Shop-I
X2 Cum X2
Cum % X2
X3 Cum X3
Cum % X3
X4 Cum X4
Cum % X4
X5 Cum X5
Cum % X5
11 11 13.92 % 27 27 34.17 % 10 10 12.66 % 8 8 10.13 % 12 23 15.18 % 20 47 31.33 % 8 18 12.00 % 6 14 9.33 % 11 34 16.96 % 24 71 31.69 % 10 28 12.50 % 6 20 8.33 % 4 38 16.59 % 27 98 42.79 % 7 35 15.28 % 6 26 11.33 % 9 47 11.00 % 43 141 33.02 % 3 38 8.9 % 3 29 6.79 % 11 58 11.81 % 20 161 32.79 % 6 44 8.96 % 6 35 7.13 % 10 68 12.14 % 24 185 33.03 % 6 50 8.93 % 6 41 7.32 % 8 76 12.44 % 16 201 32.90 % 7 57 9.33 % 2 43 7.03 % 9 85 12.14 % 16 217 36.17 % 12 69 9.86 % 5 48 6.86 % 8 93 12.31 % 14 231 30.60 % 7 76 10.07 % 6 54 7.60 %
Cumulative Chart for idleness % showing % of the different reasons of idleness (Day wise)
PV Shop-I
X6 Cum X6
Cum % X6
X7 Cum X7
Cum % X7
X8 Cum X8
Cum % X8
X9 Cum X9
Cum % X9 4 4 5.06 % 5 5 6.33 % 7 7 8.86 % 0 0
6 10 6.67 % 4 9 6.00 % 6 13 8.87 % 0 0 3 13 5.80 % 5 14 6.25 % 6 19 8.48 % 0 0 9 22 9.60 % 6 20 8.73 % 10 29 12.66 % 0 0
21 43 10.07 % 12 32 7.50 % 17 46 10.77% 16 16 3.74 % 4 47 9.57% 3 35 7.12 % 6 52 10.59% 0 16 3.25 % 3 50 8.93 % 3 38 6.78 % 8 60 10.71% 0 16 2.85 % 2 52 8.51 % 3 41 6.71 % 3 63 10.31% 0 16 2. 62 % 6 58 8.28 % 6 47 6.71 % 10 73 10.43% 32 48 6.85 % 3 61 8.08 % 4 51 6.75 % 3 75 9.93% 0 48 6.36 %
International Journal of Research in Engineering & Applied Sciences
http://www.euroasiapub.org 37
Sr. No. Date No. of
Observation
No. of Idles Idleness %
1 15/02/08 320 79 24.68 %
2 16/02/08 320 71 22.19 %
3 22/02/08 320 74 23.12 %
4 23/02/08 320 75 23.44 %
5 29/02/08 320 128 40.00 %
6 01/03/08 320 64 20.00 %
7 07/03/08 320 69 21.56 %
8 08/03/08 320 51 15.94 %
9 14/03/08 320 89 27.81 %
10 15/03/08 320 55 17.18 %
3200 755
Graph for control chart of PV-I (Day wise)
RESULTS & DISCUSSION
For pressure vessel shop-I:
Out of 320 observations made on 10-02-2008 the total no. of idles (X) =79 Out of 320 observations made on 16-02-2008 the total no. of idles (X) =74
24.69
20.19 23.35 23.44
40 20 21.56 15.94 27.3 17.2 0 5 10 15 20 25 30 35 40 45 15 -2 -2008 16 -2 -2008 22 -2 -2008 23 -2 -2008 29 -2 -2008 1/ 3/ 2 0 0 8 7/ 3/ 2 0 0 8 8/ 3/ 20 08 14 /3 /2 00 8 15 /3 /2 00 8
1 2 3 4 5 6 7 8 9 10
Values
Values
International Journal of Research in Engineering & Applied Sciences
http://www.euroasiapub.org 38
Out of 320 observations made on 22-02-2008 the total no. of idles (X) =71 Out of 320 observations made on 23-02-2008 the total no. of idles (X) =75 Out of 320 observations made on 29-02-2008 the total no. of idles (X) =128 Out of 320 observations made on 02-03-2008 the total no. of idles (X) =64 Out of 320 observations made on 07-03-2008 the total no. of idles (X) =69 Out of 320 observations made on 08-03-2008 the total no. of idles (X) =51 Out of 320 observations made on 14-03-2008 the total no. of idles (X) =89 Out of 320 observations made on 15-03-2008 the total no. of idles (X) =55
CONCLUSTIONS
Causes & remedies:
Causes: Late starting & early ending (X1 & X2)
Remedies: There should be some fine or restrictions for entry time & exit time.
Extra time should be given to workers for changing their shop dresses rather than the working time on the shop floor.
Causes: Visit more time to Tool Room/Store etc (X3)
Remedies: There should be good connection between tool room & shop.
Causes: Personal needs (X4)
Remedies: If workers remains frequently absent from his place due to his personal needs then
supervisor must be very strict against him.
Causes: Idleness because of misplanning of material in store room (X5)
Remedies: The schedule charts must be prepared & should then be passed to the purchasing
International Journal of Research in Engineering & Applied Sciences
http://www.euroasiapub.org 39
References:
Arora, B.K.; Productivity in Miling industry, Productivity, 1985, Vol. XXV, No. 4, PP-441-446.
Rao Nageshwar & Gupta Omji; capacity utilization in textile industry; Productivity, 1987, Vol. XXVIII, No. 2, PP 119-126.
Narag, A.S. & Sharma, J.K; Goal programming for product mix decisions; Productivity, 1988, Vol. XXVIII, No.42, PP 345-352.
Sardana, G.D. & Vrat Prem; Productivity measurement in a large organization with multi-performance objectives; Productivity,1987, No. 4, PP 105-125.
Chatterjee, Pardeep K; Quality excellence for productivity improvement; Productivity, July-Sep. 1993, Vol. 34, No. 2, PP 288-291.
Miyabayashi, Ikuko; Implementation of work sampling in an acute rehabilitation unit; 1999, Vol. 42I, PP 171-174.
Mukherjee S.K., Pal M.N. & Chatterjee A.K.;Introduction to work study, 1999, PP 28-244.
Klarin, M.M.,Cvijanovic J.M. & Brbkic V.K. Spasojevic; The shift level of the utilization of capacity as the stockastic variable in work sampling; International Journal Productivity, 2002, Vol. 38, No. 12, PP 2643-2651.
Krishna, S. & Sahu; Productivity improvement in weaving section of a Jute mill; Industrial Engineering, June 2002, Vol. XXXI, No. 6, PP 11-16.
Raju C Gopala, Rao V. cause & effect analysis as a means of improving quality & productivity in a paper mill, Industrial Engineering, Oct. 2005, Vol. XXXIV, No. 10, PP 29-33.
![2 [1 (4 Bromophenyl) 3 hydroxy 3 (4 methoxyphenyl)propyl]cyclohexanol](data:image/gif;base64,R0lGODlhAQABAIAAAP///wAAACH5BAEAAAAALAAAAAABAAEAAAICRAEAOw==)