QoS Prediction for Web Services Based on Similarity-Aware Slope One
Collaborative Filtering
Chengying Mao and Jifu Chen
School of Software and Communication Engineering,
Jiangxi University of Finance and Economics, 330013 Nanchang, China E-mail: [email protected]
Keywords:Web services, QoS prediction, Slope One, similarity, collaborative filtering
Received:December 15, 2012
Web services have become the primary source for constructing software system over Internet. The quality of whole system greatly dependents on the QoS of single Web service, so QoS information is an important indicator for service selection. In reality, QoSs of some Web services may be unavailable for users. How to predicate the missing QoS value of Web service through fully using the existing information is a difficult problem. This paper attempts to settle this difficulty through combining Pearson similarity and Slope One method together for QoS prediction. In the paper, we adopt the Pearson similarity between two services as the weight of their deviation. Meanwhile, some strategies like weight adjustment and SPC-based smoothing are also utilized for reducing prediction error. In order to evaluate the validity of our algorithm (i.e., similarity-aware Slope One algorithm, SASO), comparative experiments are performed on the real-world data set. The results show that SASO algorithm exhibits better prediction precision than both basic Slope One and the well-known WsRec algorithm in most cases. Meanwhile, our approach has the strong ability of reducing the impact of noise data.
Povzetek: ˇClanek poskuša razrešiti problem ocenjevanja kakovosti storitve s kombiniranjem Parsonove podobnosti in metode Slope One.
1
Introduction
In recent years, the pattern of service-oriented computing (SOC) has been widely accepted to build large-scale sys-tem over Internet [1]. In this new style of software devel-opment paradigm, software is no longer built via the tra-ditional process, but in the way of service unit reuse. Ac-cordingly, some new problems such as service discovery, selection and composition are emerging, and play a great impact on the quality of service-based system.
In general, service unit is self-describing component to complete a specific task. Quality-of-Service (QoS) is an important way to describe non-functional characteristics of Web services. When several functionally-equivalent Web services exist in the network, QoS is viewed as a critical is-sue for picking out the appropriate service from equivalent service set. Web service QoS usually includes a number of properties, such as response time, throughput, failure prob-ability, availprob-ability, price, popularity, and so on [2]. Due to different network environments, service users will have different QoS metrics for the same Web service. Therefore, each service user has to understand QoSs of all services to be invoked at his/her end.
In order to construct the software meeting the actual requirements, it needs to make the existing service units work together in accordance with the pre-defined business logic, that is the so-called Web service composition (WSC).
During service selection, the quality of each service unit should be carefully considered so as to ensure the trustwor-thiness of WSC. However, service invoker may be lack of adequate historical information for some specific Web ser-vices. He/She has to estimate the QoS value of a given Web service before determining to introduce it into WSC, i.e., QoS prediction for Web services. Since the service user has not even invoked the service in past, the estimation for such service’s QoS has to get help from other similar users or self’s invocation records on other Web services.
more comprehensive method for QoS prediction, in which they combined the traditional user-based and item-based collaborative filtering methods together through confidence weights. Recently, some improved methods based on per-sonalized context [6, 7] or hierarchical and side information [8] are also proposed.
It is important to note that, most above mentioned meth-ods are in accordance with Pearson-based similarity. Al-though this kind of similarity can provide good prediction effect, it not only cost much computation time but also lose performance for the very sparse data set. Besides the similarity-based collaborative filtering, Slope One [9] has been validated as an effective prediction method due to its simpleness and high performance. In the paper, we presented a hybrid QoS prediction method through intro-ducing Pearson-based similarity into Slope One method. The experimental results revealed that our hybrid method (namedsimilarity-aware Slope One, SASO) could outper-form the basic Slope One and Pearson-based collaborative filtering methods in term of prediction precision.
The main contributions of this paper can be addressed as follows.
(1) A prediction algorithm of Slope One co-operated with Pearson similarity measurement has been proposed for providing QoS information for Web service user.
(2) Some strategies like weight adjustment and SPC-based smoothing are presented for improving the prediction precision.
(3) The detailed performance analysis on real-world data set is performed to verify the effectiveness of our method. Moreover, the two-stage filling strategy is also validated through experimental analysis.
The structure of the paper is as follows. In the next sec-tion, we state the QoS prediction problem for Web services, and introduce two typical collaborative filtering algorithms. In section 3, the overall QoS prediction framework is firstly addressed, and then the similarity-aware Slope One algo-rithm is described in details. The performance comparison and analysis are discussed in section 4. Section 5 gives some existing researches that are closely related with our prediction approach. Finally, section 6 concludes the pa-per.
2
Background
2.1
QoS prediction for Web services
When Web service users prepare to adopt some service units to construct an enterprise-level application, in gen-eral, they have to replace each abstract service in service orchestration plan with a concrete service. For each ab-stract service, perhaps quite a few service implementations will meet the requirement of its function. Therefore, the rational way is to pick out a service with high QoS from
the candidate set. However, for a specific service user, the QoS values of some Web services may be not available. As a consequence, it is necessary to estimate the QoSs of such services according to the limited existing information, that is so-called QoS prediction problem.
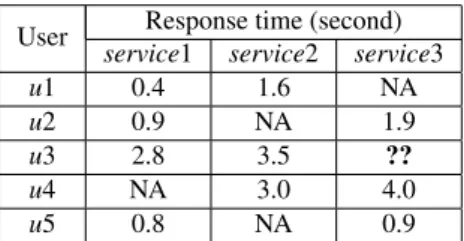
Motivating Example. Here, we provide a simple illus-tration to address the QoS prediction for Web services. As shown in Table 1, there are response time (i.e. RT) records of three Web services w.r.t five users. The element ri,j means the RT value of userifor servicej, and “NA” repre-sents the corresponding value not available at present. As-sume useru3has some interests on the third service, since there is no ready record in the table, he has to predicate the issuer3,3according to his own and others’ service invoca-tion records.
User Response time (second)
service1 service2 service3
u1 0.4 1.6 NA
u2 0.9 NA 1.9
u3 2.8 3.5 ??
u4 NA 3.0 4.0
u5 0.8 NA 0.9
Table 1: An motivated example for illustrating QoS predic-tion problem.
How to estimate the missing value? Besides u3’s ex-isting records on other two services (i.e.r3,1andr3,2), the available service invocation records of other four users also should be taken into consideration. With regard to predic-tion techniques, experiences tell us thatcollaborative filter-ing(CF) techniques can be viewed as a good choice.
2.2
Review on collaborative filtering
In general, collaborative filtering is a technique of suggest-ing particularly interestsuggest-ing items or patterns based on past evaluations of a large group of users. The fundamental as-sumption of CF is that if users have similar tastes on some items, and hence they will rate or act on other items simi-larly. At present, CF techniques can be classified into three categories [10, 11]: (1) memory-based methods, (2) model-based methods, and (3) hybrid methods. Memory-model-based CF utilizes the user rating data to calculate the similarity or weight between users or items, and then make predic-tions according to those similarity values. This type of CF is the earlier mechanism and used in many commercial systems such as Amazon, Barnes and Noble. According to the background and feature of QoS prediction problem, memory-based CF is treated as the main research issue in the paper. Especially, two well-known methods, i.e., Pear-son correlation CF and Slope One approach, are taken into consideration.
2.2.1 Pearson correlation-based method
In a typical CF scenario, there is a list of m users
each useruihas a list of items (i.e.,Iui), which the user has rated, or about which their preferences have been inferred through their behaviors [10]. Generally speaking, the basic procedure of CF-based recommendation or prediction can be summarized as the following two steps:
(1) Look for users sharing the similar interests or rating patterns with a given user (called active user).
(2) Use the information from those like-minded users found in step (1) to calculate a prediction for the ac-tive user.
Here, we mainly address the case from the perspective of users, but the above process is also suitable for item-oriented analysis. It is not hard to find that, how to find the similar users (or items) for a specific user (or item) is a critical task in the whole process of CF. In practice, the common interests or patterns are expressed via the correla-tion between users (or items).
At present, Pearson correlation coefficienthas been in-troduced for computing similarity between users or items according to the user-item data like in Table 1, which is usually calleduser-item matrix. For two given usersaand
u, their similarity can be computed as follows.
Sim(a, u) =
P
i∈I(ra,i−r¯a)(ru,i−r¯u)
pP
i∈I(ra,i−r¯a)2pPi∈I(ru,i−¯ru)2 (1) whereI =IaTIu is the subset of items which both user
aanduhave invoked previously,ra,iis a vector of itemi observed (or rated) by usera, andr¯aandr¯urepresent av-erage values of different items observed (or rated) by user
aandu, respectively.
The prediction method based on two users’ similar-ity is referred as user-based CF. Similarly, CF can also be conducted through the similarity computation between two items, that is,item-based CF. According to the stud-ies from other researchers, item-based CF can outperform user-based CF in most conditions, and has been treated as a preferred choice for prediction or recommendation prob-lems.
As mentioned earlier, Shaoet al. firstly adopted Pear-son correlation-based CF for Web services’ QoS prediction [4]. Recently, Zhenget al. improved prediction precision problem through combining item-based and user-based CF together [5]. Their WsRec algorithm exhibits better perfor-mance than other basic prediction methods, and has caused much attention in these two years.
2.2.2 Slope One method
Although previous studies have revealed that Pearson scheme CF can gain good prediction precision, its perfor-mance is not so satisfactory for the case of extremely sparse data. Meanwhile, Pearson-based method will cost a lot of computational overhead to measure the similarity between users or items. Fortunately, another well-known method called Slope One [9] can make up such deficiencies. On
the one hand, Slope One can show good prediction effect for sparse data. On the other hand, this method can perform prediction activity with less computing cost.
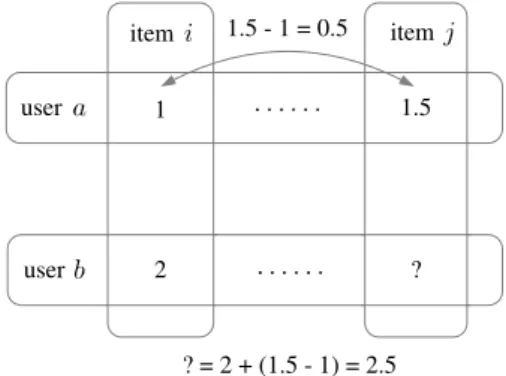
As stated by Lemire et al., Slope One algorithm works on the intuitive principle of a “popularity differen-tial”between items for users. In this algorithm, how much better one item is liked than another is determined in a pair-wise fashion. Firstly, the difference between the averages of two items can be calculated via subtract operation. Then, once one item’s value is available, the other’s value can be predicted according to such difference. The process can be illustrated in Figure 1. For two users (a andb) and two items (iandj) in user-item matrix, the values of these two items for useraare known and the differential fromitoj
is 1.5-1=0.5. Thus, the itemj’s value for userbcan be pre-dicted via this mapping relationship, that is, 2+(1.5-1)=2.5. Of course, many such differentials exist in a training set for each unknown rating, the average of these differentials will be taken for predication.
user
user
item item
1 1.5
2 ?
1.5 - 1 = 0.5
? = 2 + (1.5 - 1) = 2.5
Figure 1: Illustration for Slope One prediction algorithm.
Formally speaking, for a given user-item matrix, the set of the users who contain rating records both on itemiand itemj can be computed and denoted asUi,j here. Obvi-ously, Ui,j = Uj,i. Then, the average deviation of itemi with respect to itemjcan be denoted as:
devj,i=
X
u∈Uj,i
ru,j−ru,i
card(Uj,i)
(2)
wherecard(Uj,i)returns the element number of setUj,i. Based on the deviations of items, the rating of userufor itemj, i.e.ru,j, can be predicated via the following way.
P(ru,j) =
1
card(Rj)
X
i∈Rj
(devj,i+ru,i) (3)
whereRj={i|ru,i 6=NA,i 6= j andcard(Uj,i) > 0} is the set of items which have co-occurrence relationship with itemj.
relation [12, 13], bi-polar strategy is used for users’ two dif-ferent attitudes [9]. However, variant algorithms can’t lead to obvious improvements over the basic form in all cases.
3
Similarity-Aware Slope One for
QoS prediction
With regard to the usage scenario of Web services, ser-vices’ QoS data from different users can form a sparse ma-trix of service invocation records. In order to help service user make a rational decision about service selection, the prediction for a specific service’s QoS w.r.t. of the cur-rent user is very necessary. In this paper, we provide a hy-brid prediction method through comprehensively adopt the merits both from Pearson correlation-based algorithm and Slope One algorithm.
3.1
The overall prediction framework
For an active service useru, the number of services which have been invoked byuis namedgiven number(i.e.GN). For allnservice items,GN is usually a little part. In or-der to provide precise QoS estimations for the remaining service items w.r.t useru, we should take full use of other users’ invocation records for these services. Here, we as-sume the historical QoS data aboutmusers fornservice items is matrixM. Similarly, each service user only has partial QoS information in that matrix. The proportion of existing QoS data in matrix is denoted as density (d for short).
In our investigations on collaborative filtering tech-niques, we have found a fact as follows: Slope One method is suitable for the very sparse data set (i.e. very low den-sity data), whereas Pearson-based CF can achieve desired prediction results for the case of high density data. There-fore, in our method, we mainly adopt Slope One method for prediction and compute Pearson correlation between services to adjust the reference weight. The closer rela-tion between a service and the subject service for useru, the higher weight should be assigned to the QoS deviation between these two services.
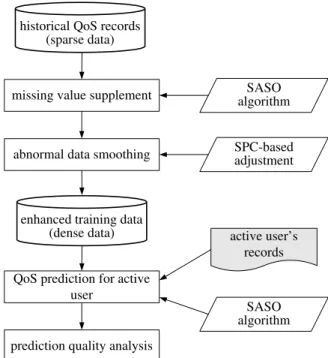
The whole procedure of Web service QoS prediction is shown in Figure 2. At the initial stage, the historical QoS records of n Web services form users can be collected. Here, we call it training dataM. In general, a service user could not have QoS records for allnservices, and usually has only very limited ones of them. As a result, training data is a sparse matrix in real-world scenarios. The matrix
M should be filled as full as possible so that it can pro-vide more useful information for QoS prediction. In the second step, we present a similarity-aware Slope One al-gorithm (SASO for short) as a way to fill the ‘NA’ (a.k.a.
null) records in the training data set. For the perspective of Web service execution, there maybe exist some abnormal QoS records in the above training data, especially for the QoS attribute with wide scale values. In order to handle
this problem, in the third step, we adoptstatistical process control(SPC) strategy to adjust such exception data.
Based on the above treatments, the training data set has been enhanced and its data density has a great promotion. According to the renewed training matrix, SASO algorithm is also utilized for predicting Web service’s QoS for active user. Finally, prediction quality is measured via error anal-ysis.
historical QoS records (sparse data)
missing value supplement algorithmSASO
abnormal data smoothing SPC-basedadjustment
enhanced training data
(dense data) active user’s
records
QoS prediction for active user
SASO algorithm
prediction quality analysis
Figure 2: The overall framework of Web service’s QoS pre-diction based on similarity-aware Slope One (SASO).
3.2
Prediction method
With regard to QoS prediction framework, it is not hard to find that SASO algorithm and SPC-based adjustment strat-egy play important roles for improving the precision. The details of these two key algorithms are addressed as fol-lows.
3.2.1 SASO algorithm
As mentioned before, Slope One-based CF exhibits its ad-vantage for sparse data. Since each active user has only
GN (usually GN << n) QoS records for n Web ser-vices, we adopt item-oriented Slope One method to predict QoS value for active user. However, the similarity between items is not taken into consideration in the basic Slope One prediction method. In our work, we introduce the similarity between two items into Slope One method to form a new QoS prediction algorithm for Web services. The basic idea is that, the service with the higher similarity should give the higher priority when considering the deviation in Slope One method.
iandj, their’s similarity can be calculated as follows.
Sim(i, j) =
P
u∈U(ru,i−¯ri)(ru,j−¯rj)
pP
u∈U(ru,i−r¯i)2
pP
u∈U(ru,j−r¯j)2 (4) whereU =UiTUj is the subset of users who have QoS records both on service i and service j previously (i.e., identical toUi,j in equation (2)), and¯ri represents the av-erage QoS value of serviceiobserved by different users.
To predict a missing valueru,jin the user-item matrix, we have to measure the similarities between j and other services invoked by useru, that is,Iu− {j}. After remov-ing the services with negative similarity to servicej from them, the remaining items are called the related services of j w.r.t. useru, denoted asR(j|u). It can be formally expressed as follows.
R(j|u) ={i|i∈Iu, Sim(i, j)>0, i6=j} (5)
Then, we give the prediction formula based on similarity-aware Slope One algorithm as below.
P(ru,j) =
1
card(R(j|u)) X
i∈R(j|u)
(wi,j·devj,i+ru,i) (6)
wherewi,jis an adjustment weight in accordance with the similarity betweenjand another servicei(i∈R(j|u)).
As for a further comment,wi,j can be computed by the following formula:
wi,j=
Simλ(i, j) P
k∈R(j|u)Simλ(k, j)
(7)
where λ (=1, 2 or 3) is a factor of adjustment strength, higher value means stronger adjustment. Meanwhile,
Simλ(k, j)isλpower ofSim(k, j), i.e.[Sim(k, j)]λ. It should be noted that, both two steps of missing value supplement and the final QoS prediction for active user adopt SASO algorithm (cf. equation (6)) to provide pre-diction value.
3.2.2 SPC-based smoothing strategy
Here, we denote the original service’s QoS record matrix as
M, and call the intermediate matrix after filling the missing values as M0. On the one hand, some exceptional QoS records for Web services perhaps exist inM. The so-called exceptional (or abnormal) record, means the QoS value of a specific user is far away from the records of neighbor users. On the other hand, it is also very sparse in the original state. As a result, the filled matrixM0 maybe contain some QoS items which are far from the common situation. Obviously, these abnormal records will cause bad influence on the next stage of prediction. Thus, we should identify them out from matrix M0 firstly, and then smooth them via a heuristic strategy.
In the paper, we borrow the idea from statistical pro-cess control(SPC) [14] to tackle the abnormal QoS data in
M0. SPC is a realtime monitoring technique for the process
of industrial production in the way of statistical analysis. It can scientifically distinguish the exceptional fluctuation from the normal random fluctuation, so it is used for pro-viding early warning for production process to manager. We mainly utilize this technique to pick out the abnormal QoS values so as to achieve better prediction performance.
At first, for matrixM0, we judge whether itemr u,i(i.e., the QoS of serviceifor useru) is an exception or not ac-cording to the following rule.
isAbn(ru,i) =
true, µi−θ·σi < ru,i < µi+θ·σi
f alse, otherwise
(8)
whereµiis the average QoS value of servicei(1≤i≤n), andσiis the standard deviation of servicei’s QoS records from different users. θis a positive integer used for regu-lating the normal range of QoS value. It is usually set to 3 in most applications of SPC.
When a suspected record of abnormal QoS is detected through the above approach, this isolated item should be smoothed before the prediction step. Here, we introduce a strategy called “small amplitude shift”for smoothing treat-ment. Suppose ru,i is an abnormal issue according to judgement of equation (8), the smoothing action can be performed via the following formula. The value after ad-justment is denoted asr˜u,i.
˜
ru,i=
µi−θ·σi, ru,i< µi−θ·σi
µi+θ·σi, ru,i> µi+θ·σi
ru,i, otherwise
(9)
That is to say, we use the upper (or lower) limit to replace the unusually high (or low) QoS record, respectively.
3.3
Computational complexity analysis
As shown in Figure 2, our algorithm mainly includes three linear steps as below.
(1)Complexity of missing value supplement. Obviously, the computational complexity for computing the similar-itySim(i, j)between two services (i.e. iandj) isO(m). Then, the complexity of computing similarities of all ser-vice pairs isO(mn2). At the same time, the computational complexity for calculating the deviation of each service pair is alsoO(mn2). Based on the above interim results, the complexity of providing the supplement value for each missing item is O(dn)(here, d stands fordensity). Ac-cordingly,O(d(1−d)mn2)is the complexity in respect to fill all missing items. Thus, the complexity of this step is
O(mn2).
(2)Complexity of abnormal data smoothing. The com-plexity of computing the mean value of QoS isO(m)for each Web service, soO(mn)is for allnservices. Mean-while, the complexity of smoothing action for all items in matrixM is alsoO(mn). Therefore, the complexity for smoothing the exceptional data isO(mn).
The complexity of computing the similarity and deviation between current Web service with all known GN services isO(m·GN). Therefore, the complexity of predicting all
n−GN missing values isO(m·GN(n−GN)). Altogether, the computational complexity of our ap-proach for an active user isO(mn2). In literature [5], the complexities of five steps have been discussed in detail. Based on the comprehensive analysis on the above com-plexities, the overall computational complexity of WSRec algorithm isO(m2n+mn2). As a result, our method and WSRec haven’t obvious distinction from the perspective of computation time.
4
Implementation and Experiments
4.1
Experimental setup
In order to validate the effectiveness of our proposed algo-rithm for QoS prediction, some experiments are employed on a public published data set1, which is collected by Zheng
et al. [5] and has been widely adopted in the current re-searches [7, 15]. The original data set contains 5825 ser-vice invocation records from 339 users, and QoS attributes includeresponse time(RT) andthroughput(TP).
In our experiments, we select partial QoS records related with 100 Web services and 150 users from the original data. Then, this data is randomly divided into two parts: training data and test data. Here, 100 users are selected as training users, that is, the data about them is treated as training data. The remaining 50 users are viewed as test users (i.e., the ac-tive userin the above section). In the real-world situation, the known QoS records for a user only occupy a very small part of all 100 services. For satisfying the actual condition, some records are removed from training data matrix to con-struct three kinds of sparse data sets, whose data densities are set as 5%, 10% and 15%, respectively.
Similarly, for active users, we only retainGN(=5, 10 or 20) QoS records for each one of them. The records which are kicked out from test data set are treated as real data for prediction quality evaluation. The main parameters in our experiments are listed in Table 2.
4.2
Comparative analysis
In general, recommendation system uses mean absolute er-ror (MAE) to evaluate prediction effect. It is the average of difference values between the predicted QoS and the real record.
MAE=
P
U,S|P(ru,s)−ru,s|
N (10)
whereP(ru,s)is the predicted QoS value of services ob-served by user u,ru,s is the real QoS value of service s w.r.t. useru, andN is the total number of predictions.
Since the range of service’s QoS value may be different from each other, MAE is not objective enough to reflect
1WS-DREAM data set, http://www.wsdream.net:8080 /wsdream/
the accuracy of prediction algorithm. Here, we adopt the normalized MAE (NMAE) as a metric to compare the pre-diction quality of three algorithms.
NMAE=PMAE
U,S ru,s
N
(11)
It is not hard to find that, the smaller NMAE value means the more accurate prediction algorithm.
For the purpose of comparison, WSRec algorithm and basic Slope One algorithm are also implemented in our ex-periments. All three algorithms run on the same data set described in the above subsection. Other particular settings of WSRec algorithm are in accordance with reference [5]. For QoS attribute response time (RT) and throughput (TP), the comparisons on three algorithms are performed respec-tively. In the experiments, we repeated 100 times for each case ofdensity andGN value, and reported the average NMAE metrics.
The experimental results (i.e. NMAEs) on QoS attribute response time (RT) are shown in Table 3. It is clear that our SASO algorithm can outperform WsRec and basic Slope One algorithm for most cases. Whendensity=5%, the ba-sic Slope One can get the best result for the case ofGN=5, but algorithm SASO (λ=1) overcomes other two algorithms for the remaining cases about GN. For the rest values (i.e. 10% and 15%) of density, algorithm SASO (λ=3) can achieve the lowest NMSE for nearly all cases except of
density=15% andGN=20. On the whole, SASO’s perfor-mance is better than those of WsRec and basic Slope One for almost all situations, especiallyλ=2 or 3.
The NMAE values of three algorithms on QoS attribute throughput (TP) are shown in Table 4. It is not hard to find our algorithm SASO (λ=3) has obvious improvement both for WsRec and basic Slope One, except of the case ofdensity=15% andGN=20. With regard to SASO algo-rithm itself, the predication error of SASO reduces with the increase ofλvalue. Whenλreaches to 2, algorithm SASO outperforms other two algorithms in most conditions.
According to the above experimental analysis, we can reasonably draw a conclusion that our SASO algorithm is a better choice than WsRec and basic Slope One for service’s QoS prediction, especially when the data density of user-service record matrix is low.
4.3
Filling pattern analysis
No. Parameter Value Description
1 m 150 The number of service users, 100 users
for training and the rest for test.
2 n 100 Service number.
3 density(d) 5%, 10% or 15% Data density of the training matrix. 4 Given Number
(GN) 5, 10 or 20
The number of known QoS records for each active user.
5 λ 1, 2 or 3 The factor of adjustment strength.
Table 2: Parameter settings for service QoS prediction algorithm.
Algorithm d=5% d=10% d=15%
GN=5 GN=10 GN=20 GN=5 GN=10 GN=20 GN=5 GN=10 GN=20
Slope One 0.6306 0.6142 0.6015 0.6050 0.5878 0.5718 0.5951 0.5819 0.5665 WsRec 0.6463 0.6240 0.6110 0.6001 0.5762 0.5578 0.5755 0.5596 0.5221 SASO
λ=1 0.6330 0.6107 0.5957 0.5923 0.5719 0.5570 0.5821 0.5645 0.5492
λ=2 0.6350 0.6123 0.5960 0.5856 0.5654 0.5514 0.5721 0.5537 0.5401
λ=3 0.6375 0.6155 0.5987 0.5825 0.5627 0.5491 0.5652 0.5472 0.5348
Table 3: Experimental results (NMAEs) for the algorithm Slope One, WsRec and SASO for the QoS attribute RT.
by using a two-stage filling strategy: SASO algorithm can be used for filling data when the matrix is relative sparse (i.e. d0≤ρ). Once training matrix reaches to a certain de-gree of density (i.e. d0 > ρ), we used Pearson correlation-based method to supply the missing values.
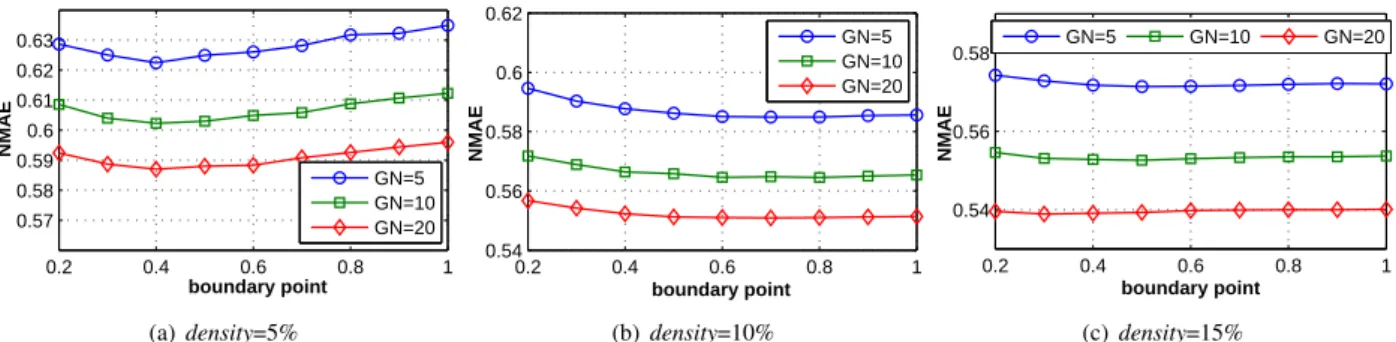
In order to validate the effect of the above two-stage fill-ing pattern, the trainfill-ing matrixes with differentρare pre-pared for SASO prediction algorithm. The experimental results are shown in Figure 3-6. On the whole, the two-stage filling strategy has certain improvement for some sit-uations, but it is not so obvious. Specifically speaking, for the case ofdensity=5%, the optimal boundary point is
ρ= 0.4for QoS attribute response time (TR). The NMAE value gradually declines whenρis lower than 0.4. Instead, when ρexceeds the best point 0.4, prediction error will slowly climb with the increase ofρ’s value. On the second attribute throughput (TP), the trend of NMAE’s change is relatively simple, that is, the error descends with the in-crease of value of boundary point (ρ).
For the second casedensity=10%, the change trends of prediction error for two QoS attributes are highly consis-tent. From the overall point of view, NMAE basically decreases along with the growth of ρ’s value. However, NMAE has a little drop at the point ofρ=0.7. As a conse-quence, the best boundary point for this case is 0.7.
While considering the last case (i.e. density=15%), the change trend of prediction error for attribute RT is very similar to the second case of this attribute, just the current fluctuation is too small. There is an exceptional case for attribute TP whenρ=0.2, the corresponding NMAE value is suddenly low. Meanwhile, the prediction error value has a relatively high value at pointρ=0.3. Subsequently, it has a small reduction at first and then gradually takes off. The optimal boundary point in this case can be considered as 0.5 for most situations.
On the whole, we can argue that the two-stage filling strategy has a small improvement w.r.t prediction error. Considering the selection of boundary point, the value in
the domain from 0.5 to 0.7 is worth considering in prac-tice.
5
Related work
From the perspective of service users, how to select a suit-able service is a critical step to build a relisuit-able software sys-tem. In general, service selection is mainly in accordance with the property of QoS. Accordingly, QoS prediction for Web services has caused widespread attention in the field of service computing.
As we mentioned earlier, Pearson correlation-based al-gorithms are the main-stream strategies to treat such prob-lem at current stage. Shaoet al. [4] firstly attempted to use Pearson similarity-based collaborative filtering to provide the QoS value of a specific Web service. But their exper-iments are performed on a data set in small scale, and the error analysis is not so sufficient. Subsequently, Zhenget al. [5] firstly collected plenty of QoS records from different service users via a monitoring platform Planet-lab2. Then, they combined user-based and item-based CF together to form a comprehensive algorithm (i.e. WsRec) for service’s QoS prediction. Their WsRec exhibits better performance than the single user-based or item-based prediction algo-rithm.
Recently, some improvements on Pearson correlation-based algorithm have been proposed. Liu’s research group presented a personalized hybrid collaborative filter-ing (PHCF) algorithm by considerfilter-ing the personal informa-tion about service user [7]. However, it is not so easy to ob-tain such personal information, so the application of their method is limited. Reference [15] adopted an improved similarity measure for Web service similarity computation, and the corresponding normal recovery collaborative filter-ing (NRCF) was proposed for personalized Web service recommendation. In essence, it is only a minor modify
Algorithm d=5% d=10% d=15%
GN=5 GN=10 GN=20 GN=5 GN=10 GN=20 GN=5 GN=10 GN=20
Slope One 0.5115 0.5083 0.5054 0.4901 0.4873 0.4815 0.4793 0.4795 0.4707 WsRec 0.5326 0.5245 0.5195 0.4798 0.4724 0.4670 0.4579 0.4520 0.4404 SASO
λ=1 0.5050 0.5007 0.4968 0.4793 0.4736 0.4657 0.4687 0.4657 0.4571
λ=2 0.5027 0.4967 0.4918 0.4735 0.4663 0.4582 0.4616 0.4566 0.4488
λ=3 0.5015 0.4946 0.4888 0.4701 0.4620 0.4533 0.4567 0.4502 0.4426
Table 4: Experimental results (NMAEs) for the algorithm Slope One, WsRec and SASO for the QoS attribute TP.
on the similarity measure for the WsRec prediction frame-work. In addition, Shiet al. [16] presented a linear regres-sion prediction algorithm for Web service’s QoS based on clustering user in respect to location and network condi-tion. It is not hard to find that the distance between users plays a significant role for prediction precision, however, which is not easily measured in practice.
Of course, there are also some Slope One-based meth-ods for service’s QoS prediction. Reference [6] presented a personalized context-aware QoS prediction method based on the Slope One approach. In this work, the basic Slope One algorithm is used for prediction, but it has been vali-dated to be not very precise in our experiments. Then, Liet al. [17] utilized an enhanced Slope One method called Bi-Polar Slope One to predict the ratings of Web services. On the one hand, their approach mainly aims at the rating pre-diction problem. On the other hand, Bi-Polar phenomenon maybe exists in the data set in rating style, but not obvious in QoS data (i.e. the continuous data type).
With regard to the combination of Slope One and Pear-son similarity, the preliminary researches in [18] and [19] have contributed an incipient idea for blending them to-gether. However, the above works merely provide a prim-itive form of similarity-aware Slope One prediction algo-rithm, that is, the case ofλ=1 in our work. As shown in our experimental results, this basic form without weight adjust-ment is not very effective for QoS prediction problem. At the same time, the experimental analysis and discussion are very limited in their work. Besides the weight adjustment strategy illustrated in formula (7), here, a more important strategy named SPC-based smoothing is also proposed to reduce prediction error.
6
Conclusion
With the widespread application of service computing, Web services have been viewed as a prevalent form of com-ponents for building software on the Web. In order to en-sure the reliability and trustworthy of the composite soft-ware system, users generally are very concerned about the quality of service. Unfortunately, the QoS metrics of some services can not be provided due to the actual situation. Therefore, how to predicate QoS of Web service becomes a valuable task in the field of service engineering.
In the paper, we introduce the Pearson similarity be-tween Web services into Slope One collaborative filtering for solving QoS prediction problem. Instead of assigning
the identical weight to each service, we adjust Pearson sim-ilarity as a weight for differentiating the deviation between services. In order to improve the prediction accuracy, a SPC-based smoothing is presented for correcting the ex-ceptional data. In the empirical aspects, besides our ap-proach, the basic Slope One and the well-known WsRec algorithm are also implemented. Meanwhile, the compara-tive analysis is also performed on the public published data set. The experimental results indicate that our hybrid algo-rithm (SASO) outperforms other two methods in the term of prediction precision. The SPC-based smoothing strategy can effectively handle the noise data so as to reduce predic-tion error. Furthermore, an addipredic-tional strategy called two-stage filling is studied, and the appropriate boundary point for transforming filling methods is also suggested here.
The practice of SASO algorithm is obvious, it can guide users to pick out desired services from cloud platform. At the same time, this algorithm can also be used in the field of E-commerce to help consumers choose goods. Of course, although our approach achieves some promising results at present, there are still quite a few complicated issues should be further investigated. For instance, the QoS prediction for Web services from the dynamic perspective [20], as well as the service quality prediction in the environment of mobile computing. In addition, to find more effective data filling algorithm for training data is an interesting research direc-tion.
Acknowledgement
0.2 0.4 0.6 0.8 1 0.57
0.58 0.59 0.6 0.61 0.62 0.63
boundary point
NMAE
GN=5 GN=10 GN=20
(a)density=5%
0.2 0.4 0.6 0.8 1 0.54
0.56 0.58 0.6 0.62
boundary point
NMAE
GN=5 GN=10 GN=20
(b)density=10%
0.2 0.4 0.6 0.8 1 0.54
0.56 0.58
boundary point
NMAE
GN=5 GN=10 GN=20
(c) density=15%
Figure 3: The NMAEs on attribute RT for different boundary points (λ=2).
0.2 0.4 0.6 0.8 1 0.57
0.58 0.59 0.6 0.61 0.62 0.63
boundary point
NMAE
GN=5 GN=10 GN=20
(a)density=5%
0.2 0.4 0.6 0.8 1 0.54
0.56 0.58 0.6
boundary point
NMAE
GN=5 GN=10 GN=20
(b)density=10%
0.2 0.4 0.6 0.8 1 0.53
0.54 0.55 0.56 0.57 0.58
boundary point
NMAE
GN=5 GN=10 GN=20
(c) density=15%
Figure 4: The NMAEs on attribute RT for different boundary points (λ=3).
0.2 0.4 0.6 0.8 1 0.49
0.5 0.51 0.52 0.53
boundary point
NMAE
GN=5 GN=10 GN=20
(a)density=5%
0.2 0.4 0.6 0.8 1 0.45
0.46 0.47 0.48 0.49
boundary point
NMAE
GN=5 GN=10 GN=20
(b)density=10%
0.2 0.4 0.6 0.8 1 0.44
0.45 0.46 0.47
boundary point
NMAE
GN=5 GN=10 GN=20
(c) density=15%
Figure 5: The NMAEs on attribute TP for different boundary points (λ=2).
0.2 0.4 0.6 0.8 1 0.49
0.5 0.51 0.52
boundary point
NMAE
GN=5 GN=10 GN=20
(a)density=5%
0.2 0.4 0.6 0.8 1 0.45
0.46 0.47 0.48
boundary point
NMAE
GN=5 GN=10 GN=20
(b)density=10%
0.2 0.4 0.6 0.8 1 0.435
0.44 0.445 0.45 0.455 0.46
boundary point
NMAE
GN=5 GN=10 GN=20
(c) density=15%
References
[1] M. P. Papazoglou and D. Georgakopoulos, (2003). Serive-Oriented Computing,Communcications of the ACM, Vol. 46, No. 10, ACM Press, pp. 25–65.
[2] D. A. Menasce, (2002). QoS issues in Web services,
IEEE Internet Computing, Vol. 6, No. 6, IEEE CS Press, pp. 72–75.
[3] J. B. Schafer, J. Konstan, and J. Riedi, (1999). Rec-ommender Systems in E-Commerce,Proc. of the 1st ACM Conference on Electronic Commerce (EC’09), ACM Press, Denver, CO, USA, pp. 158–166.
[4] L. Shao, J. Zhang, Yong Wei, andet al., (2007). Per-sonalized QoS Prediction forWeb Services via Col-laborative Filtering,Proc. of the IEEE International Conference on Web Services (ICWS’07), IEEE CS Press, Salt Lake City, Utah, USA, pp. 439–446.
[5] Z. Zheng, H. Ma, M. R. Lyu, and I. King, (2011). QoS-Aware Web Service Recommendation by Col-laborative Filtering, IEEE Trans. on Services Com-puting, Vol.4, No. 2, IEEE CS Press, pp. 140–152.
[6] Q. Xie, K. Wu, J. Xu, and et al., (2010). Person-alized Context-Aware QoS Prediction for Web Ser-vices Based on Collaborative Filtering,Proc. of the 6th International Conference on Advanced Data Min-ing and Applications (ADMA’10), Part II, Springer-Verlag Berlin, Chongqing, China, pp. 368–375.
[7] Y. Jiang, J. Liu, M. Tang, and X. Liu, (2011). An Effective Web Service Recommendation Method based on Personalized Collaborative Filtering,Proc. of IEEE International Conference on Web Services (ICWS’11), IEEE CS Press, Washington, DC, USA, pp. 211–218.
[8] A. K. Menon, K. P. Chitrapura, S. Garg, and et al., (2011). Response Prediction using Collabora-tive Filtering with Hierarchies and Side-information,
Proc. of the 17th ACM SIGKDD International Con-ference on Knowledge Discovery and Data Mining (KDD’11), ACM Press, San Diego, CA, USA, pp. 141–149.
[9] D. Lemire and A. Maclachlan, (2005). Slope One Pre-dictors for Online Rating-Based Collaborative Filter-ing,Proc. of the 2005 SIAM International Data Min-ing Conference (SDM’05), Newport Beach, Califor-nia, USA, pp. 1–5.
[10] X. Su and T. M. Khoshgoftaar, (2009). A Survey of Collaborative Filtering Techniques,Advances in Ar-tificial Intelligence, Hindawi Publishing Corporation, pp. 1–19.
[11] Linyuan Lü, Matéš Medo, Chi Ho Yeung, and et al., (2012). Recommender Systems,Physics Reports, Vol. 519, No. 1, Elsevier B. V., pp. 1–49.
[12] S. Vucetic and Z. Obradovic, (2000). A Regression-based Approach for Scaling-up Personalized Recom-mender Systems,Proc. of the ACM WebKDD Work-shop (WebKDD’00), Boston, MA, USA, pp. 1–9.
[13] B. M. Sarwar, G. Karypis, J. A. Konstan, and J. Riedl, (2001). Item-based Collaborative Filtering Recom-mender Algorithms, Proc. of the 10th International Conference on World Wide Web (WWW’01), ACM Press, Hong Kong, China, pp. 285–295.
[14] J. Oakland, (2003). Statistical Process Control, the 5th Revised Edition, Butterworth-Heinemann Ltd.
[15] H. Sun, Z. Zheng, J. Chen, and M. R. Lyu, (2011). NRCF: A Novel Collaborative Filtering Method for Service Recommendation, Proc. of IEEE Interna-tional Conference on Web Services (ICWS’11), IEEE CS Press, Washington, DC, USA, pp. 702–703.
[16] Y. Shi, K. Zhang, B. Liu, and L. Cui, (2011). A New QoS Prediction Approach Based on User Clustering and Regression Algorithms,Proc. of IEEE Interna-tional Conference on Web Services (ICWS’11), IEEE CS Press, Washington, DC, USA, pp. 726–727.
[17] J. Li, L. Sun, and J. Wang, (2012). A Slope One Collaborative Filtering Recommendation Algo-rithm Using Uncertain Neighbors Optimizing,Proc. of WAIM 2011 International Workshops, Springer-Verlag Berlin, Wuhan, China, pp. 160–166.
[18] P. Wang and H. W. Ye, (2009). A Personal-ized Recommendation Algorithm Combining Slope One Scheme and User Based Collaborative Filter-ing,Proc. of International Conference on Industrial and Information Systems (IIS’09), IEEE CS Press, Haikou, China, pp. 152–154.
[19] D. J. Zhang, (2009). An Item-based Collaborative Fil-tering Recommendation Algorithm Using Slope One Scheme Smoothing,Proc. of the Second International Symposium on Electronic Commerce and Security (ISECS’09), Vol. 2, IEEE CS Press, Nanchang, China, pp. 215–217.