Hungarian Association of Agricultural Informatics European Federation for Information Technology in Agriculture, Food and the Environment
Journal of Agricultural Informatics. Vol. 8, No. 1 journal.magisz.org
Evaluation of cellulose content by infrared spectroscopy
János Jóvér1, Attila Nagy2, János Tamás3,
I N F O
Received 6 Feb.. 2017 Accepted 10 Mar. 2017 Available on-line 15 Mar. 2017 Responsible Editor: M. Herdon
Keywords:
Cellulose content, spectral curve, non-invasive measurements, Cellulose Absorption Index, applied informatics
A B S T R A C T
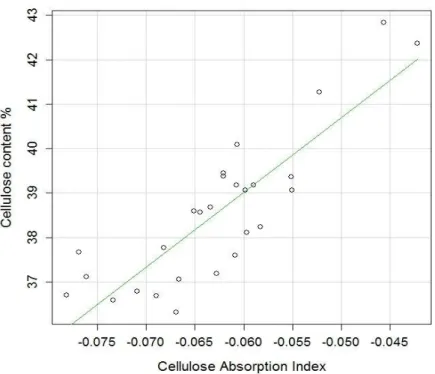
Cellulose is one of the most abundant organic chemical material in the world which is a raw material for several fields. In many cases this material is appearing as residue in the agriculture and forestry. Thus the application of cellulose as secondary raw material is desirable which requires a rapid estimation method reflecting the potential amount of cellulose stocks. The remote sensing based Cellulose Absorption Index (CAI) is an adequate method to make objective estimations of the quantity plant litters on soil surfaces. By the application of infrared spectroscopy CAI can be calculated to make rapid estimation of cellulose content in laboratory scale. In this research work cellulose contents of sweet sorghum bagasse were measured by the method of Van Soest. Based on the absorbance values determined in A.U. CAI values of the sweet sorghum bagasse samples were calculated. As a result a notable correlation (R2=0.733) was found between the measured cellulose values and the modified Cellulose Absorption Index.
1. Introduction
Plant fibers have high strength, low density and high sustainability (Hepworth et al. 2000; Madsen & Lilholt 2003). According to Klinke et al. (2001) the fiber tensile strength and elastic modulus depend on the cellulose content squared. Cellulose is a linear structured glucose polymer which is the most abundant material appearing in the world (Granström 2009). As a chemical raw material, cellulose and its derivatives are widely utilized in many fields, such as the production of paper, textile and pharmaceuticals (Lavanya et al., 2011).
Primer biomass is widely used for energy purposes but the utilization of the secondary biomass sources can be more adequate in the sustainable energy production. Cellulose as a by-product of the agricultural industries or energy crops, is digestible by microorganisms for energy (Watanabe 2013) hence bioethanol produced from cellulosic biomass is a promising renewable energy source (Wagner & Kaltschmitt 2013). In contrast to first generation bioethanol, which is derived from sugar or starch, cellulosic ethanol may be produced from agricultural residues. The ability to make fuel from locally sourced, secondary non-food feedstocks makes cellulosic bioethanol an effective method for reducing dependence on fossil fuels.
Based on the utilization possibilities the determination of cellulose content in plants can be very important. Cellulose is a basic compound of the cell wall and appearing with hemicelluloses and lignin which make the determination process difficult. The determination of these fibers is based on chemical processes (Van Soest et al. 1991; Zhao et al. 2009; Erdei 2013; Khalil et al. 2015). Chemical determination of cellulose and other fibers of the cell wall is a difficult and time consuming process while in several fields of the agriculture the application of non-invasive spectral measurements provides rapid and reliable data (Riczu et al. 2012; Nagy et al., 2014). By the utilization of applied informatics spectral data can be visualized as spectral curves moreover several mathematical
1 János Jóvér
University of Debrecen, 4032, Debrecen, Böszörményi út 138, Hungary [email protected]
2 Attila Nagy
University of Debrecen, 4032, Debrecen, Böszörményi út 138, Hungary [email protected]
opportunities are available. Thus the application of vegetation indices (e.g.: Leaf Area Index, Normalized Difference Vegetation Index, Enhanced Vegetation Index etc.) calculated by spectral data can be an adequate method to receive information rapidly about plant vegetation. In the field of cellulose content determination the Cellulose Absorption Index (CAI) can be utilized which was worked out to discriminate plant litter from soil based on the absorbance values of electromagnetic radiations in the range of 2000 nm to 2200 nm (Daughtry et al., 1996).
In this study the analysis of spectral curve of sweet sorghum bagasse was made so as to calculate a modified CAI. Index values were compared with the measured cellulose contents in order to evaluate reliability of the index values within laboratory scale. The goal of the current research work was to evaluate the application possibilities of CAI in the field of rapid determination of cellulose.
2. Materials and methods
Sorghum bagasse was derived from the Research Institute of Karcag. After chopping, the air-dry bagasse was grinded first with a rough-, then a fine grinder (Condux) in order to achieve the size from 0.1 mm to 2 mm. Fiber content determinations of the sorghum bagasse samples were conducted according to Georging & Van Soest (1975) where samples were analyzed to acid-detergent fiber fraction (ADF), neutral detergent fiber fraction (NDF) and acid detergent lignin (ADL) (Figure 1). Due to the time consuming characteristics of this analytical process (approximately 6,5 hours/sample) this preliminary research work was based on the results of 27 sorghum samples.
Figure 1. Determination scheme of carbohydrate fibers based on the findings of Van Soest
The calculation of cellulose content were done as follows:
Cellulose content = ADF - ADL
The absorbance measurements were carried out by AvaSpec NIR256-2.5-HSC Fiber Optic Spectrometer within 1000–2500 nm interval. During the measurement the average spectral resolution was 6.43 nm. The AvaSpec 2048 system consists of a spectrometer (detector) and connected by an 8
isolated from the external light. The end of the optical fiber was positioned 5 mm above the surface of each sample. Spectral data were managed by AvaSoft 8.2 software.
Figure 2. Light source, detector and sampling black box of the applied spectrometer
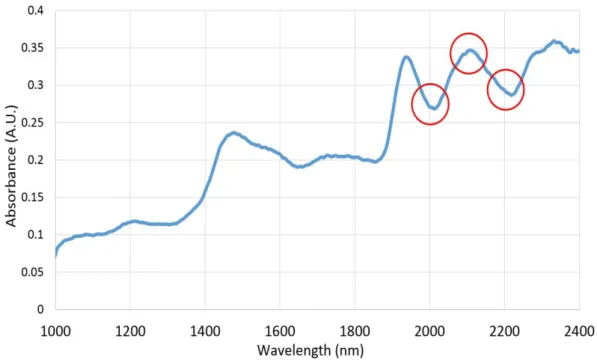
During the measurements the integration time was set as 57.03 ms while absorbance spectral data were worked out as averages of 30 measurements with a pixel smoothing number of 3. Spectral data were exported to Microsoft Office Excel in order to visualize spectral curves in a same plot and to make further calculations. Measurements were done on air-dry samples in order to avoid the alteration of spectral curves caused by water. Absorptions in the 2000 nm to 2200 nm range are sensitive to cellulose (Nagler et al. 2003), so that based on the measured spectral data within this interval the Cellulose Absorption Index was calculated (Eq. 1) which is a commonly used index to indicate exposed surfaces containing dried plant material (Daughtry 2001; Daughtry et al. 2004). This index provides the possibility to discriminate pure soil surfaces from pure scenes of some crop residues and tree litters in the case of arable lands (Daughtry et al. 1996; Nagler 1997). Based on the detected reflectance values this index ranges from -3 to more than 4. Positive values of CAI represent the presence of cellulose while a negative value means the absence of this chemical material.
Eq. 1 CAI = 0.5(ρ2000 + ρ2200)-ρ2100
According to Elvidge (1988; 1990) 2100 nm, 2180-2220 nm and 2310-2380 nm spectral ranges are sensitive to lignocellulose compounds. Thus the presence of hemicellulose and lignin can modify the value of CAI.
In this research CAI values were calculated by the measured absorbance values determined in A.U. (Absorbance Unit) in order to evaluate the application possibilities of this index to determine cellulose content in plant materials if it is calculated by absorbance values directly. The relation of cellulose content and the modified CAI was evaluated by linear regression analysis using R statistical software with R Studio user surface (R Core Team 2016).
3. Results and discussion
Based on the measured data the average Acid Detergent Fiber content was 42.63% with the standard deviation of 4.32%. In the case of Acid Detergent Lignin the average value was 3.80±2.15%. According to the calculations cellulose contents were varied between 36.31% and 42.84%. The average cellulose content of the samples was 38.55% with a standard deviation value of 1.69% and 38.56% median value.
Correlation between absorbance values detected on the wavelength’s of 2000 nm (R2=0.01), 2100 nm (R2=0.04), 2200 nm (R2=0.02) and cellulose contents were not found. The reason of this phenomenon can be the fact that CAI was worked out for remote sensing detecting soil covering plant litters. Thus CAI estimate the senescent plant covering of soils and do not assess directly the spectral features of cellulose content in plant materials. In this case the spectral features of soil surface stoutly prevail. Spectral characteristics of soils and plant materials are different therefore lands with different rate of plant litter covering can be distinguished based on their heterogenic spectral characteristics. In that case cellulose sensitivity is strongly corresponding with the plant litter ground cover, and not with the exact amount of cellulose content.
In this study the cellulose content of plant textures were evaluated, and cellulose contents were not heterogenic enough so as to detect differences among the evaluated samples in the spectral bands of CAI. Nevertheless further calculations were carried out by spectral bands of CAI based on the scientific results of Roberts et al. (1990, 1993), Daughtry et al. (1996) and Nagler et al. (2003).
Figure 3. The spectral curve of the average absormance values
Figure 4. The correlation of Cellulose Absorption Index with the measured cellulose contents
In the study of Daughtry et al. (1996) CAI (calculated by reflectance) was applied to discriminate plant litters from soil surface and the absorption features of this index were described as the depth of the lignocellulose absorption feature. Nevertheless strict correlation with CAI was found only in the case of the cellulose content of these materials. Correlation of CAI values between lignin (R2=0.01), hemicellulose (R2=0.01) or total lignocellulose (R2=0.05) contents were not found. Thus discrimination of plant litter from pure soil surface by CAI can be based on the cellulose content of these materials.
According to results Cellulose Absorption Index determined by absorbance can be adequate for the rapid estimation of cellulose content in plant materials so as to qualify plant materials. By this way of spectral analysis can result rapid result of cellulose content which can be a useful information in several specific agricultural fields.
3. Conclusions
Cellulose Absorption Index is a commonly used vegetation index in the field of remote sensing discriminating plant materials from pure surfaces. The determination of this index is based on the reflectance features of the spectral bands of 2000 nm, 2100 nm and 2200 nm. According to the results of this preliminary study Cellulose Absorption Index is an adequate value to estimate cellulose content in plant materials on laboratory scale. By the application of infrared spectroscopy with applied informatics tools rapid values can be received about cellulose contents. These results can useful in the process of plant breeding (e.g.: in breeding methods to eliminate risks caused by falling down), or in the field of bioenergy as well (Lee et al. 2017). According to some scientific results CAI is applicable to dry senescent plant materials but in the current study correlation was found only between CAI and cellulose content. Therefore our further studies will focus on the determination of spectral bands which are potentially sensitive for hemicellulose and lignin and the total lignocellulose content which are also important compounds of dry senescent plant materials.
References
Daughtry, CST, Hunt Jr. ER, & McMurtrey III. JE, 2004, ‘Assessing Crop Residue Cover Using Shortwave Infrared Reflectance’ Remote Sensing of Environment, vol. 90 pp. 126-134. doi:
10.1016/j.rse.2003.10.023
Daughtry, CST, McMurtrey III JE, Nagler PL, Kim MS & Chappelle EW, 1996, ‘Spectral reflectance of soils and crop residues’ In: A.M.C. Davies & and P. Williams (Eds.): Near Infrared Spectroscopy: The future waves, pp 505-511. Chichester, UK: NIR Publications.
Elvidge, CD, 1988, ‘Examination of the spectral features of vegetation in 1987 AVIRIS data’ Proceedings of the First AVIRIS Performance Evaluation Workshop, Pasadena, CA. JPL Publication, 97-101.
Elvidge, CD, 1990, ‘Visible and near infrared reflectance characteristics of dry plant materials’
International Journal of Remote Sensing, vol. 11 pp.1775-1795.
Erdei, É, 2013, ‘Investigation of the valuable parameters of silage maize and sweet sorghum genotypes produced by mutation and heterosis breeding, in terms of silage and bioethanol production. Doctoral thesis. University of Debrecen
Georging, HK. & Van Soest, PJ, 1975. Agricultural Hand Book. U.S.D.A., p. 379.
Granström, M, 2009, ‘Cellulose derivates: Synthesis, Properties and applications’ Academic Dissertation, University of Helsinki
Hepworth, DG, Bruce, DM, Vincent, JFV. & Jeronimidis G, 2000, ‘The manufacture and mechanical testing of thermosetting natural fibre composites’ Journal of Materials Science vol. 35 pp. 293 –298.
Klinke, HB, Lilholt, H, Toftegaard, H, Andersen, TL, Schmidt, AS & Thomsen, AB, 2001, ‘Wood and plant fibre reinforced polypropylene composites’ In: 1st world conference on biomass for energy and industry. James & James (Science Publishers), pp. 1082 –1085.
Lavanya, D, Kulkarni, PK, Dixit, M, Raavi, PR & Krishna, LNV, 2011, ‘Sources of cellulose and their applications- A review’ International journal of drug formulation and research, vol. 2 pp. 19-38. Lee, YG, Jin,YS, Cha, YL, Seo, JH, 2017, ‘Bioethanol production from cellulosic hydrolysates by engineered industrial Saccharomyces cerevisiae’ Biosource Technology, vol. 228. pp. 355-361. doi:
10.1016/j.biortech.2016.12.042
Madsen, B, & Lilholt, H, 2003, ‘Physical and mechanical properties of unidirectional plant fibre composites – an evaluation of the influence of porosity’ Composite Science Technology, vol. 63 pp. 1265 –1272. doi: 10.1016/s0266-3538(03)00097-6
Nagler, PL, 1997, ‘Plant litter spectral reflectance’ Master’s thesis. University of Maryland.
Nagler, PL, Inoue, Y, Glenn, EP, Russ, AL & Daughtry, CST, 2003, ‘Cellulose absorption index (CAI) to quantify mixed soil-plant litter scenes’ Remote sensing of environment, vol. 87 pp. 310-325. doi: 10.1016/j.rse.2003.06.001
Nagy, A, Riczu, P, Gálya, B & Tamás, J, 2014, ‘Spectral estimation of soil water content in visible and near infra-red range’ Eurasian Journal of Soil Science, vol. 3 pp. 163-171. doi:
10.18393/ejss.69645
R, Core, Team, 2016, ‘R: A language and environment for statistical computing’ R Foundation for Statistical Computing, Vienna, Austria. URL https://www.R-project.org/.
Roberts, DA, Smith, MO, Adams, JB, Sabol, DE, Gillespie, AR & Willis, SC, 1990, ‘Isolating woody plant material and senescent vegetation from green vegetation in AVIRIS data’ Proceedings of the Second Airborne Visible/Infrared Imaging Spectrometer (AVIRIS) Workshop, JPL Publication, vol. 90 pp. 42-57.
Riczu, P, Bíró, G, Sulyok, E, Nagy, A, Tamás, J & Szabó, Z, 2012, ‘Determination of chlorophyll content in case of peach leaf curl disease (Taphrina deformans) with spectral analysis’ International Journal of Horticultural Science vol. 18 pp. 49-52.
Khalil, SRA, Abdelhafez, AA & Amer, EAM, 2015, ‘Evaluation of bioethanol production from juice and bagasse of some sweet sorghum varieties’ Annals of Agricultural Science, vol. 60 317–324. doi:
10.1016/j.aoas.2015.10.005
Van Soest, PJ, Robertson, JB & Lewis, BA, 1991. ‘Methods for dietary fiber, neutral detergent fiber, and non-starch polysaccharides in relation to animal nutrition’ Journal of Dairy Science, vol. 74 pp. 3583–3597. doi: 10.3168/jds.s0022-0302(91)78551-2
Wagner H & Kaltschmitt M. 2013, ‘Biochemical and thermochemical conversion of wood to ethanol – simulation and analysis of difference processes’ Biomass Convers Biorefinery, vol. 3 pp. 87–102. doi:
10.1007/s13399-012-0064-0
Watanabe TE, 2013, ‘Introduction: potential of cellulosic ethanol’ In: Faraco V, editor. Lignocellulose conversion: enzymatic and microbial tools for bioethanol production, Springer, Berlin doi:
10.1007/978-3-642-37861-4_1