P1960
Security of Supply in Curaçao’s
Electricity System
Report on Trip Events in February 2020
Prepared for:
Aqualectra
Curaçao - Netherland Antilles
Publisher:
All content of this report is Copyright © DIgSILENT, 2020.
Unless otherwise stated, the content (including text, graphics, logos, images and attached documents), design and layout of this report is the property of DIgSILENT. Any unauthorized publication, copying, hiring, lending or reproduction is strictly prohibited and constitutes a breach of copyright.
DIgSILENT GmbH
Heinrich-Hertz-Straße 9 D-72810 Gomaringen Tel.: +49 7072 9168 - 0 Fax: +49 7072 9168- 88 http://www.digsilent.de
Please contact
Flavio Fernández T: +49 (0)7072 9188-55 [email protected]
Document Revision History
Version Status File Issued Prepared by
01 First Version
P1960_Aqualectra_Security-of-Supply_REPTRIP01_R02_V01.docx 02.04.2020 M. Schmieg J. Gómez
02 Second Version
Table of Contents
1 INTRODUCTION ... 6
2 MONITORING SYSTEMS ... 7
2.1 SCADA ... 7
2.2 PFM ... 7
2.2.1 PFM Dokweg 66 kV... 10
2.2.2 PFM Isla 66 kV ... 11
3 EVENTS ON 10TH OF FEBRUARY 2020 ... 12
3.1 1STEVENT ... 13
3.1.1 PFM Recording ... 13
3.1.2 SCADA ... 17
3.2 2NDEVENT ... 20
3.2.1 PFM Recording ... 20
3.2.2 SCADA ... 24
3.3 OBSERVATIONS AND PRELIMINARY CONCLUSIONS... 25
4 EVENTS ON 11TH OF FEBRUARY 2020 ... 27
4.1 1STEVENT ... 28
4.1.1 PFM Recording ... 28
4.1.2 SCADA ... 32
4.2 2NDEVENT ... 35
4.2.1 PFM Recording ... 35
4.2.2 SCADA ... 42
4.3 OBSERVATIONS AND PRELIMINARY CONCLUSIONS... 45
5 CONCLUSIONS AND RECOMMENDATIONS ... 47
List of Abbreviations
PFM DIgSILENT Monitoring System
SCADA Supervisory Control and Data Acquisition
1
Introduction
On the 10th and 11th of February 2020, several events occurred in the power system of Aqualectra in
Curaçao which led to complete or partial blackouts. This report includes the analysis of the sequence of events and the results of the preliminary investigations.
2
Monitoring Systems
2.1
SCADA
The SCADA system used by Aqualectra monitors, among others, voltage, frequency, active and reactive power in multiple locations in the power system.
The recordings provided by Aqualectra [1] [2] correspond to February, and they include measurement for all days and hours of this month with a 1-minute resolution (average values).
2.2
PFM
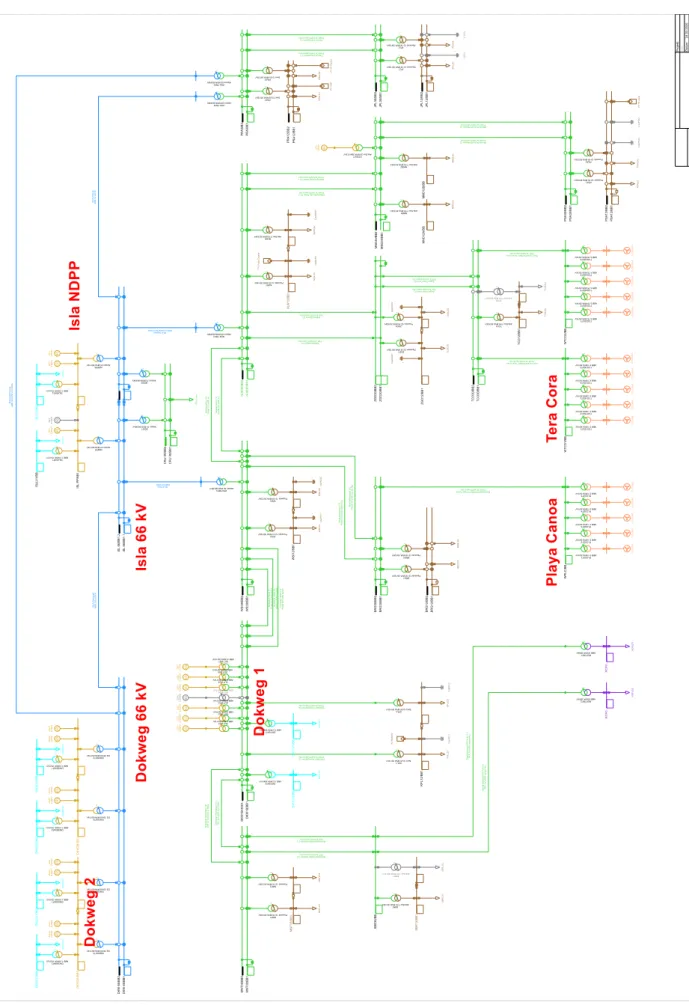
Several PFM monitoring systems are installed in the main substations of Aqualectra. Figure 2-1 provides an overview of their location in the power system.
The preliminary analysis of the PFM monitoring systems reveals the following issues:
Some of the PFM systems are not accessible and/or did not record the events of interest
due to malfunctioning caused by lack of periodic maintenance. Table 2-1 shows an overview of the current status of each of them.
Table 2-1: DIgSILENT Monitoring systems – Aqualectra - Curaçao
# Substation Type Status (13.03.2020)
1 Isla NDPP PFM300
Available, but with wrong high current trigger settings
-> results in a huge amount of recordings, so due to storage limitations, the data from the blackouts are already overwritten.
2 Isla 66 kV PFM300 Available, but with limited records form the blackouts since power supply was interrupted during that time
3 Dokweg 1 PFM300 Not accessible
4 Dokweg 2 PFM300 Not accessible
5 Dokweg 66 kV PFM300 Available, with all records from the blackouts
6 Mundo Nobo PFM2 Out of service
7 Tera Cora PFM2 Not accessible
8 Playa Canoa PFM2 Not accessible
The configuration of the PFM systems has not been updated considering the latest changes in the
network topology. Therefore, the signals available in each of the PFM systems reflect the
configuration at the time of commissioning, but not necessarily the actual status. As
an example, the PFM located in substation Isla 66 kV has recordings corresponding to two feeders with transformers (Dokweg II-T1 and Dokweg II-T2), whereas current network topology shows that in the same substation there are four transformers in total. Subsequent discussions with Aqualectra [3] have determined that the other two transformers correspond to signals
NDPP, Weis, Niljweg and Isla 2, whereas in current network topology there are just two lines from Isla 66 kV: to substations Isla and Parera. Again, subsequent discussions with Aqualectra [3] have determined that some of these signals are “spare”, hence not connected.
2.2.1
PFM Dokweg 66 kV
Table 2-2 shows the measurement signals available in the PFM located at substation Isla 66 kV [3], as well as its corresponding location in the PF simulation model (Figure 2-1).
Table 2-2: Measurement signals in the PFM Dokweg 66 kV
Signal Enabled Feeder connection PF Model
BUS-A X DKW66/BB1
BUS-B X DKW66/BB2
Spare VT - -
Bus coupler X - DKW66/CB0
BOO X No cable connected yet (spare) -
NDPP X No cable connected yet (spare) -
Wartsila X Feeder F03 66/11 kV Transformer DW2SUT4
(Dokweg 2B - Units 15 and 16)
Isla 1 X Feeder F04 ISLA-Dokweg2
Dokweg II-T1 X Feeder F05 66/11 kV Transformer DW2SUT1
(Dokweg 2A - Units 09 and 10)
Parera X Feeder F07 Dokweg2-Parera
Weis X No cable connected yet (spare) -
Nijlweg X No cable connected yet (spare) -
Spare CT 1 Feeder F10 66/11 kV Transformer DW2SUT3
(Dokweg 2B - Units 13 and 14)
Isla 2 X No cable connected yet (spare) -
Dokweg II-T2 X Feeder F12 66/11 kV Transformer DW2SUT2
(Dokweg 2A - Units 11 and 12)
Spare CT 2 - -
Spare CT 3 - -
Spare CT 4 - -
2.2.2
PFM Isla 66 kV
Table 2-3 shows the measurement signals available in the PFM located at substation Isla 66 kV [3], as well as its corresponding location in the PF simulation model (Figure 2-1).
Table 2-3: Measurement signals in the PFM Isla 66 kV
Signal Enabled Feeder
connection PF Model
Dwarskoppelveld sec. X 1 ISL 66/CB.L0
spare 2 -
Weis X 3 ISLA-Weis
BOO X 4 66/30 kV Transformer BOO1
Parera X 5 ISLA-Parera
NDPP X 6 66/11 kV Transformer NDPP1
(Units DE1 and DE2)
Langskoppelveld sec. X 7 -
Langskoppelveld sec. X 8 -
Nijlweg X 9 ISLA-Nijlweg
BOO X 10 66/30 kV Transformer BOO2
Parera X 11 ISLA-Dokweg2
NDPP X 12 66/11 kV Transformer NDPP2
(Units DE3 and DE4)
3
Events on 10
th
of February 2020
Recording: Monitor_2020.02.10 23.59.59.cfg Location: Dokweg 66 kV
As shown in Figure 3-1, voltage and frequency drop significantly (voltage drops down to ~0,9 p.u.) twice in a time frame of four hours.
3.1
1
st
Event
3.1.1
PFM Recording
Recording: Monitor_2020.02.10 23.59.59.cfg Location: Dokweg 66 kV
Date: 10.02.2020 Time: 06:50:53 Plots:
Figure 3-2: Voltage (top) and network frequency (bottom)
Figure 3-3: Voltage (top) and reactive power in WARTSILA1 and DOKWEG II-T12 (bottom)
Figure 3-4: Network frequency (top) and active power in WARTSILA and DOKWEG II-T1
(bottom)
Remarks:
Signal DOKWEG II-T2 shows a measured current of approximately zero, hence it is assumed that
units 11 and 12 in Dokweg 2B are disconnected at the time of the event
Signal Spare CT 1 shows no measurements, hence it is assumed that units 13 and 14 in Dokweg
2B are disconnected at the time of the event
The bus coupler is closed at the time of the event
Lines to substations Isla 66 kV and Parera are in operation at the time of the event
1 WARTSILA corresponds to 66/11 kV Transformer DW2SUT4 in Figure 2-1, where units Dokweg 2B -
Unit 15 and Dokweg 2B – Unit 16 are connected
2 DOKWEG II-T1 corresponds to 66/11 kV Transformer DW2SUT1 in Figure 2-1, where units Dokweg 2A -
3.1.2
SCADA
Recording: Generation 202002.xlsx Plots:
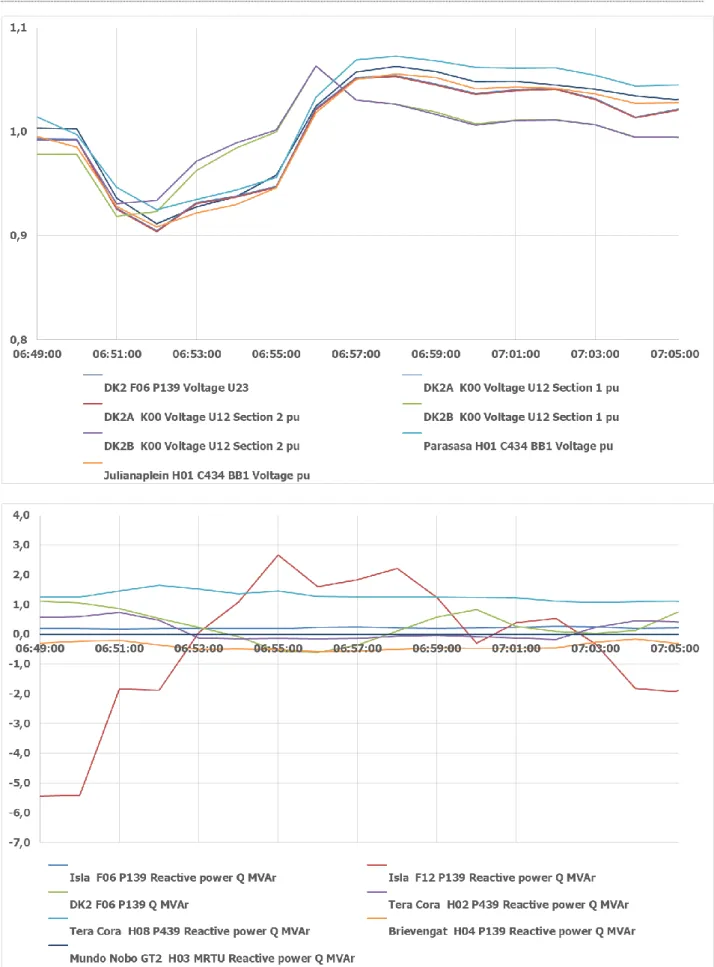
Figure 3-5: Voltage (top) and reactive power in different network locations (bottom)
3.2
2
Event
3.2.1
PFM Recording
Recording: Monitor_2020.02.10 23.59.59.cfg Location: Dokweg 66 kV
Date: 10.02.2020 Time: 09:16:56 Plots:
Figure 3-7: Voltage (top) and network frequency (bottom)
Figure 3-8: Voltage (top) and reactive power in WARTSILA and DOKWEG II-T1 (bottom)
Figure 3-9: Network frequency (top) and active power in WARTSILA and DOKWEG II-T1
(bottom)
Remarks:
Signal DOKWEG II-T2 shows a measured current of approximately zero, hence it is assumed that
units 11 and 12 in Dokweg 2B are disconnected at the time of the event
Signal Spare CT 1 shows no measurements, hence it is assumed that units 13 and 14 in Dokweg
2B are disconnected at the time of the event
The bus coupler is closed at the time of the event
3.2.2
SCADA
Recording: Generation 202002.xlsx Remarks
The SCADA recordings do not show the voltage drop at the 33 kV voltage level. Since the
correspondence with the PFM measurement cannot be confirmed completely, no SCADA measurements are considered in the analysis, hence not included in the report.
3.3
Observations and Preliminary Conclusions
1. Based on the information available, the most probable sequence of events is the following:
a. Generating units DE3 and/or DE4 in NDPP power plant gradually change the operation
from over- to under-excited in a time frame of approximately five minutes. As a result, voltage drops in all network locations by approximately 10%.
i. The change in the reactive power generation in units DE3 and/or DE4 does not
seem justified due to any voltage deviations.
ii. There is not sufficient information to determine which generating unit (DE3 or
DE4, or both) is responsible for the observed behavior. According to Aqualectra [4], this behaviour has been observed in the past in unit DE3. According to the same source, this behaviour was not triggered by an action of the plant or network operator.
iii. After the initial voltage drop, voltage control in other generating units (e.g. in
Dokweg 2A and 2B) is able to stabilise voltage and initiate recovery.
iv. Approximately eight minutes after the initial voltage drop, generating units in
NDPP power plant (DE3 and/or DE4) gradually return to their initial reactive power (over-excited).
b. Approximately 2 minutes after the initial event in NDPP power plant (a), wind farms
“Playa Canoa” and “Tera Cora 1” reduce their output power down to zero in a time frame of less than one minute. As a result, frequency decreases down to approximately 49,1 Hz.
i. SCADA measurements suggest that there is no sudden disconnection of the wind
farms, but a sustained output power reduction. It is possible that not all wind turbines in the park disconnect at the same time, which would also lead to a more or less gradual decrease in the output power of the wind park. However, there is not sufficient information to confirm this hypothesis completely.
ii. The disconnection of both wind farms is triggered by the voltage decrease in the
network. According to [5], the undervoltage protection in the wind farms is set at 0,9 p.u. and 2,5 seconds (measured at the 33 kV busbar at the POC). The SCADA measurement shows that the minimum voltage during the event is slightly above 0,9 p.u. but since the value represents a one-minute average, it is highly possible that the voltage drops transiently below 0,9 p.u., thus activating the under-voltage protection of the wind turbines.
power with no reduction. Therefore, it can be assumed that the under-voltage protection settings are different than in wind farms “Playa Canoa” and “Tera Cora 1”.
iv. After the disconnection of the wind farms, frequency control in other generating
units (e.g. in Dokweg 2A and 2B) is able to contain frequency decay and to recover it up to nominal values in less than 60 seconds since the initial drop.
v. Approximately 10 minutes after the disconnection of the wind farms, when
voltage has already recovered close to nominal values, wind farms “Playa Canoa” and “Tera Cora 1” start increasing their output power back to the “pre-event” value, which causes a slight over-frequency in the network (50,25 Hz).
2. During the event, generating units in WARTSILA and Dokweg II-T1 provide voltage control by
increasing reactive power contribution when voltage drops. However, it appears as if voltage control occurs only after a certain deadband is exceeded.
a. Voltage controllers from WARTSILA and Dokweg II-T1 show important differences.
WARTSILA seems to control output following an external setpoint that changes periodically, which might suggest some type of power plant controller. On the other hand, Dokweg II-T1 shows a more continuous type of control which suggests a decentralised voltage controller. In general, Dokweg II-T1 adapts faster to changes in the voltage.
2. Generating units in WARTSILA and Dokweg II-T1 also provide frequency control by changing
their output power to limit frequency excursion and to stabilise it afterwards.
a. Similarly as for voltage controllers, frequency controllers from WARTSILA and Dokweg
II-T1 show important differences. WARTSILA seems to control output following an external setpoint that changes periodically, which might suggest some type of power plant controller. On the other hand, Dokweg II-T1 shows a more continuous type of control which suggests a decentralised frequency controller. In general, Dokweg II-T1 adapts faster to changes in the frequency.
4
Events on 11
th
of February 2020
Recording: Monitor_2020.02.11 23.59.59.cfg Location: Dokweg 66 kV
As shown in Figure 4-1, a drop in voltage occurs at approximately 08:24 hours. After 08:36 hours, system starts to show instabilities in both voltage and frequency, and eventually system collapses (09:13 hours)
4.1
1
Event
4.1.1
PFM Recording
Recording: Monitor_2020.02.11 23.59.59.cfg Location: Dokweg 66 kV
Date: 11.02.2020 Time: 08:24:33 Plots:
Figure 4-2: Voltage (top) and network frequency (bottom)
Figure 4-3: Voltage (top) and reactive power in WARTSILA and DOKWEG II-T1 (bottom)
Figure 4-4: Network frequency (top) and active power in WARTSILA and DOKWEG II-T1
(bottom)
Remarks:
Signal DOKWEG II-T2 shows a measured current of approximately zero, hence it is assumed that
units 11 and 12 in Dokweg 2B are disconnected at the time of the event
Signal Spare CT 1 shows no measurements, hence it is assumed that units 13 and 14 in Dokweg
2B are disconnected at the time of the event
The bus coupler is closed at the time of the event
4.1.2
SCADA
Recording: Generation 202002.xlsx Plots:
Figure 4-5: Voltage (top) and reactive power in different network locations (bottom)
4.2
2
nd
Event
4.2.1
PFM Recording
Recording: Monitor_2020.02.11 23.59.59.cfg Location: Dokweg 66 kV
Date: 11.02.2020 Time: 09:16:56 Plots:
Time frame 08:00 – 09:20 hours
Figure 4-7: Voltage (top) and network frequency (bottom)
Figure 4-8: Voltage (top) and reactive power in WARTSILA and DOKWEG II-T1 (bottom)
Figure 4-9: Network frequency (top) and active power in WARTSILA and DOKWEG II-T1
(bottom)
Time frame 09:10 – 09:15 hours
Figure 4-10: Voltage (top) and network frequency (bottom)
Figure 4-11: Voltage (top) and reactive power in WARTSILA and DOKWEG II-T1 (bottom)
Figure 4-12: Network frequency (top) and active power in WARTSILA and DOKWEG II-T1
(bottom)
Remarks:
Signal DOKWEG II-T2 shows a measured current of approximately zero, hence it is assumed that
units 11 and 12 in Dokweg 2B are disconnected at the time of the event
Signal Spare CT 1 shows no measurements, hence it is assumed that units 13 and 14 in Dokweg
2B are disconnected at the time of the event
The bus coupler is closed at the time of the event
Figure 4-11: 2nd event on the 11th of February 2020 – PFM Dokweg 66 kV – Voltage (up) and reactive power
Figure 4-12: 2nd event on the 11th of February 2020 – PFM Dokweg 66 kV –Frequency (up) and active power
4.2.2
SCADA
Recording: Generation 202002.xlsx Plots:
Figure 4-13: Voltage (top) and reactive power in different network locations (bottom)
4.3
Observations and Preliminary Conclusions
1. The analysis of the first event on the 10th of February (see chapter 3.1), including the root cause
investigations, is also applicable for the first event on the 11th of February. The only difference is that
on the 11th of February, the change the operation from over- to under-excited occurs in units DE1
and/or DE2, while on the 10th of February it corresponds to units DE3 and/or DE4. In both cases, the
generating units are located in power plant NDPP.
2. Some minutes after the 1st event occurs, and once system has stabilised, frequency and voltage
begin to show an unstable behaviour which eventually leads to a blackout.
a. There is a correlation between the beginning of the instabilities and the disconnection of the
generators in Dokweg II-T1. It seems like these generators provide primary frequency regulation in the system which cannot be substituted (at least not by the generating units online at that moment).
b. After the disconnection of the generators in Dokweg II-T1, voltage starts deviating and
reaches values below 0,9 p.u. and above 1,1 p.u. Frequency deviates as well, reaching minimum and maximum values (before the blackout) of 48 Hz and 52,5 Hz, respectively.
i. Prior to the blackout, wind farms “Playa Canoa” and “Tera Cora 1” disconnect once
again due to undervoltage, reconnecting again (only wind farm “Tera Cora 1”) some minutes afterwards. This contributes to increasing the variations in voltage and frequency.
ii. Wind farm “Tera Cora 2”, which remained connected during the first event (voltage
drop), disconnects during one of the frequency or voltage excursions. Measurements show how frequency reaches values above 52 Hz and voltages above 1,1 p.u. According to [6], overfrequency protection of the wind turbines is adjusted at 52,5 Hz for 1 second, while overvoltage protection is adjusted at 1,1 p.u. and three seconds.
c. The blackout seems to be initiated by overvoltage conditions (above 1,1 p.u.), sustained for
more than one minute, which eventually causes the disconnection of generation that leads to a frequency decrease.
d. Frequency drop is not contained (at least not effectively) by the primary frequency regulation
of the generating units or by the action of the under-frequency load-shedding scheme (UFLS). When frequency reaches 48 Hz, more generation disconnects and the RoCoF increases even more, eventually causing the blackout.
3. The behaviour of generating units in WARTSILA and Dokweg II-T1 is not always the optimum to
production, when it is exactly the opposite what would have been expected (see Figure 4-11 at 09:10 hours)
b. Frequency regulation of generators in WARTSILA show a delay in the response which causes
that, in case of fast frequency variations, the actual response is counter-productive: increase of output power when frequency increases and vice versa (see Figure 4-12).
c. Generators in Dokweg II-T1 increase their output power even when frequency is above
5
Conclusions and Recommendations
The analysis of the network events on the 10th and 11th of February in 2020 leads to the main
conclusions and recommendations summarised in the following table: Table 5-1: Summary of conclusions and recommendations
# Conclusions Recommendations
1
Generating units in power plant NDPP occasionally and unexpectedly changed their operation from over-excited to under-excited, causing transient voltage drops down to approximately 0,9 p.u. in all network locations
Detailed investigation in power plant NDPP to determine the root cause for the observed behaviour.
Definition of mitigation measures to assure a stable operation.
2
Wind farms “Playa Canoa” and “Tera Cora 1”
disconnected during the events, most probably due to the undervoltage protection settings, which are currently adjusted at 0,9 p.u. and 3 seconds. However, wind farm “Tera Cora 2” did not disconnect during the same events.
Assessment to determine if the protection settings in wind farms “Playa Canoa” and “Tera Cora 1” can be modified to resemble those in wind farm “Tera Cora 2”, with the objective of a more robust and uninterrupted operation in case of grid faults.
3 Reconnection of wind farms “Playa Canoa” and “Tera Cora 1” and the subsequent output power ramp-up leads to transient overfrequency in the network.
Reduction of the ramp-up gradient in wind farms “Playa Canoa” and “Tera Cora 1” to minimize the impact on network frequency
4
Generators in Dokweg 2A disconnected unexpectedly on the 11th of February, right after one of the voltage drop
events occurred. However, for the same event the day before, those generators remained connected.
Further investigation to determine the root cause of the disconnection.
5
Generators in Dokweg 2A seem to be critical for system stability: their disconnection on the 11th of February led
to significant voltage and frequency variations which eventually caused the blackout.
Further investigation to review the overall system concept for frequency and voltage regulation.
6
Generators in Dokweg 2A and Dokweg 2B show differences in their dynamic behavior for frequency and voltage control.
Units in Dokweg 2B seem to have a superseded controller (e.g. power plant controller) which leads to a delayed response in case of fast frequency and/or voltage variations due to e.g. grid faults.
Detailed investigation to determine frequency and voltage control characteristics in all power plants. Assessment of unit performance with respect to overall system control strategy, i.e. if performance criteria are fulfilled.
7 PFM configuration is not completely consistent with current network topology (e.g. signal IDs, spare signals)
Update of PFM monitoring systems, so that the configuration is consistent with current network topology.
Definition of procedure to update them in case of modifications in network topology.
8 PFM not accessible and/or did not capable of recording all events of interest
PFM shall be accessible remotely and configured to assure that all relevant events in the system are recorded, which will support the analysis of future events.
6
References
[1] Aqualectra, “Generation 202002.xlsx”.
[2] Aqualectra, “Load 202002.xlsx”.
[3] Aqualectra, “Email from [email protected] with subject: RE: Teleconference with Aqualectra, 2020.04.15,” 07.05.2020 15:47.
[4] Aqualectra, “Email from [email protected] - Subject: RE: Teleconference with Aqualectra, 2020.04.15,” 13.05.2020 21:28.
[5] Aqualectra, “wind voltage range.jpg”. [6] Aqualectra, “Wind frequency range.jpg”.

![Table 2-2 shows the measurement signals available in the PFM located at substation Isla 66 kV [3], as well as its corresponding location in the PF simulation model (Figure 2-1)](https://thumb-us.123doks.com/thumbv2/123dok_us/8525881.2291151/10.892.104.729.246.836/measurement-signals-available-located-substation-corresponding-location-simulation.webp)
![Table 2-3 shows the measurement signals available in the PFM located at substation Isla 66 kV [3], as well as its corresponding location in the PF simulation model (Figure 2-1)](https://thumb-us.123doks.com/thumbv2/123dok_us/8525881.2291151/11.892.106.637.252.664/measurement-signals-available-located-substation-corresponding-location-simulation.webp)