Database Server with Write-Heavy Workload
Manfred Dellkrantz1, Maria Kihl2, and Anders Robertsson1
1 Department of Automatic Control, Lund University
2 Department of Electrical and Information Technology, Lund University
Box 118, 221 00 Lund, Sweden
{manfred,maria.kihl}@eit.lth.se, [email protected]
http://www.eit.lth.se/
Abstract. Resource-optimization of the infrastructure for service
ori-ented applications require accurate performance models. In this paper we investigate the performance dynamics of a MySQL/InnoDB database server with write-heavy workload. The main objective of our investiga-tion was to understand the system dynamics due to the buffering of disk operations that occurs in database servers with write-heavy workload. In the paper, we characterize the traffic and its periodic anomalies caused by flushing of the buffer. Further, we present a performance model for the response time of the requests and show how this model can be configured to fit with actual database measurements.
Keywords: performance modeling, service-oriented analysis, database
server, admission control.
1
Introduction
The processing and control of service-oriented applications, as web applications, mobile service management systems, media distribution applications, etc., are usually deployed on an infrastructure of server clusters. The rate at which the requests arrive can vary heavily both during a single day and during longer periods, due to user behavior patterns. Scaling for the worst traffic peaks can be expensive though and will result in most of the capacity being unused most of the time. Capacity planning and resource optimization is therefore needed, which require the design of accurate performance models that capture the system dynamics in high loads.
Previous work on control systems for service-oriented applications and sys-tems has mainly focused on applications with CPU-intensive workload, for ex-ample web server systems and databases with read-only requests. For CPU-intensive workloads previous work has shown that the performance dynamics are accurately captured by a single server queue model, see for example, [1] and [4]. However, for applications including large databases (too large to store in main memory), hard drive dynamics will influence the performance dynamics
F. De Paoli, E. Pimentel, and G. Zavattaro (Eds.): ESOCC 2012, LNCS 7592, pp. 184–191, 2012. c
in high loads. Typically the application will need to read data from disk on every database read. Write operations are however often buffered in the server to make them more efficient. For example, in [7] the authors examine different buffering/caching techniques for use with NFS (Network File System).
Writing to persistent media is often a slow process which should be avoided if possible. Further, writing performance is also affected by certain rules of locality. For example, writing sequential data to a hard drive can be many times faster than writing to random sectors. By buffering writes and completing them in sequential order, the writes are executed more efficiently. However, when the buffered writes are actually flushed to disk, the response times of the normal flow of traffic are heavily influenced. The server becomes occupied by work other than that of the normal flow of requests. Therefore, the system dynamics of server systems with write-heavy workload cannot be captured with the single server queueing models proposed for CPU-intensive workload.
In this paper we examine write-heavy workload on a MySQL database server using the engine InnoDB. The database is stored on a magnetic hard drive which results in the database server having to employ heavy buffering to speed up the writes. In the paper, the characteristics of write-heavy workload is examined. We develop a model and configure the model parameters using experiments in our testbed. We show in experiments that the model accurately captures the periodic anomalies that occur when the system needs to empty the buffer.
In Section 2 we present the lab environment used for the database measure-ments. In Section 3 we characterize the database traffic. In Section 4 we present the model developed for the traffic and discuss how to configure it. We also validate the model with lab measurements.
2
System Description
In this paper, we investigate the dynamics of database servers with write-heavy workload. The models and methods proposed in the paper are based on the results from experiments in our testbed. In this section, we first give an intro-duction to dirty page caching, which is used in many operative systems and database systems to improve the latencies when writing to disk. Further, we describe our testbed.
2.1 Page Cache
One common way to implement write-buffering is using a page cache. The storage is divided into fixed size pages. When data is written, the page being written to is first read from storage and then changed in memory and marked as dirty. Dirty pages are then kept in memory for some time before it is written back to disk and marked clean.
MySQL has several different storage engines, among them MyISAM and Inn-oDB. MyISAM has no built in cache for data. Instead it relies on the page caching features of the operating system. In this paper, we have used the stor-age engine InnoDB, which has its own system of pstor-ages which are buffered in the
so calledbuffer pool. Pages are written to and read from disk directly using one of several methods for directly accessing the block storage device, bypassing the operating system page cache. The InnoDB engine tries to estimate the speed of the block device and the rate at which new pages are made dirty and from that it calculates how often and how many dirty pages need to be written to disk.
2.2 Testbed
We have used an experimental testbed. The testbed consists of one computer act-ing as traffic generator, and one database server. The computers were connected with a standard Ethernet switch.
The traffic generator was executed on an AMD Phenom II X6 1055T at 2.8 GHz with 4 GB main memory. The operating system was 64-bit Ubuntu 10.04.4 LTS. The traffic generator was implemented in Java, using the JDBC MySQL connector. The traffic generator used 200 working threads and generated MySQL queries according to a Poisson process with average rateλ queries per second. The behavior of the traffic generator was validated in order to guarantee that it was not a bottleneck in the experiments.
The database server had a 2.0 GHz Celeron processor and 256 MB main memory. The database files are on the system disk which is a standard 3.5"hard drive. It runs the 32-bit version of Ubuntu 10.04.4 LTS (Linux 2.6) and MySQL Server 5.1.41. The InnoDB engine was configured with 16 MB of buffer pool.
The structure of the relations in the database comes from the scalable Wis-consin Benchmark [6] and it has n = 107 tuples. The structure of the queries
used all follow the following pattern:
UPDATE <relation> SET unique3=? WHERE unique1=?;
The question marks are replaced with uniformly distributed pseudo-random in-tegers in the interval [0, n[. This query changes the value of one of the integer attributes of a random tuple.
3
Performance Characterization
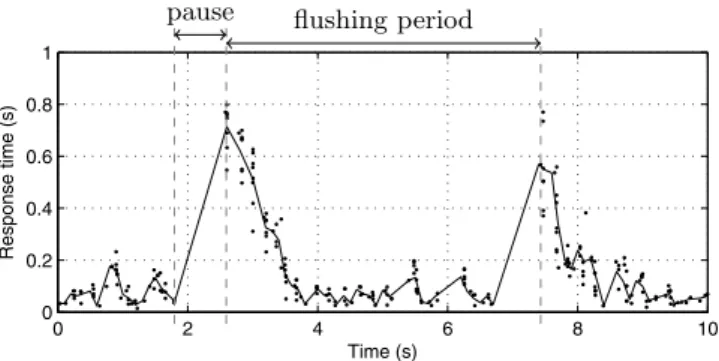
In order to investigate the dynamics of a database server with write-heavy work-load, we performed a series of experiments in our testbed presented in Section 2. In all the experiments, all requests included a MySQL UPDATE query, caus-ing the system to write one database element to disk. Figure 1 illustrates the system behavior during an experiment where the average arrival rate, λ, was 25 requests per second. The figure shows that the system periodically have to pause the normal work and instead focus on the buffered dirty pages for some time. While the normal response times are below 0.2 seconds, response times of up to one second occur, because of these pauses. The number of requests that have these high response times are affected by the fact that requests are sent and queued up, even when the server is busy with the dirty pages.
0 2 4 6 8 10 0
0.2 0.4 0.6 0.8 1
Time (s)
Response time (s)
pause flushing period
Fig. 1.Response time graph of the InnoDB system, UPDATEs only, with constant
Poisson-traffic, 25/s
0 20 40 60 80 100
24 25 26 27 28 29 30 31 32 33
Concurrent jobs
Throughput (/s)
0 20 40 60 80 100
0 1 2 3 4 5
Concurrent jobs
Average Response Time (s)
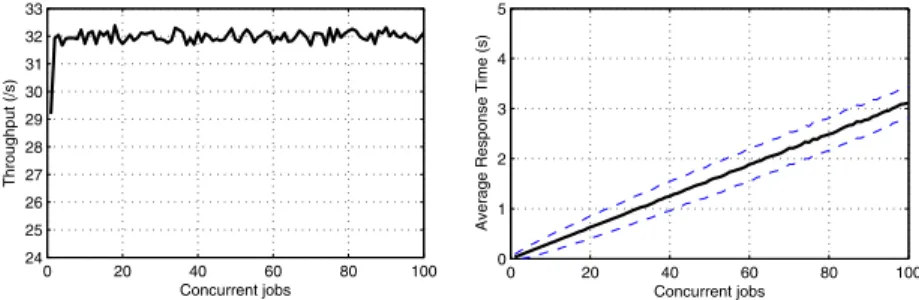
Fig. 2.N/P graph (left) and N/T graph (right) of the InnoDB system, UPDATEs
only. Every point was run for 900 seconds.
The average response time as a function of the number of concurrent jobs is from now on referred to as theN/T graph. The throughput as a function of the number of concurrent jobs inside the server at all times is from now on referred to as theN/P graph. The N/T andN/P graphs for our system are shown in Figure 2.
It can be seen in theN/P graph that for a very small number of concurrent requests (up to 10), the throughput is much lower than for a higher number of concurrent requests. This is likely (to some extent, at least) because of network delays and buffering in lower protocol layers.
During high loads, the dirty page cache will be written to disk periodically. The period between two occurrences of disk writing, called the flushing period, depends on the arrival rate. As can be seen in Figure 1, an arrival rate of 25 requests per second results in a flushing period of approximately 5 seconds. Fig-ure 3 shows the response times during an experiment with an average arrival rate of 12.5 requests per second, which results in a flushing period of approximately 10 seconds and an experiment with an average arrival rate of 18.75 requests per
0 5 10 15 20 0
0.2 0.4 0.6 0.8 1
Time (s)
Response time (s)
0 2 4 6 8 10 12
0 0.2 0.4 0.6 0.8 1
Time (s)
Fig. 3.Response time graph of the InnoDB system, UPDATEs only, with constant
Poisson-traffic, 12.5/s (left), 18.75/s(right)
second, which results in a flushing period of approximately 7 seconds. These experiments show that the period between flushes of the buffer is inversely pro-portional to the arrival rate, since
25·5≈12.5·10≈18.75·7 (1)
4
Performance Model
In this section, we describe our proposed performance model, which captures the dynamics of our system.
4.1 Model Description
We propose a queuing network model shown in Figure 4. The model consists of three parts, aNetwork delay (ND), a Job queue (JQ), and aDirty page buffer (DPB). The ND is used to model the reduced throughput at very low numbers of concurrent requests. After passing the ND, requests enter the JQ. As requests are processed by the server, the user is acknowledged and one dirty page equivalent is placed in the DPB. The DPB has a fixed maximum size and when that is reached the server stops processing requests in the JQ and starts to process dirty pages from the DPB instead until the DPB is empty. When the DPB is empty, the server switches back and continues to work on the JQ.
As a request enters the server it is assigned a processing time. Our experiments have shown that the processing time for a request in the JQ and the processing
JQ
DPB ND
time for one dirty page equivalent (Tproc andTdp, respectively) can be modeled by an exponential distribution. Further, the time each request spends in the ND (Tnd) can be modeled as a sum of a constant and an exponentially distributed random number.
Further, the maximum size of the DPB is denoted DP Bmax and it is a con-stant integer number. The maximum length of the DPB and one dirty page equivalent per request determine the inverse proportionality between flush pe-riod time and arrival rate shown in Equation (1).
4.2 Parameter Configuration
The model has the following parameters which must be configured: Tnd distribution,E [Tproc],E [Tdp], DP Bmax
The maximum capacity of the DPB can be determined by measuring the period of flushes,p, for some high traffic with throughputP. Since pdetermines how often the DPB needs to be flushed andP determines how fast new dirty pages are put into the DPB, the max length of the DPB isDP Bmax=P·p.
By examining some experiment with high number of concurrent requests, a lower limit on the duration of the pause in processing (min(Tpause)) can be determined. By measuring the time between request departures and filtering out those that are > min(Tpause), an average on the pause duration (Tpause) can be estimated. From these results, the mean of the dirty page processing time is given by E [Tdp] =Tpause·DP Bmax−1.
With the knowledge ofTdpand the throughput (P) when keeping high number of concurrent requests, the average processing timeTproc can be determined. By assuming that the server is always busy, the throughput can be assumed to be inversely proportional to the total processing time spent on every request. Since the server spends a total ofTproc+Tdp time on every request, the average for the processing time is given by E [Tproc] =P−1−E [T
dp].
The distributions used for the network delay (Tnd) are determined by perform-ing an experiment keepperform-ing one concurrent request in the system. The response timesT are measured. Since the total response time of one single request is the sum of the network delay, the processing time plus that it has a probability of DP Bmax−1 to get DP Bmax·Tdp added, the average network delay is given by
E [Tnd] = E [T]−E [Tproc]−E [Tdp].
4.3 Model Validation
In order to validate the proposed model, we developed a discrete-event simula-tion program, written in Java. By using the configurasimula-tion method described in Section 4.2, we can conclude that the values in Table 1 make a good fit for our database server described in Section 2.
In Figure 5, the cumulative distribution function of the response times from an experiment with arrivals following the Poisson process with an average rate of
Table 1.Fitted model parameters Tproc Exp(0.0269)
Tnd0.0025 + Exp(0.00049)
DP Bmax 111
Tdp Exp(0.00433)
0 0.2 0.4 0.6 0.8 1 1.2 1.4 1.6 1.8 2 0
0.2 0.4 0.6 0.8 1
Response time (s)
Probability
Real database Simulation
Fig. 5.Cumulative distribution function of response times from InnoDB database
sys-tem, and the proposed model. Traffic is generated with a Poisson process with average 28 requests per second.
0 20 40 60 80 100
24 25 26 27 28 29 30 31 32 33
Concurrent jobs
Throughput (/s)
0 20 40 60 80 100
0 1 2 3 4 5
Concurrent jobs
Average Response Time (s)
Fig. 6.N/T (top) andN/P (bottom) graph from the simulation of the model. Every
number of parallel jobs was run for 900 seconds.
28 requests per second, are shown. One graph shows the results from a testbed experiment and one graph shows the results from the discrete-event simulation of the model. As can be seen in the graphs, the distribution of response times in the model fits accurately with the database experiment.
Further, the N/T and N/P graphs for the simulation is shown in Figure 6. These graphs can be compared with the graphs of the corresponding experiments, shown in Figure 2. The graphs show that the proposed model fits well with the real system.
5
Conclusions
Many service-oriented applications use database servers for storing data. When the applications have a workload that writes to a database stored on hard drives,
disk writing optimizations introduce performance dynamics that may be difficult to monitor and control. Traditional queuing system models do not suffice when the response times show these periodic anomalies. In this paper, we have devel-oped a performance model based on queueing systems for database servers with write-heavy workload. We validate our model using experiments in a testbed.
Acknowledgment. This work has been partly funded by the Lund Center for Control of Complex Engineering Systems (LCCC) and the Swedish Research Council grant VR 2010-5864.
References
1. Cao, J., Andersson, M., Nyberg, C., Kihl, M.: Web Server Performance Modeling using an M/G/1/K*PS Queue. In: Proceedings of the 10th IEEE International Con-ference on Telecommunications (2003)
2. Liu, X., Heo, J., Sha, L., Zhu, X.: Adaptive Control of Multi-Tiered Web Application Using Queueing Predictor. In: Proceedings of: 10th IEEE/IFIP Network Operations and Management Symposium, NOMS 2006 (2006)
3. Kihl, M., Robertsson, A., Andersson, M., Wittenmark, B.: Control-theoretic Anal-ysis of Admission Control Mechanisms for Web Server Systems. World Wide Web Journal 11, 93–116 (2008)
4. Kihl, M., Cedersj¨o, G., Robertsson, A., Aspern¨as, B.: Performance measurements and modeling of database servers. In: Sixth International Workshop on Feedback Control Implementation and Design in Computing Systems and Networks, June 14 (2011)
5. Kamra, A., Misra, V., Nahum, E.M.: Yaksha: A Self-Tuning Controller for Managing the Performance of 3-Tiered Web sites. In: Twelfth IEEE International Workshop on Quality of Service (June 2004)
6. DeWitt, D.J.: The Wisconsin Benchmark: Past, Present, and Future. In: Proceedings of: 9th International Conference on Very Large Data Bases, pp. 8–19. Citeseer (1991) 7. Rago, S., Bohra, A., Ungureanu, C.: Using Eager Strategies to Improve NFS I/O Performance. In: Sixth IEEE International Conference on Networking, Architecture, and Storage (2011)
8. Hsu, W.W., Smith, A.J., Young, H.C.: I/O Reference Behavior of Production Database Workloads and the TPC Benchmarks — An Analysis at the Logical Level. ACM Transactions on Database Systems 26(1), 96–143 (2001)
9. Kleinrock, L.: Queueing Systems: Theory, vol. I. Wiley Interscience, New York (1975)