Research Article
A Comparative Study on Flight Delay Networks of the USA
and China
Yanjun Wang ,
1,2Hongfeng Zheng,
1,3Fan Wu,
1,4Jun Chen,
5and Mark Hansen
1,6 1College of Civil Aviation, Nanjing University of Aeronautics and Astronautics, Nanjing 210016, China2Department of Aeronautics and Astronautics, Massachusetts Institute of Technology, Cambridge 02139, USA 3VariFlight Company, Hefei 230000, China
4Air Traffic Management Bureau of Northwest of China, Xi’an 710082, China
5School of Engineering & Materials Science, Queen Mary University of London, London E1 4NS, UK 6Department of Civil and Environmental Engineering, UC Berkeley, Berkeley, CA 94720, USA Correspondence should be addressed to Yanjun Wang; [email protected]
Received 16 August 2019; Revised 31 January 2020; Accepted 14 May 2020; Published 2 June 2020 Academic Editor: Paola Pellegrini
Copyright © 2020 Yanjun Wang et al. This is an open access article distributed under the Creative Commons Attribution License, which permits unrestricted use, distribution, and reproduction in any medium, provided the original work is properly cited. Recent studies have characterized the structures of air transport network in different countries and regions using complex network metrics. These studies coincided with the trend of increasingly available large empirical flight datasets that enable researchers to investigate the dynamics of the system, such as the propagation of flight delay. However, linking network structure with network dynamics remains a challenging task. In this paper, we proposed a method to construct flight delay networks from operational data. We provided a detailed comparison of the key structural properties of the flight delay networks in the United States and China. The comparisons of betweenness centrality of delay networks and flight networks show the advantage of the proposed method. We further found that airports in similar geographical locations do exhibit similar delay patterns in both countries. To explore the underlying mechanisms, the Multifractal Detrended Fluctuation Analysis (MF-DFA) is applied to the flights’ delay time series at both the airport level and network level. Singularity spectra analyses reveal the fundamental characteristics of the airport systems and air transportation system. Our findings contribute to the understanding of structure and dynamics of air transportation systems.
1. Introduction
Air traffic is an integral part of intermodal transportation in both developing and developed countries, playing a critical role in the global economy and our daily life. The last decade has witnessed the improvement of the air transportation systems in safety, capacity, and efficiency. Great efforts have been made to enhance the performance of the system, in-cluding the introduction of new operational concepts, the deployment of advanced automation systems, and long-term research and development activities [1, 2]. However, the growing demand in air transport continues to challenge the existing system. There is an urgent need to better understand the structure and dynamics of this complex social-techno-logical system in order to guide future development and management.
The understanding of the airport network structure has improved considerably over the past few years as is evident from numerous studies that revealed important character-istics of airport networks in different countries and regions around the world [3–6]. Traditionally, networks under study are constructed from flights data. Airports or cities are the nodes, while the edges are determined based on the con-nectivity of direct flights between two airports or cities. Statistical techniques are employed to uncover the properties of the network. A growing corpus of empirical analyses have revealed the fundamental properties of airport networks in a region or worldwide, such as small-world and scale-free, contributing to the understanding of the structure of hu-man-made complex systems. The dynamics occurring on top of airport networks have drawn much attention as well. Great efforts have been devoted to the study of flight delays
Volume 2020, Article ID 1369591, 11 pages https://doi.org/10.1155/2020/1369591
from the perspectives of network science and operations research [7–9]. These studies generally focus on how flight delays propagate within airline’s or airport’s networks. However, the structural information of the airport network has not yet been considered.
One unanswered question is: what can we gain if we analyze the air transportation complex system by combining information about both structure and dynamics? A series of recent studies on outlier detection have demonstrated the advantage of investigating airport networks taking into account both network structure and dynamics [10, 11]. The authors constructed the airport networks based on the correlations between airport delays. Then the abnormal days of operation can be identified by the analysis of the networks using the Graphical Signal Processing technique. In this paper, we propose a method to construct airport networks that incorporate flight delay information. We then compare the fundamental properties of airport networks and flight delays in USA and China, taking an initial step towards the comparison of the two systems. The rest of the paper is organized as follows. In Section 2, we summarize related work on airport networks and delay propagation. The method is described in Section 3, and the results are pre-sented in Section 4. Conclusion remarks are given in Section 5.
2. Literature Review
2.1. Structural Properties of the Airport Network. First reports of airport networks studies date back to 2000s [12], when the study of complex networks was conducted in an immature and active research area. These studies consider the air transportation system as a complex network with the components being abstracted into nodes and the mutual relations between the components being abstracted into edges. A most prevalent approach to construct an air transport network is based on the flights data [12, 13]. Traditionally, the nodes in the networks are the airports, while the edges are linked based on the existence of direct flights between airports. Common investigated structural properties of networks, for instance, the degree distributions and betweenness centrality, are examined [14, 15]. Most airport networks exhibit features of small-world networks, such as a short average path length, a large clustering co-efficient, and scale-free characteristics [16–18]. There are certain core airports with a large degree, while other airports tend to connect with these airports [19]. He et al. [20] studied the Chinese airport network in 2004 and concluded that the network is of small-world type without the scale-free property. This is due to the fact that the degree distribution of the nodes of the Chinese airport network is exponential rather than heavily tailed. Li and Cai showed that, in a weekly cycle, the Chinese airport network exhibits the scale-free properties, and the weekly cumulative degree distri-bution of nodes follows the power law [21]. Recently, there is also work that considers the multilayer nature of air transport networks by decomposing airport networks into different airline networks [22–24]. Table 1 lists the studies of worldwide airport networks.
Another line of research has focused on the evolution of air transport networks [26–29]. Using worldwide flight schedules data between 1979 and 2007, Azzam et al. analyzed the evolution of the worldwide air transportation network and found that the degree distribution is nonstationary, growing at an accelerated rate [30]. A recent comparative study on the evolution of worldwide airport networks can be found in [24].
2.2. Flight Delay Propagation. While the investigation on the structural properties of airport networks is extensive, few studies can be found to characterize the dynamical prop-erties of air transport networks [7]. Flight delay is intrin-sically dynamic and typically propagates in an air transportation network causing other delays over time. Many studies on delay propagation use empirical data to investigate the cause of initial and primary delays [31]. The primary delay can trigger a cascade of secondary delays, which may spread over the airline networks and airport networks. A comprehensive study reported in [32] analyzed reactionary delays, which are caused by upstream delays in the European airports using the data collected by the Central Office for Delay Analysis. The authors suggested that the airline network structure plays an important role in ab-sorbing delays. Recent advances in quantifying delay propagation in the US air transportation system have shed light on the intrinsic mechanisms of delay generation from network perspectives [9, 33]. In particular, Pyrgiotis et al. [9] developed an analytical queuing and network decomposi-tion model, namely, the Approximate Network Delays model, to study the delay propagation in the US air transport network.
The existing studies of flight delay are mostly focused on the impact of airline flight plans and ground transit time on the propagation of flight delays. The methods of analyzing flight delay propagation mainly employ Bayesian networks and simulation models. Wu and Law [34] proposed an airline network delay propagation model using a Bayesian Network and identified weak links in a flight network. The Bayesian network-based method is suitable for microanal-ysis. However, it is not suitable to analyze the overall delay propagation process of the aviation network as a whole. On the other hand, the simulation method also has its limita-tions due to the large number of interlinked subsystems. The emergent behavior of the whole system is difficult to capture. Commonly used network metrics characterize different aspect of the network structure. However, one should take caution when applying these structural measures to flight delay management. Relying solely on these topological measures may be insufficient to capture the underlying properties of the air transport system. As discussed in a recent report, none of the most common and well-known centrality metrics, degree centrality, Katz centrality, and Page Rank, are able to characterize the effect of delays in the US air transport system [35]. A new centrality metric, Trip Centrality, is proposed by the authors to capture the network effect of delays. In contrast to their work, we focus on the method to construct airport networks and on the
comparison of existing network metrics in the US and Chinese airport networks rather than the development of new network measures.
3. Methods
3.1. Data Description. Detailed and automatically recorded flights data were obtained from the Operations Management Center of Air Traffic Management Bureau, Civil Aviation Administration of China. The database details flights de-parture and landing events in every Chinese mainland airport, providing a comprehensive picture of air transport in China. Each flight record reports flight number, execution date, scheduled and actual departure/arrival airports, scheduled and actual departure/arrival times, and the unique aircraft registration number (tail number). Such data allow us to readily reconstruct the flight path of each aircraft in the network. This paper is based on the flight data recorded during the period from 1 August 2012 to 31 August 2013, including a total of 196 airports and 4,007,532 flights.
On the US side, domestic flight data were obtained from the Bureau of Transportation Statistics, United States De-partment of Transportation. Each flight record contains the same information as in its Chinese counterpart. In order to make a fair comparison, the same time period was used. An overview of the two datasets is presented in Table 2.
A common definition of flight delay is the time differ-ence between the real and scheduled operations (arrival or departure). In our database, the actual departure and arrival times of a flight are recorded from when the aircraft takes off from origin airport and lands on the destination airport, respectively. This study is only focused on flighti’s departure delayTidepdelayand arrival delayTiarrdelay, which are calculated as
Tidepdelay �Tiactual,dep−Tischeduled,dep, Ti
arrdelay �T
i
actual,arr−T
i
scheduled,arr.
⎧ ⎪ ⎨ ⎪
⎩ (1)
3.2. Construction of the Airport Delay Network.
Conventionally, an airport network can be constructed from the flight data and represented as a directed and weighted graph G(V, A), with each airport being represented as a node v∈V, and each flight forming a link a∈A that connects the origin and destination airports. The network is
directed and weighted because of the directions and the volume of flights or passengers in a given time period.
Here, we construct a weighted airport delay network in which airports are the nodes. A link between two airports is established if there is a direct flight between them. The weight of the edgeWij is defined as follows:
Wij� k∈Fij
Dki +Akj
,
(2)
where Fij is the set of flights departing from airport i to airportj.Dk
i is the departure delay of flightk, andA k j is the
associated arrival delay.
3.3. Correlations between Time Series Data. The Pearson correlation coefficient is used to capture the correlations between flight delays in different airports. To make the time series datasets comparable, we use 15 minutes as the sampling rate to calculate departure flight delays at each airport. LetXirepresent the departure delay time series at airport i. To compute the correlation ρij between i
th
airport and jth airport, one can use the following
equation:
ρij �
E X iXj−E XiXj ��������������
E X2i−E2 X
i
��������������
E X 2j−E2 X
j
, (3)
where ρ∈[−1,1].
3.4. Multifractal Detrended Fluctuation Analysis (MF-DFA).
Peng et al. first proposed a Detrended Fluctuation Analysis (DFA) method to analyze the statistical self-affinity of a time series [36]. Later, the Multifractal Detrended Fluctuation Analysis (MF-DFA) method was developed by Kantelhardt et al. to analyze nonstationary time series and has been widely applied in different fields. For a given time series
X�xk|k�1,2, ..., N, we summarize in the following the five steps of MF-DFA.
Table1: Structural properties of airport network worldwide.
Authors Airport networks Nodes/edges Average pathlength coefficientsClustering distributionDegree
Rocha et al. [18] Brazilian airport network 142/- 2.34 0.63 Power law
Michele and Maria [25] Italian airport network 42/310 0.1 Double power law
Bagler [16] Indian airport network 79/442 2.26 0.657 Power law
Li-Ping et al. [17] US airport network 215/- 2.4 0.618 Double power law
Barrat et al. [13] North American airport
network 935/- 4 Power law
Guimera et al. [4] Worldwide airport network 3883/27051 4.4 0.62 Double power law
Table2: General information on the US and China flight datasets. USA China
Number of airports 319 196
Average departure delays (minutes per
flight) 9.6 43.5
Step 1. The sequence of summarized displacements is defined as follows:
Y(i) � i
k�1
xk−x, i�1,2,. . ., N, (4)
where
x� 1
N
N
k�1
xk. (5)
Step 2. We divide Y(i) into Ns�int(N/s) nonover-lapping segments of lengths. Then, this step is repeated starting from the opposite end. Therefore, 2Ns seg-ments are obtained.
Step 3. For each segmentv(v�1,2, ...,2Ns), we apply the least-squares with ak−orderpolynomial to fit all thesdata points:
yv(i) �a1ik+a2ik−1+ · · · +aki+ak+1. (6)
Step 4. For each segmentv�1,2, ..., Ns, F2(s, v), the
varianceF2(s, v)is calculated as
F2(s, v) �1
s
s
i�1
Y[(v−1)s+i] −yv(i)2. (7)
For segments v�Ns+1, Ns+2, ...,2Ns, F2(s, v) is
calculated as
F2(s, v) �1
s
s
i�1
Y N − v−Nss+i−yv(i)2. (8)
Step 5. The fluctuation functionFq(s)for a given real numberq≠0 is determined as
Fq(s) � 1
2Ns
2Ns
v�1
F2(s, v)q/2
⎧ ⎨ ⎩
⎫ ⎬ ⎭
1/q
. (9)
Whenq�0,F0(s)is obtained as
F0(s) �exp 1 4Ns
2Ns
v�1
lnF2(s, v) ⎧
⎨ ⎩
⎫ ⎬
⎭:sh(0), (10)
whereFq(s)is a function of data lengthsand fractal orderq. We have Fq(s)∝sh(q). h(q)is generally referred to as the
generalized Hurst exponent. Whenq�2,F2(s)becomes the standard DFA. h(2) indicates whether time series X has long-memory processes or is 1/fnoise. Specifically,h(2)is interpreted as follows:
(i) h(2)<0.5: anticorrelated
(ii) h(2)≈0.5: uncorrelated, white noise (iii) h(2)>0.5: correlated
(iv) h(2)≈1: 1/fnoise, pink noise
(v) h(2)>1: nonstationary, random walk like, unbounded
(vi) h(2)≈1.5: Brownian noise
The global scaling exponentτ(q)is determined based on
h(q):
τ(q) �qh(q) −1. (11)
Based on Legendre transformation, one can have
α�τ′(q), f(α) �qα−τ(q). ⎧
⎨
⎩ (12)
Here, α is referred to as the singularity strength or H¨older exponent. f(α) is the spectrum of singularities which measures the dimensions of the subset of the time series. With equations (11) and (12), we have
α�h(q) +qh′(q) �h(q) +qdh(q)
dq , (13) f(α) �q[α−h(q)] +1. (14)
4. Results
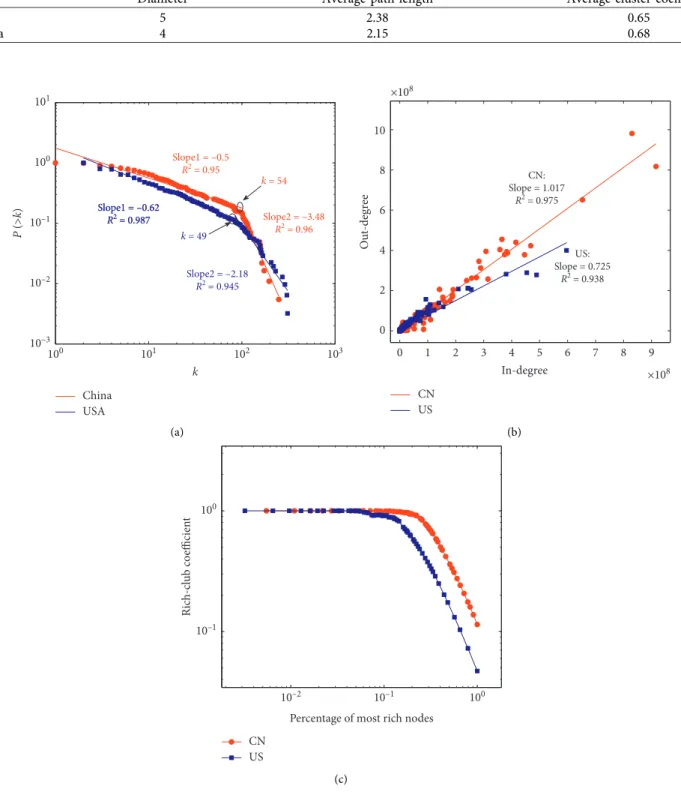
4.1. Comparison of Airport Network Structures. We first construct the Chinese and US airport networks from flight delay data based on the method proposed in Section 3. These networks are referred to as “Delay Networks.” Statistical results on the two flight delay networks are shown in Table 3. As can be seen, these two networks have significant small-world characteristics. We plot cumulative degree distribu-tions of the two networks in the double logarithmic graph (Figure 1(a)). It can be clearly seen that both cumulative degree distributions have two affine components with the transition point being k�54 (China) and k�49 (USA), respectively. In other words, the degree distributions follow the double power-law distributions or truncated power-law distributions. Therefore, the delay networks have scale-free characteristics and the majority of the nodes have low de-grees. A few airports have relatively large degrees, which suggest that they may play dominant roles in the air transport systems.
Figure 1(b) depicts the relationships between in-weight and out-weight of the nodes. The in-weight of a node represents the flight delay that occurred before arriving at this airport, while the out-weight of the node is the delay after departing from this airport. The data points for both networks suggest a linear relationship between in-weight and out-weight, withR-square values of 0.975 (China) and 0.938 (USA), respectively, using least-squares. The slopes of the best-fitting lines are 1.017 (China) and 0.725 (USA). Compared with the Chinese air transportation system, the in-weights of the US airports are significantly larger than the out-weights, which suggests that the large airports in USA have the capability of absorbing flights delays. Therefore, the outbound flight delay of these airports is less than the in-bound flight delay.
To study the relationship between neighboring nodes in the network, we consider the assortativity of the flight delays network. The assortativity of Chinese network is−0.422 and it is−0.497 for the US network. Both networks show dis-assortativity feature, meaning the nodes with large degree tend to connect to the nodes with small degrees. Because of the existence of the hub-spoke structure, the flights of
nonhub airports need to transit at the hub airports, causing flights delays to occur mainly at the hub airports.
We calculate the rich-club coefficient to uncover the cores of the network. Figure 1(c) plots the relationships between the rich-club coefficients and standardized pa-rameter r/n (the percentage of the richest nodes) of flight delay network of China and USA, where n is the scale of
101
100
10–1
P
(>
k
)
10–2
10–3
100 101
k
102 103
Slope1 = –0.62
R2 = 0.987
Slope1 = –0.62
R2 = 0.987
Slope1 = –0.5
R2 = 0.95
Slope2 = –2.18
R2 = 0.945
Slope2 = –3.48
R2 = 0.96
k = 49
k = 54
China USA
(a)
10 8 6 4 2 0
×108
Ou
t-degr
ee
0 1 2 3 4 5 6 7 8 9
In-degree CN
US
×108 US:
Slope = 0.725
R2 = 0.938
CN: Slope = 1.017
R2 = 0.975
(b)
100
10–1
10–2 10–1 100
Percentage of most rich nodes
Ric
h-c
lu
b co
efficien
t
CN US
(c)
Figure1: Comparisons on the properties of the US and China networks. (a) The degree distributions of the networks in log-log plot. (b) The relationship between in-degree and out-degree. (c) The rich-club coefficients.
Table3: Basic network properties of the US and China networks.
Diameter Average path length Average cluster coefficient
USA 5 2.38 0.65
network andris the number of the richest nodes. As we can see, the log value of rich-club coefficient is linearly increasing with respect to the decrease of the log value of standardized parameterr/n, indicating a power-law relationship. The top 15 richest nodes of China’s network constitute a fully connected graph, while the top 16 richest nodes in the US network also form a fully connected network. A very few rich nodes consist a rich club and become the core of the airport delay network. These airports are shown in Figures 2(a) and 2(b). As can be seen, the core airports in the delay network are mainly distributed in the central and eastern regions of China. Due to the huge amount of traffic, these regions exhibit larger flight delays.
To compare the differences between traditional airport network studies and our work, we construct airport net-works using the most commonly used method. More spe-cifically, the edges between airports are linked by the direct flights, while the weight of the edge is the number of flights between two airports. We denote this network as “Flight Network.” In fact, there is no difference between flight network and delay network if only topological properties, such as degree distributions and rich clubs, are considered. However, the measures of weighted networks can reveal interesting information that is embedded in the network. Here we examine the betweenness centrality of these two networks. The betweenness centrality cB(v) of a nodevis defined as the sum of the fractions of all shortest paths in the network which pass through v.
cB(v) � s,e∈V
σ(s, e|v)
σ(s, e) , (15)
whereσ(s, e)is the total number of shortest paths between (s,e) andσ(s, e|v)is the number of those paths that pass through nodev.
Figure 3 plots the relationships between the betweenness centrality and degree of airports in the two networks. The focus has been given to the analysis of the top 30 airports in the two airport systems (i.e., FAA core 30 airports in USA and the top 30 airports in terms of takeoffs and landings in China). It was previously reported that nodes with large degree normally have large betweenness. Airports such as Beijing Capital International airport (PEK), Atlanta airport (ATL), O’Hare International airport (ORD), and Dallas Fort Worth airport (DFW) manifest this pattern [37]. Our results also demonstrate this relationship as shown in the far right of Figure 3. These airports play an important role of transportation in networks as they are also ranked in the top of the air transport system.
Figure 3 reveals that there are only slight differences in the betweenness centrality as obtained from the flight net-work and delay netnet-work of the US, as most of the blue squares and black circles overlap. One obvious outlier is MSP (Minneapolis Saint Paul International Airport). MSP has much higher betweenness centrality in the delay network than that in the flight network. In contrast, the difference in the betweenness centrality between the flight and delay networks of China is very obvious. A few airports with medium degree have significantly higher betweenness
centrality in the delay network. The betweenness centrality measures the importance of the node in terms of infor-mation/traffic control in the network. The higher be-tweenness centrality would suggest a stronger ability in controlling delay propagation over the network. One would expect that a node with higher betweenness centrality in the flight network should have higher betweenness centrality in the delay network. The hypothesis is that an airport with more flights has more ability to control delay. As we can see from Figure 3, the US airport network does support this hypothesis. However, the nine airports standing out in the Chinese airport network deserve further investigation. All these nine airports are the hub airports located in the capital cities of different provinces (except TSN). Most of these airports have lower ranks in the national air transport system (XIY: 7, HGH: 9, NKG: 11, TSN: 17, URC: 18, HRB: 22, SHE: 23, TNA: 25, and LHW: 27). The higher betweenness cen-trality of these airports in the delay network however in-dicates that they may have a significant influence on delay propagation.
To explain why Chinese airports with higher between-ness centrality emerged in the delay network, we examine two factors: the geographical characteristics of the airports and their operational characteristics. First, the nine airports are widely distributed in the mainland China as shown in Figure 2. Among them, URC and HRB are close to the North boundary of the country, while XIY and LHW are the major transfer hubs in the center of the mainland. Although none of these airports are the main bases of Chinese major air-lines, they serve as the hubs for several airlines in the region. Flight delay can be quickly propagated in the network through them if there is serious flight delay at the connected airports. The other four airports (TSN, HGH, SHE, and NKG) have been already reported in a previous study [38]. Simulations have shown that their role in measuring the resilience of the airport network is underestimated if only structural metrics are considered. Again, the difference in betweenness centrality of the two network types suggests that the analysis of the network by incorporating the net-work dynamics information can offer insight into the fundamental nature of the complex system.
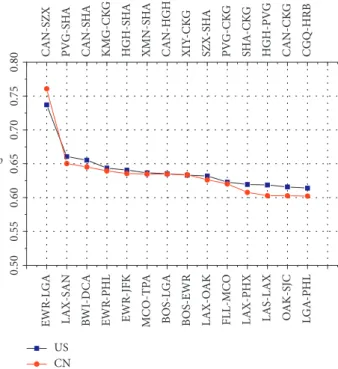
4.2. Correlation of Flight Delay between Airports. To study the correlation of the flight delays in the airport network, we calculate the cross-correlation matrixCof airport delay time series data according to equation (3). It is very interesting to find that the most correlated airports in both countries have quite similar characteristics. Figure 4 plots the most cor-related airport pairs in the two air transport systems.
Newark airport (EWR), LaGuardia airport (LGA), and Kennedy airport (JFK) are all located in New York met-ropolitan area, while Boston Logan airport (BOS) and Philadelphia airport (PHL) are geographically close and have many flights to these three airports. Due to similar opera-tional environments and geographical locations, flight delays in these airports also show similar characteristics. Likewise, Baltimore airport (BWI) and Washington National airport (DCA) are located in the Washington area, and Fort
Lauderdale airport (FLL), Orlando airport (MCO), and Tampa airport (TPA) are located in Miami area. The other six airports with the highest delay correlations are located in the west of USA. In China, the correlation coefficients of airports between Guangzhou (CAN) and Shenzhen (SZX), Shanghai Pudong (PVG) and Shanghai Hongqiao (SHA), and Guangzhou (CAN) and Shanghai Hongqiao (SHA) are much larger than the other airport pairs.
The top airport pairs are generally airports in the same metropolitan area. It is very likely that they experience the same meteorological condition or suffer the same Traffic Management Initiatives because of their geographic prox-imity. Therefore, the correlation indicates that geographical location is an exogenous factor that has significant impact on flight delays.
4.3. Analysis of Delay Detrended Fluctuation. In order to further reveal the inherent patterns of flight delays per-taining to the temporal characteristics of flight delays, we adopted the standard MF-DFA to analyze the time series of flight delays.
Here, based on empirical data of mainland China and USA in 2012, we calculated the total flight delays by hour to obtain year-long delay time series for both regions.
In the first-order MF-DFA analysis, the value ofqis in the range of[−10,10]. Figures 5(a) and 5(b) are the double logarithmic plots of Fq(s) −s of flight delays. Figure 6(a) shows the results on the generalized Hurst indexh(q)with the decreasing value ofq. Whenqincreases from−10 to+10 , a decreasing trend ofh(q)is revealed. For the China flight
(a) (b)
Figure2: Geographic locations of the airports in China and USA. (a) Top 30 airports in China. (b) The FAA core 30 airports. Red markers are the airports in the rich clubs (i.e., the 15 airports in China and the 16 airports in USA), while squares are the airports that have been identified with higher betweenness centrality in the delay networks.
0.8
0.6
B
etw
eennes
s cen
trali
ty
0.4
0.2
0
50 100 150 200
Degree Delay network (CN)
Delay network (US)
Flight network (CN) Flight network (US)
250 300
MSP XIY
LGA TNA
SHE HGH HRB URC
TSN NKG LHW
Aa Aa
Figure3: Comparisons on the betweenness centrality of networks of USA and China.
0.80
0.75
0.70
0.65
ρ
0.60
0.55
0.50
EW
R-LG
A
LAX-SAN BWI-D
CA
EW
R-PH
L
EWR
-JFK
M
C
O-TP
A
BOS-L
GA
BOS-E
WR
LAX-O
AK
FLL
-M
C
O
LAX-PHX LA
S-L
AX
O
AK-S
JC
LG
A-PH
L
CAN-SZX PVG-S
H
A
CAN-S
H
A
KM
G-CK
G
H
GH-S
H
A
XMN-S
H
A
CAN-H
GH
XIY
-CK
G
SZX-S
H
A
PV
G-CK
G
SH
A-CK
G
H
GH-PV
G
CAN-CK
G
C
GQ-HRB
US CN
delay series,h(q) decreases from 0.88 to 0.73. For the US flight delay series, h(q) decreases from 0.93 to 0.67. Therefore, h(q) of delay series is not a constant, which suggests that flight delays exhibit obvious fractal charac-teristics, which cannot be described by a single fractal method. It should be noted that there exists a transition point sx in both systems, at which the slope of lineFq(s)
versusschanges dramatically. The positions ofsxseem to be
independent ofq. We see from Figures 5(a) and 5(b) thatsx
is always located ats≈24 . This is equivalent to one flight operation circle, wherein flight delays roll back to zero when a new operational day starts.
Whenq�2 , MF-DFA is reduced to the standard DFA. The generalized Hurst index h(q) of China and the US flight delays are 0.79 and 0.76 respectively. This indicates that flight delays have a positive long-range correlation. They have a long-range power-law relationship and are sensitive to the initial condition. Flight delay data is a typical fractal time series data. The dynamics of flight delays are not a random process. Past delays will affect future delays.
Figure 6(a) shows thath(q)of China and USA is bigger than 0.5 whenqis less than 0. Small fluctuation will have a strong positive correlation. The strength of the positive
101 102 103 104
103 104 105 106 107
s Fq
(
s
)
q = –10
q = –5
q = –2
q = –1
q = 0
q = 1
q = 2
q = 5
q = 10
(a)
101 102 103 104
s
102 103 104 105 106 107
Fq
(
s
)
q = –10
q = –5
q = –2
q = –1
q = 0
q = 1
q = 2
q = 5
q = 10
(b) Figure5: Relationships betweenFq(s)andsfor (a) China and (b) USA.
–10 –5 0 5 10
0.65 0.7 0.75 0.8 0.85 0.9 0.95 1
q
h
(
q
)
US CN
(a)
α
0.6 0.7 0.8 0.9 1
0.2 0.3 0.4 0.5 0.6 0.7 0.8 0.9 1
f
(
α
)
CN US
(b)
Figure6: (a) Generalized Hurst index of flight delays series of China and USA. (b) Multifractal spectrum of China’s and USA’s flight delays series.
correlation of the US airports is greater than that of China airports.h(q) decreases gradually whenqis bigger than 0. However, its value is still greater than 0.5. This indicates that, even after a long time interval, fluctuation of flight delays still has a positive autocorrelation. Flight delays will not change too much for a certain period.
Figure 6(b) shows the multifractal spectra of China and the US flight delays. From the multifractal theories, we know that the singularity spectraf(α)at the minimum value ofα
indicate the maximum fluctuation of the system. The smaller value ofαdenotes larger fluctuation of the system. It can be seen from Figure 6(b) that the US air transport system has larger fluctuation. Compared to the China air transport system, where the value of α is around 0.68, the US air transport system has a smaller value: α≈0.61. This result suggests there is more delay fluctuation in the US air transport systems.
The range of singularities(Δα)measures the difference between the maximum and the minimum fluctuations of the system, which can be used to capture the strength of multifractal characteristics of the system.Δαof the US air transport system is 0.41, whileΔαfor the China air transport system is 0.25. Therefore, the air transport system in USA has stronger multifractal characteristics than those in China. It also indicates that the air transport system in USA is more capable of handling such fluctuation, that is, unexpected flight delays.
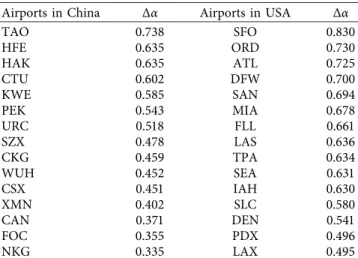
We further applied the MF-DFA approach to the flight delay time series data of all airports to show the multifractal characteristics of the airport system. Detailed results of the airports with the larger range of singularity are included in Table 4. Most of the airports in USA have the range over 0.5, while only 7 airports in China have the range over 0.5, meaning there are more airports in USA which must deal with unexpected flight delays.
5. Conclusions and Discussions
Network science has been advancing our knowledge of complex systems. Various measures and techniques have
been proposed to capture the fundamental properties of the systems. In the field of air transportation, airport networks have been investigated from different perspectives. The analytical results depend on how the network is constructed, but there has been little study of this dependency. In this paper, a quantitative method aiming at the comparison of delay networks of USA and China is introduced. Based on the actual operational data, we propose a method to con-struct an airport network containing delay information. We carried out the comparison between delay networks in China and USA from the following three aspects. Firstly, we compare the structural properties of flight delay networks in USA and China. The degree distributions of these two networks follow the double power-law distributions and have scale-free characteristics. Furthermore, we compare the betweenness centrality in the flight and delay networks. We found nine airports with higher betweenness centrality in the delay network, suggesting that these airports play an important role in the delay propagation. Secondly, we cal-culate the correlations of flight delay between airports and found that geographical location is the external factor that has the greatest impact on flight delays. Finally, the flight delay time series data was analyzed using the MF-DFA method. We found that flight delays exhibit obvious fractal characteristics that cannot be described by the single fractal method. The air transport system in USA seems to be more capable of handling fluctuation like unexpected flight delays. The contribution of this work is twofold. From the theoretical perspective, we demonstrated that the con-struction of airport network from delay data can provide new insights into the fundamental properties of the air transport system. From a more practical point of view, our analytical results have identified severalinfluentialairports and general patterns in the air transport system. System-wide managers, such as network managers, should focus on those airports that have higher betweenness centrality in the delay networks. Additionally, precautions should be made at the airport which is the most correlated airport and is ex-periencing serious flight delay. This paper provides novel insights into the network structure and dynamics. Many outstanding questions remain to be answered. It would be particularly important to explore the implications of net-work structures. A clearer understanding of air trans-portation systems requires continued investigation into the specifics of each subsystem by adopting a domain-specific perspective.
Data Availability
The US data used to support the findings of this study are publicly available on the website of Bureau of Transport Statistics (https://www.bts.gov). The Chinese data used to support the findings of this study are available from the Operation Monitor Center, Civil Aviation Administration of China, upon request.
Conflicts of Interest
The authors declare that they have no conflicts of interest.
Table4: Ranges of singularity spectra of the airports. Airports in China Δα Airports in USA Δα
TAO 0.738 SFO 0.830
HFE 0.635 ORD 0.730
HAK 0.635 ATL 0.725
CTU 0.602 DFW 0.700
KWE 0.585 SAN 0.694
PEK 0.543 MIA 0.678
URC 0.518 FLL 0.661
SZX 0.478 LAS 0.636
CKG 0.459 TPA 0.634
WUH 0.452 SEA 0.631
CSX 0.451 IAH 0.630
XMN 0.402 SLC 0.580
CAN 0.371 DEN 0.541
FOC 0.355 PDX 0.496
Acknowledgments
This research was supported by the National Natural Science Foundation of China (Grant nos. U1833126, 61773203, and 61304190).
References
[1] European Commission,Communication from the Commis-sion to the European Parliament, the Council, the European Economic and Social Committee and the Committee of the Regions- an Aviation Strategy for Europe, European Com-mission, Brussels, Belgium, 2015.
[2] Federal Aviation Administration, The Economic Impact of Civil Aviation on the U.S. Economy, U.S. Department of Transportation, Federal Aviation Administration, Wash-ington, DC, USA, 2015, http://www.faa.gov/air{\_}traffic/ publications/media/2015-economic-impact-report.pdf. [3] V. Colizza, A. Barrat, M. Barth´elemy, and A. Vespignani, “The
role of the airline transportation network in the prediction and predictability of global epidemics,” Proceedings of the National Academy of Sciences, vol. 103, no. 7, pp. 2015–2020, 2006.
[4] R. Guimera, S. Mossa, A. Turtschi, and L. A. N. Amaral, “The worldwide air transportation network: anomalous centrality, community structure, and cities’ global roles,”Proceedings of the National Academy of Sciences, vol. 102, no. 22, pp. 7794–7799, 2005.
[5] M. M. Hossain and S. Alam, “A complex network approach towards modeling and analysis of the Australian Airport Network,” Journal of Air Transport Management, vol. 60, pp. 1–9, 2017.
[6] A. Vespignani, “Modelling dynamical processes in complex socio-technical systems,” Nature Physics, vol. 8, no. 1, pp. 32–39, 2012.
[7] W.-B. Du, M.-Y. Zhang, Y. Zhang, X.-B. Cao, and J. Zhang, “Delay causality network in air transport systems,” Trans-portation Research Part E: Logistics and TransTrans-portation Re-view, vol. 118, pp. 466–476, 2018.
[8] N. Kafle and B. Zou, “Modeling flight delay propagation: a new analytical-econometric approach,” Transportation Re-search Part B: Methodological, vol. 93, pp. 520–542, 2016. [9] N. Pyrgiotis, K. M. Malone, and A. Odoni, “Modelling delay
propagation within an airport network,”Transportation Re-search Part C: Emerging Technologies, vol. 27, pp. 60–75, 2013. [10] K. Gopalakrishnan, M. Z. Li, and H. Balakrishnan, “Identi-fication of outliers in graph signals,” inProceedings of the 58th IEEE Conference on Decision and Control, vol. 1–10, Nice, France, December 2019.
[11] M. Li, K. Gopalakrishnan, Y. Wang, and H. Balakrishnan, “Outlier analysis of airport delay distributions in US and China,” in Proceedings of the 1st Conference on Artificial Intelligence and Data Analytics in Air Transportation, vol. 1–13, IEEE, Singapore, February 2020.
[12] L. A. N. Amaral, A. Scala, M. Barthelemy, and H. E. Stanley, “Classes of small-world networks,”Proceedings of the National Academy of Sciences, vol. 97, no. 21, pp. 11149–11152, 2000. [13] A. Barrat, M. Barthelemy, R. Pastor-Satorras, and A. Vespignani, “The architecture of complex weighted net-works,” Proceedings of the National Academy of Sciences, vol. 101, no. 11, pp. 3747–3752, 2004.
[14] R. Guimer`a and L. A. N. Amaral, “Modeling the world-wide airport network,” The European Physical Journal B—Condensed Matter, vol. 38, no. 2, pp. 381–385, 2004.
[15] M. Zanin, X. Sun, and S. Wandelt, “Studying the topology of transportation systems through complex networks: handle with care,” Journal of Advanced Transportation, vol. 2018, Article ID 3156137, 17 pages, 2018.
[16] G. Bagler, “Analysis of the airport network of India as a complex weighted network,”Physica A: Statistical Mechanics and its Applications, vol. 387, no. 12, pp. 2972–2980, 2008. [17] C. Li-Ping, W. Ru, S. Hang et al., “Structural properties of US
flight network,” Chinese Physics Letters, vol. 20, no. 8, pp. 1393–1396, 2003.
[18] L. E. C. D. Rocha, “Structural evolution of the Brazilian airport network,” Journal of Statistical Mechanics: Theory and Ex-periment, vol. 2009, no. 4, Article ID P04020, 2009. [19] A. Wang Jiao’e, H. Mo, and F. Jin, “Spatial structural
char-acteristics of Chinese aviation network based on complex network theory,” Acta Geographica Sinica, vol. 64, no. 8, pp. 899–910, 2009.
[20] Y. He, X. Zhu, and D.-R. He, “Statistics and developing model of Chinese skyway network,”International Journal of Modern Physics B, vol. 18, no. 17, pp. 2595–2598, 2004.
[21] W. Li and X. Cai, “Statistical analysis of airport network of China,”Physical Review E, vol. 69, no. 4, p. 46106, 2004. [22] W.-B. Du, X.-L. Zhou, O. Lordan, Z. Wang, C. Zhao, and
Y.-B. Zhu, “Analysis of the Chinese airline network as multi-layer networks,”Transportation Research Part E: Logistics and Transportation Review, vol. 89, pp. 108–116, 2016.
[23] C. Ducruet, “Multilayer dynamics of complex spatial net-works: the case of global maritime flows (1977–2008),”Journal of Transport Geography, vol. 60, pp. 47–58, 2017.
[24] S. Wandelt, X. Sun, and J. Zhang, “Evolution of domestic airport networks: a review and comparative analysis,” Transportmetrica B: Transport Dynamics, vol. 7, no. 1, pp. 1– 17, 2019.
[25] G. Michele and F. Maria, “Topology of Italian airport network: a scale-free small-world network with a fractal structure?” Chaos Solitons and Fractals, vol. 31, no. 3, pp. 527–536, 2007. [26] L. Dai, B. Derudder, and X. Liu, “The evolving structure of the Southeast Asian air transport network through the lens of complex networks, 1979–2012,”Journal of Transport Geog-raphy, vol. 68, pp. 67–77, 2018.
[27] M. G. Santos and A. P. Antunes, “Long-term evolution of airport networks: optimization model and its application to the United States,”Transportation Research Part E: Logistics and Transportation Review, vol. 73, pp. 17–46, 2015. [28] J. Wang, H. Mo, and F. Wang, “Evolution of air transport
network of China 1930–2012,”Journal of Transport Geogra-phy, vol. 40, pp. 145–158, 2014.
[29] J. Zhang, X.-B. Cao, W.-B. Du, and K.-Q. Cai, “Evolution of Chinese airport network,”Physica A: Statistical Mechanics and Its Applications, vol. 389, no. 18, pp. 3922–3931, 2010. [30] M. Azzam, U. Klingauf, and A. Zock, “The accelerated growth
of the worldwide air transportation network,”The European Physical Journal Special Topics, vol. 215, no. 1, pp. 35–48, 2013. [31] H. Fricke and M. Schultz, “Delay impacts onto turnaround performance—optimal time buffering for minimizing delay propagation,” inProceedings of the USA/Europe Air Traffic Management Research and Development Seminar, pp. 1–10, Napa, CA, USA, June 2009.
[32] M. Jetzki,The propagation of air transport delays in Europe, Ph.D. thesis, Department of Airport; Air Transportation Research, RWTH Aachen University, Aachen, Germany, 2009.
[33] P. Fleurquin, J. J. Ramasco, and V. M. Eguiluz, “Systemic delay propagation in the US airport network,”Scientific Reports, vol. 3, no. 1, 2013.
[34] C.-L. Wu and K. Law, “Modelling the delay propagation effects of multiple resource connections in an airline network using a bayesian network model,” Transportation Research Part E: Logistics and Transportation Review, vol. 122, pp. 62–77, 2019.
[35] P. Xu, S. Zaoli, F. Lillo, L. Delgado, and G. Gurtner, “New centrality and causality metrics assessing air traffic network interactions,” 2019, http://arxiv.org/abs/1911.02487. [36] C.-K. Peng, S. V. Buldyrev, S. Havlin, M. Simons,
H. E. Stanley, and A. L. Goldberger, “Mosaic organization of dna nucleotides,” Physical Review E, vol. 49, no. 2, pp. 1685–1689, 1994.
[37] M. G. Song and G. T. Yeo, “Analysis of the air transport network characteristics of major airports,”The Asian Journal of Shipping and Logistics, vol. 33, no. 3, pp. 117–125, 2017. [38] Y. Wang, J. Zhan, X. Xu, L. Li, P. Chen, and M. Hansen,
“Measuring the resilience of an airport network,” Chinese Journal of Aeronautics, vol. 32, no. 12, pp. 2694–2705, 2019.