413
© 2018 by the Serbian Biological Society How to cite this article: Farissi M, Mouradi M, Farssi O, Bouizgaren A, Ghoulam C. Variations in leaf gas exchange, chlorophyll fluorescence and membrane potential of Medicago sativa root cortex cells exposed to increased salinity: The role of the antioxidant potential in salt tolerance. Arch Biol Sci. 2018;70(3):413-23.
Variations in leaf gas exchange, chlorophyll fluorescence and membrane potential
of
Medicago sativa
root cortex cells exposed to increased salinity: The role of the
antioxidant potential in salt tolerance
Mohamed Farissi1,*, Mohammed Mouradi2,3, Omar Farssi1, Abdelaziz Bouizgaren3, and Cherki Ghoulam2
1Laboratory of Biotechnology and Sustainable Development of Natural Resources, Polydisciplinary Faculty, Sultan Moulay
Slimane University, PO Box: 592, Beni-Mellal, 23000 Morocco
2Unit of Biotechnology and Agro-physiology of Symbiosis, Faculty of Sciences and Techniques, PO. Box 549, Gueliz 40000
Marrakesh, Morocco
3Unit of Plant Breeding, National Institute for Agronomic Research (INRA), PO. Box 533, Gueliz 40000, Marrakesh, Morocco
*Corresponding author: [email protected]
Received: October 19, 2017; Revised: December 1, 2017; Accepted: December 15, 2017; Published online: January 8, 2018
Abstract: Salinity is one of the most serious agricultural problems that adversely affects growth and productivity of pasture crops such as alfalfa.In this study,the effects of salinity on some ecophysiological and biochemical criteria associated with salt tolerance were assessed in two Moroccan alfalfa (Medicago sativa L.) populations, Taf 1 and Tata. The experiment was conducted in a hydro-aeroponic system containing nutrient solutions, with the addition of NaCl at concentrations of 100 and 200 mM. The salt stress was applied for a month. Several traits in relation to salt tolerance, such as plant dry biomass, relative water content, leaf gas exchange, chlorophyll fluorescence, nutrient uptake, lipid peroxidation and antioxidant enzymes, were analyzed at the end of the experiment. The membrane potential was measured in root cortex cells of plants grown with or without NaCl treatment during a week. The results indicated that under salt stress, plant growth and all of the studied physiological and biochemical traits were significantly decreased, except for malondialdehyde and H2O2 con-tents, which were found to be increased under salt stress. Depolarization of membrane root cortex cells with the increase in external NaCl concentration was noted, irrespective of the growth conditions. The Tata population was more tolerant to high salinity (200 mM NaCl) and its tolerance was associated with the ability of plants to maintain adequate levels of the studied parameters and their ability to overcome oxidative stress by the induction of antioxidant enzymes, such as guaiacol peroxidase, catalase and superoxide dismutase.
Key words: alfalfa; salinity; leaf exchange; membrane potential; antioxidant enzymes
Abbreviations: APX – ascorbate peroxidase; Ci – intercellular CO2 concentration; CAT – catalase; Chl – chlorophyll; DW – dry weight; E – transpiration rate; Fv/Fm – chlorophyll fluorescence; gs – stomatal conductance; GR – glutathione reduc-tase; LSD – least significant difference; MDA – malondialdehyde; PN – net photosynthesis; POD – guaiacol peroxidase; prot – protein; PPO – polyphenol oxidase; PS – photosystem; ROS – reactive oxygen species; RWC – relative water content; SOD – superoxide dismutase; TBA – thiobarbituric acid; TCA – trichloroacetic acid
INTRODUCTION
Increased salinity is a serious global problem. It is one of the major limiting factors in agriculture. In the Mediterranean region, particularly in dry areas, it adversely affects pasture crops such as alfalfa, by decreasing their growth and yield via osmotic stress and the injurious effects of increased concentrations of toxic Na+ and Cl- ions [1].
re-quires a deep understanding of the various complex mechanisms implicated in salt tolerance. Therefore, plant tolerance to high salinity constitutes a decisive environmental research topic [2].
In general, exposure to salt stress engenders sev-eral common reactions in plants. These reactions lead to cellular dehydration with concomitant osmotic changes and the removal of water from the cytoplasm into the extracellular space, thereby reducing cytosolic and vacuolar volumes [3]. Plants respond to salt stress through ion (Na+) and osmotic signals. An excess of Na+ in the rooting medium can be detected by trans-membrane protein receptors [4]. This excess causes changes in protein structure and membrane depolar-ization that can lead to the perception of ion toxicity. Suárez [5] and Netondo et al. [6] reported that pho-tosynthetic activity decreases when plants are grown under saline conditions, leading to reduced growth and productivity. The reduction in photosynthesis under salinity can be attributed to a decrease in the chlorophyll content [7], stomatal conductance [8], PS ΙΙ activity and CO2 fixation [9]. Another consequence of exposure to this circumstance is the generation of ROS, which include hydrogen peroxide (H2O2), super-oxide (O2-), hydroxyl radical (HO) and singlet oxygen (1O
2), and increased oxidative stress. This adversely affects cellular structures and whole plant metabolism [10]. To cope with the oxidative stress and cellular damage, plants have developed several nonenzymatic and enzymatic defense mechanisms [11]. Nonenzy-matic antioxidant processes involve the binding or scavenging of ROS with β-carotenes, ascorbic acid, α-tocopherol, reduced glutathione, soluble sugars, gly-cine betaine and proline. Enzymatic processes involve reactions with SOD, GPX, APX, CAT, PPO and GR [1,3,12,13]. It has been reported that salt stress in-duces the activities of mitochondrial and chloroplast SOD and APX [14,15]. Little is known about the re-sponses of these enzymes to salt stress. A higher level of antioxidants is considered a manifestation of the salt tolerance mechanism developed by plants to cope with the ROS. Previous studies reported that tolerant genotypes have higher levels of antioxidants in their tissues than sensitive ones [16-18]. Mhadhbi et al [19] reported that in tolerant genotypes of Medicago
trun-catula antioxidant gene-enzyme responses strongly
contribute to defense against salinity stress, especially in tolerant genotypes. In this context, the aim of the
present study was to evaluate salt stress effects on two Moroccan alfalfa populations with the hypothesis that salt tolerance may be related to some determinant mechanisms of ROS scavenging, PS II performance and the ability to exclude Na+ toxic ions form the cells. The assessment focused on some agrophysiological and biochemical parameters related to salt tolerance, including plant growth, the RWC, leaf gas exchange, chlorophyll fluorescence, chlorophyll contents, mem-brane depolarization, nutrient concentrations, lipid peroxidation and hydrogen peroxide contents. The role of antioxidant enzymes in salt tolerance was also investigated and discussed.
MATERIALS AND METHODS
Plant material and growth conditions
Two Moroccan populations (Tata and Taf 1) of alfalfa
(M. sativa L.) were used in this study. These
measure-ments and biochemical analyses and were harvested. Each container was considered as a replicate, with three replicates per treatment per population.
DW measurement
For DW determination, shoots and roots were dried in an oven at 70°C for 48 h and weighed. To standard-ize the data, the results were expressed as the relative reduction of yield in comparison to the control using the following formula [13]:
Relative reduction (%) = [(1− (salinized /control)]×100
RWC
RWC was estimated by recording the turgid weight (TW) of 0.1 g fresh leaflet (FW) samples by maintain-ing in water for 4 h, followed by drymaintain-ing in a hot air oven until a constant weight was achieved (DW). The RWC was calculated using the following formula [13]:
RWC = [(FW-DW) / (TW-DW)]×100
Chlorophyll fluorescence (Fv/Fm) measurement
The chlorophyll fluorescence was measured using a portable chlorophyll fluorescence meter (Handy PEA, Hansatech, England) after 20 min of dark adaptation. Chlorophyll fluorescence was estimated by the Fv/Fm
ratio = (Fm−Fo)/Fm, which represents the maximum quantum yield of PS II, where Fv is the varietal fluores-cence of dark adapted alfalfa leaves and Fm and Fo are the maximal and minimal fluorescence respectively.
Measurement of photosynthetic pigments
Chl (a+b) was extracted with acetone in a mortar, us-ing 200 mg of fresh leaf tissue and 5 mL of acetone (80%, v/v). The Chl concentration was measured by the method described by Arnon [22]. After centrifu-gation for 10 min at 5000 × g, the absorbance (OD) of the supernatant was measured at 663 and 645 nm. Chl (a+b) were determined using the following formula:
Chl(a+b)=8.02OD663+20.20OD645
Leaf gas exchange measurement
Photosynthetic activity was estimated by an infrared gas analyzer (LICOR 6400-40; Lincoln, Nebr. USA) after 30 days of treatment. PN, Ci, gs and E were deter-mined at an ambient CO2 concentration of 350 µmol mol-1, temperature of 25±1°C, 60±5% relative humid-ity and a photon flux denshumid-ity of 1000 µmol m-2 s-1.
Lipid peroxidation assessment
Lipid peroxidation was evaluated by malondialde-hyde (MDA) accumulation according to the described method [23]. Leaves or roots (100 mg) were crushed in 1.5 mL of TBA at 0.1%. The homogenate was then centrifuged at 10000 × g for 10 min. To the obtained supernatant (1 mL), 1 mL 20% trichloroacetic acid containing 0.5% of TBA was added. The mixture was heated at 95°C for 30 min. The reaction was stopped by immersion of the reaction vessel into an ice bath, followed by centrifugation at 10000 × g for 10 min. The absorbance of the obtained supernatant was de-termined at 532 nm. Nonspecific absorbance at 600 nm was measured and subtracted from the 532 nm readings. The results were calculated using the molec-ular extinction coefficient of the complex MDA-TBA: 155 mM-1 cm-1 and expressed as nmol MDA g-1 FW.
Hydrogen peroxide content
The H2O2 content in roots and leaves of plants was determined as described [24]. Fresh samples (100 mg) of nodules or leaves were homogenized in an ice bath with 5 mL of 0.1 % TCA. The homogenate was centrifuged at 12000 × g for 15 min and 0.5 mL of the supernatant was added to 0.5 mL of 10 mM potassium phosphate buffer (pH 7.0) and 1 mL of 1 M potassium iodide, and the absorbance was measured at 390 nm. The H2O2 content was expressed as µmol H2O2 g-1 FW.
Antioxidant potential assessment
to [25]. The reaction mixture consisted of 200 μL of H2O2 at 0.3%, 300 μL of guaiacol at 20 mM, 2 mL of phosphate buffer (0.1 M, pH 6), 1 mL of distilled water and 10 μL of enzymatic extract. After 3 min, POD activity was determined at 470 nm against a control, where the enzymatic extract was replaced by distilled water. The activity of POD was calculated using the extinction coefficient of guaiacol, 26.6 mM-1 cm-1, and expressed as µmol H2O2 min-1 mg-1 prot.
CAT activity
CAT (EC 1.11.1.6) activity was determined as de-scribed [26]. The plant material (100 mg of leaves or roots) was homogenized in 1.5 mL of Tris-HCl buf-fer (pH 8.5), including 2 mm EDTA and 10% (w/v) polyvinylpolypyrrolidone (PVPP). The homogenate was centrifuged at 16000 × g for 14 min at 4°C. The supernatant was used for activity determination by the addition of 250 µL enzyme extract to 2 mL of the assay mixture (50 mM Tris-HCl buffer pH 6.8, containing 5 mM H2O2). The reaction was stopped by adding 250 µL of 20% titanic tetrachloride in concentrated HCl (v/v) after 10 min at 20°C. A blank was prepared by the addition of 250 µL of 20% titanium tetrachlo-ride at zero time to stop enzyme activity. Absorbance was read at 415 nm against water. CAT activity was determined by comparing the absorbance against a standard curve of H2O2 from 0.25 to 2.5 mM. CAT activity was expressed as µmol H2O2 min-1 mg-1 prot. SOD activity
SOD (EC 1.15.1.1) activity was determined as de-scribed [27]. Fifty µL of crude enzymatic extract in phosphate buffer (20 mM, pH 7) was added to a solu-tion containing 13 mM L-methionine, 75µM p-nitro blue tetrazolium chloride (NBT), 100 µM EDTA and 2 µM riboflavin in a 50-mM potassium phosphate buffer (pH 7.8). The reaction was performed in assay tubes upon illumination using a 30 W fluorescent lamp at 25°C for 15 min. The blue formazan produced by NBT photoreduction was spectrophotometrically measured at 620 nm. The blank solution had the same complete reaction mixture but was kept in the dark. One SOD unit of activity was defined as the amount of enzyme required to inhibit 50% of NBT photoreduction in comparison to tubes without the plant extract. SOD activity was expressed as enzymatic U min-1 mg-1 prot.
Membrane potential measurements in root cortex cells
Alfalfa seedlings were grown with or without 200 mM NaCl for one week. The membrane potential in root cortex cells was measured as previously described [28] with slight modification. Five-cm root segments were fixed in a plexiglass chamber filled with a bath solu-tion containing 1 mM CaCl2, 2 mM 2-(N-morpholino) ethanesulfonic acid (MES) /Tris, pH 6 (background solution). To impale cortex cells, a microelectrode was placed at the root surface using a manually operated micromanipulator (Narishige, http://narishige-group. com) and a micro-elevator (IT6D CA1; Microcontrole, http://www.newport.com) was used to adjust the ver-tical position of the root chamber, allowing precise penetration of the microelectrode into a cortical cell. During impalement, the bathing solution was continu-ously refreshed. After stabilization of the membrane potential, the solution containing 1 mM CaCl2, 2 mM Mes/Tris pH 6.0, and 100 mM NaCl was added and the membrane potentials were recorded.
Phosphorus (P) and nitrogen (N) contents
The tissue P content was calorimetrically determined using the molybdate blue method [29]. P concentra-tion was measured by reading the absorbance at 820 nm after color development at 100ºC for 10 min. A standard curve was established with KH2PO4 solu-tions. To measure the N content, 0.5g of dry matter was used from every sample. N was measured accord-ing to the Tecator and Kejeldal method [30].
Statistical analysis
All statistical analyses were performed with IBM SPSS 21 software. Significant differences between the means were compared by the least significant difference (LSD) test (P<0.05).
RESULTS
Effect of salt stress on dry weight
and root dry biomass of the studied alfalfa populations in comparison with matching controls (0 mM NaCl). The reductions were more pronounced under the high salinity treatment (200 mM NaCl). All of the tested populations were affected to a significant (P<0.01) degree. The Tata population presented the lowest bio-mass reductions of 24.5% and 33.6% for roots and shoots, respectively, under high salinity (200 mM). However, Taf 1 exhibited the highest reductions of 41.3% and 44.8%, respectively, under the same condi-tions. According to ANOVA II, the interaction effect (salinity×population) was significant.
Effect on the RWC
Salt treatment caused a significant (P<0.01) decrease in leaf RWC in the studied alfalfa populations (Table 1). This parameter gradually decreased with the in-crease in NaCl concentration in the rooting medium. From the control to the high NaCl treatment (200 mM), the variation of RWC values was more pro-nounced for Taf 1, ranging from 84.7% in the control to 76.5% in the 200 mM NaCl treatment. A less im-portant variation was recorded in Tata, with 83.2% determined for the control and 80.6% for the 200 mM NaCl treatment. However, according to ANOVA, the population effect was not significant (P>0.05).
Effect on Chl fluorescence (Fv/Fm)
The results presented in Table 1 show that the Fv/Fm
ratio was significantly (P<0.001) decreased in the leaves
of both populations subjected to salt stress. The Tata
population displayed the lowest reduction (5.01%) un-der the high NaCl treatment. However, Taf 1 exhibited a more pronounced reduction in value (17.4%) under the same conditions. No significant variation was detect-ed in plants subjectdetect-ed to mdetect-edium salt stress (100 mM NaCl). ANOVA II indicated that the population and interaction effects were significant (P<0.001; Table 1).
Effect on the total Chl content
Table 1 shows that salinity stress caused a significant decrease in total Chl contents (P<0.001). This reduc-tion was more pronounced at higher NaCl concen-trations. Again, the Taf 1 population was the most negatively affected, possessing a Chl value of 4.02 mg g-1 FW, while Tata had 5 mg g-1 FW.
Effect on leaf gas exchange
The results presented in Table 2 indicate that all of the tested photosynthesis traits were significantly (P<0.001, Table 1) reduced in the two alfalfa geno-types subjected to both stress levels. Under high salin-ity, the measured traits were significantly decreased (by half) in the Taf 1 population, as compared to the control (0 mM NaCl). Meanwhile, the reductions were relatively small in the Tata population. This popula-tion presented the highest Pn, gs, Ci and E values (18.64 μmol CO2 m-2 s-1, 0.109 mmol H
2O m-2 s-1, 97.20 μmol mol-1 and 4.63 mmol m-2 s-1, respectively) under high salinity (200 mM NaCl).
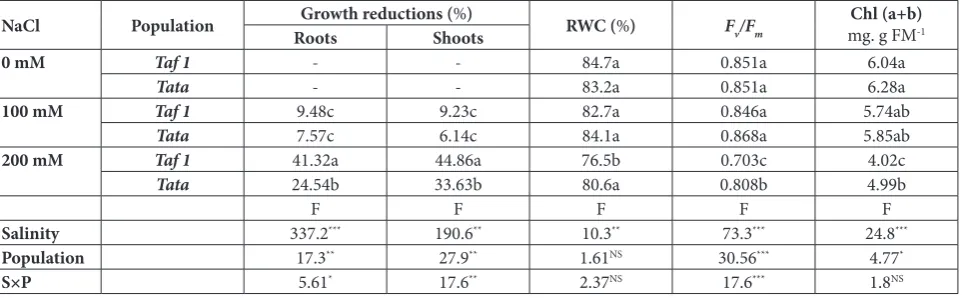
Table 1. Effect of salt treatments (0, 100 and 200 mM NaCl) on shoot and root growth, RWC and quantum yield of PS II (Fv/Fm) in
plants of two Moroccan alfalfa populations, Taf 1 and Tata.
NaCl Population Roots Growth reductions (Shoots%) RWC (%) Fv/Fm mg. g FMChl (a+b)-1
0 mM Taf 1 - - 84.7a 0.851a 6.04a
Tata - - 83.2a 0.851a 6.28a
100 mM Taf 1 9.48c 9.23c 82.7a 0.846a 5.74ab
Tata 7.57c 6.14c 84.1a 0.868a 5.85ab
200 mM Taf 1 41.32a 44.86a 76.5b 0.703c 4.02c
Tata 24.54b 33.63b 80.6a 0.808b 4.99b
F F F F F
Salinity 337.2*** 190.6** 10.3** 73.3*** 24.8***
Population 17.3** 27.9** 1.61NS 30.56*** 4.77*
S×P 5.61* 17.6** 2.37NS 17.6*** 1.8NS
Effect on MDA and H2O2 contents
To investigate the oxidative damage caused by salt stress, we measured the H2O2 and MDA contents in roots and leaves (Table 3). Under normal conditions (0 mM NaCl), H2O2 and MDA contents of Taf 1 and
Tata were statistically similar. However, their levels were significantly increased in plant organs when salinity was applied (100 and 200 mM NaCl), with significant variations between them. The Taf 1 popu-lation had the highest MDA and H2O2 concentrations (24.22 vs 34.88 nmol g-1 FM and 0.82 vs 1.18 µmol g-1 FM, respectively) in the roots and leaves under high salinity. Indeed, higher values were recorded for both traits in plant roots than in leaves. ANOVA indicates that the interaction effect was significant for the two parameters in both plant organs.
Effect on antioxidant enzyme activities
Exposure to increased saline conditions significantly (P<0.001) increased POD, CAT and SOD activities in root and leaf parts of the two studied populations (Figs. 1, 2 and 3). Significant (P<0.05) variations were detected between the populations according to the LSD test. This was associated with increased NaCl concentrations in the rooting medium. The activ-ity of POD was higher in roots than in the leaves, whereas the activities of CAT and SOD were higher in the leaves. Tata exhibited higher POD, CAT and SOD activities of (51.85, 6.85 µmol H2O2 min-1 mg-1 prot, and 5.50 U min-1 mg-1 prot, respectively) under salt stress than Taf1 (Figs. 1A, 2A and 3A). In the leaves, the activities were 44.49, 8.11 µmol H2O2 min -1 mg-1 prot, and 6.80 U min-1 mg-1 prot, respectively, under the same conditions (Fig. 1B, 2B and 3B). The interaction effect was significant (P<0.05) for all of the considered enzymes in both organs.
Membrane potential in root cortex cells
The data in Fig. 4 ilustrates the membrane potential of root cortex cells of two alfalfa populations grown with-out NaCl stress (A) or under exposure to increased sa-linity (200 mM NaCl) after one week (B). In the absence of NaCl, the recorded membrane potential was about -140 mV (Fig. 4). The addition of 100 mM NaCl rapidly depolarized the membrane of cortex cells irrespective of the growth conditions (under or unexposed to increased salinity). The membrane potentials were, respectively, -19±4 mV and -17±2 mV for Taf 1 and Tata when the
Table 2. Effect of salt treatments (0, 100 and 200 mM NaCl) on PN, gs, Ci and E in plants of two Moroccan alfalfa populations, Taf 1 and Tata.
NaCl Population Pn
μmol CO2 m-2 s-1
gs mol H2O m-2 s-1
Ci
μmol mol-1 mmol mE -2 s-1
0 mM Taf 1Tata 30.17a29.57a 0.165a0.160a 141.67a144.45a 6.75a6.93a
100 mM Taf 1Tata 24.30b25.93b 0.135b0.120c 120.97b98.18c 4.72c5.76b
200 mM Taf 1Tata 12.90d18.64c 0.079d0.109c 71.23d97.20c 3.37d4.63c
F F F F
Salinity 159.01*** 140.3*** 159.8*** 150.9***
Population 11.8** 21.4** 42.4*** 36.9***
S×P 7.9** 7.9** 6.7* 5.8*
Values are means of three replicates. Mean comparisons were performed using the LSD test.
Table 3. Effect of salt treatment (0, 100 and 200 mM NaCl) on MDA and H2O2 accumulation in roots and leaves of two Moroccan alfalfa populations, Taf 1 and Tata.
MDA
nmol g-1 FM H2O2 µmol g-1 FM
NaCl Population Roots Leaves Roots Leaves
0 mM Taf 1Tata 9.87d9.56d 11.64d12.47d 0.35c0.39c 0.36c0.39c
100 mM Taf 1Tata 17.42c14.90c 22.27c20.10c 0.47c0.47c 0.51c0.47c
200 mM Taf 1Tata 32.04a24.22b 34.88b41.96a 0.82b1.08a 1.18b1.50a
F F F F
Salinity 92.3*** 271.5*** 222.8*** 290.3***
Population 10.01** 8.97* 9.68** 9.07*
S × P 3.94* 6.04* 15.28** 8.92**
plants were grown without salt stress, and when exposed to increased salinity the values were -18±2.08 mV and -13±2 mV, respectively.
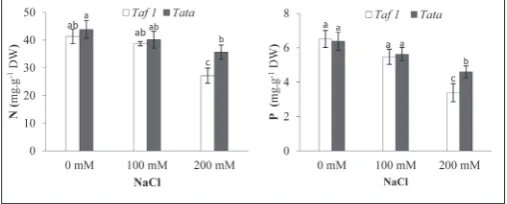
Effect on the N and P contents
The data reported in Fig. 5 show that under salt stress there was a significant (P<0.001) decrease in shoot P and N contents in the two alfalfa popu-lations, with significant (P<0.01) variation be-tween them with regard to the N content. The highest N value of 35.66 mg g-1 DW was displayed by the Tata population under 200 mM NaCl; this value did not exceed 27.13 mg g-1 DW in the Taf
1 population under the same conditions. The two populations exhibited high P con-tents under extreme salinity (Fig. 5). However, the Tata population had a higher P content of 4.60 mg g-1 DW in comparison to Taf 1, which presented only 3.38 mg g-1 DW under the same conditions. The interaction effect was not sig-nificant (P>0.05) for these nutritional elements.
DISCUSSION
In the present study, significant dry biomass reduction was found in the two studied alfal-fa genotypes, Tata and Taf 1, subjected to salt stress. Reduction in plant growth by salt stress has been well documented [1,21,31], although different physiological processes have been men-tioned to account for this reduction in different species. The salt tolerance of the two investi-gated alfalfa populations was associated with the ability of plants to maintain physiological and biochemical processes. Indeed, for almost all of the analyzed parameters in this experiment we found significant variations between the more and the less tolerant populations. Measurements of photosynthesis, chlorophyll fluorescence and chlorophyll content are often used in the evalu-ation of plant adaptevalu-ation to different environ-mental stresses such as salinity and drought [32, 33]. The observed reduction in these parameters clearly reflected the decrease in plant growth. Reduction of PN mainly resulted from reduced
gs [34]. Stomatal closure causes a decrease in
Fig. 1. Effect of salt treatment (0, 100 and 200 mM NaCl) on root (A) and shoot (B) POD activity in plants from two Moroccan alfalfa populations, Taf 1 and Tata. The results are means of three replicates and the bars are standard errors. Mean comparison was performed using the LSD test.
Fig. 2. Effect of salt treatment (0, 100 and 200 mM NaCl) on CAT activity in roots (A) and shoots (B) of plants from two Moroccan alfalfa populations, Taf 1 and Tata. The results are means of three replicates and the bars are standard errors. Mean comparison was performed using the LSD test.
the intracellular concentration of CO2 by limiting the entry of CO2 into the leaves, so that less CO2 is assimilated. Some studies have shown that inhibition of photosynthesis can also result from nonstomatal mechanisms, especially at high salt concentrations [6]. Our results for leaf gas exchange are consistent with those documented previously [8]. A measure of the integrity of the photosynthetic apparatus is the Fv/ Fm ratio, a parameter commonly known as maximum quantum yield of primary photochemistry or maximal relative electron transport rate of PS II [35,36] and the total chlorophyll content. As previously mentioned [37], leaf chlorophyll fluorescence responses to in-creasing salinity were manifested by reduced Fv/Fo and
Fv/Fm ratios. A similar observation was reported in [38]. The reduction in the Fv/Fm ratio due to salinity stress is possibly related to a reduction of chlorophyll levels under conditions of increased salinity [9]. Our data indicated that the reduction in PS II
efficien-cy was associated with a decrease in the total chlorophyll content. A decreasing chlorophyll content with increasing salinity of the rooting medium could be related to an increased activity of the chlorophyll degrading chlorophyllase [7], destruction of the chloroplast structure and a greater instability of pigment protein complexes [39]. All these effects reduce the carbon gain if plants are under salt stress and consequently, reduce plant growth [40,41].
The great reduction in plant biomass under conditions of increased salinity is paralleled by reductions in the N and P contents of plants. These elements are key nutrients that affect plant growth. Similar results were reported for Acacia
dealbata Link. [42]; it was shown that a gradual
decrease in the N contents accompanied an in-crease in the salinity. The dein-crease in plant total N under increased salinity can be attributed to the effect of the salinity on decreased biosynthesis of protein and/or the decrease in N fixation and/ or inhibition in nitrate reductase activity [43].
NaCl treatment caused a sustained depolar-ization of cortex cells in both populations, what-ever the growth conditions in terms of salinity. Membrane depolarization can, at best, provide a qualitative comparison of membrane conduc-tance of Na+ [44]. Similar results were previously reported in the root cortex of maize [45, 46]. Salt stress increases the formation of ROS through enhanced leakage of electrons to molecular oxygen [47]. ROS cause oxidative damage to different cellu-lar components, including membrane lipids, protein and nucleic acids [48]. The present study showed that the salt stress caused a significant increase in MDA and H2O2 in roots and leaves of plants. Determination of the MDA concentration and, hence, the extent of membrane lipid peroxidation, is often used as a tool to assess the severity of oxidative stress caused by abi-otic stressors [16, 49]. Similar data with regard to the accumulation of these components under conditions of increased salinity have been reported in many spe-cies, including M. sativa L. [3], Arabidopsis thaliana
L. and Cakile maritima Scop. [50]. Plants have devel-oped enzymatic process to protect cells from oxidative damage [11]. SOD is the primary ROS scavenger in plants subjected to salt stress, converting O2- to H
2O2
Fig. 4. Variation in membrane potentials in root cortical cells of plants from two Moroccan alfalfa populations, Taf 1 and Tata, grown in the absence of NaCl (A) or exposed to 200 mM NaCl for one week (B). The resting potential was measured for roots perfused with 1 mM CaCl2, 2mM Mes/Tris pH 6.0. Roots were exposed to the same perfusion solution supplemented with 100 mM NaCl to determine membrane depolarization. The results are means of three replicates and the bars are standard errors. Mean comparison was performed using the LSD test.
and O2, which leads to the activation of APX and GR that detoxify the remaining products of SOD activity in chloroplasts and the cytosol [18, 51]. CAT can also detoxify the H2O2 to H2O, but it has a lower affinity to H2O2 in comparison to SOD [52]. Our data indi-cated that salt treatment caused the increase in SOD activity, followed by CAT and POD, especially in the
Tata population, which seems to be more tolerant to salinity than Taf1. Similar results were noted in many plants, including wheat [53] and M. sativa L. [3, 16]. Wang et al. [54] reported that H2O2 and lipid peroxi-dation activate the antioxidant defense mechanisms. Hence, Tata plants that had high levels of antioxidant enzyme activities under increased salinity exhibited low H2O2 and MDA contents in their tissues. Our data indicate that antioxidant activities were higher in the roots than in the leaves. This may be explained by the sensitivity of the root system, as it is the first organ to be directly exposed to toxic ions, as well as osmotic stress in the soil [16,55].
CONCLUSION
Salt treatment caused a significant reduction in dry biomass of plants. Growth reduction was associated with perturbations in several physiological and bio-chemical parameters. Decreases were observed in the relative water content, leaf gas exchange, chlorophyll fluorescence, chlorophyll contents and nutrient con-centrations. In contrast, MDA and H2O2 levels were higher under salt stress. The two alfalfa populations responded with different sensitivities to salt stress. The Tata population was more tolerant to increased salinity, and this marked tolerance was associated with the ability of plants to maintain adequate levels of the examined parameters and with the ability to overcome oxidative stress by induction of antioxidant enzymes.
Acknowledgments: The present work was partially financed in
the framework of PRAD Project France-Morocco (PRAD N° 12-09). It was also supported by the Minister of Higher Education and Scientific Research, Morocco.
Author contributions: MF designed the research and wrote the paper; MM checked the results and the language; AB and OF helped in the experiment; CG checked the results.
Conflict of interest disclosure: The authors declare that there is no conflict of interest.
REFERENCES
1. Farissi M, Bouizgaren A, Faghire M, Bargaz A, Ghoulam C. Agro-physiological responses of Moroccan alfalfa (Medicago sativa L.) populations to salt stress during germination and early seedling stages. Seed Sci Technol. 2011;39:389-401. 2. Ashraf M. Some important physiological selection criteria
for salt tolerance in plants. Flora Morphol Distrib Funct Ecol Plant. 2004;199(5):361-76.
3. Wang WB, Kim YH, Lee HS, Kim KY, Deng XP, Kwak SS. Analysis of antioxidant enzyme activity during germination of alfalfa under salt and drought stresses. Plant Physiol Biochem. 2009;47(7):570-7.
4. Zhu JK. Regulation of ion homeostasis under salt stress. Curr Opin Plant Biol. 2003;6(5):441-5.
5. Suárez N. Effects of short-and long-term salinity on leaf water relations, gas exchange, and growth in Ipomoea pes-caprae. Flora-Morphol Distr Funct Ecol Plant. 2011;206(3):267-75. 6. Netondo GW, Onyango JC, Beck E. Sorghum and salinity.
Crop Sci. 2004;44(3):797-805.
7. Jamil M, Lee KJ, Kim JM, Kim H-S, Rha ES. Salinity reduced growth PS2 photochemistry and chlorophyll content in radish. Sci Agr. 2007;64(2):111-8.
8. Deng C, Zhang G, Pan X, Zhao K. Chlorophyll fluorescence and gas exchange responses of maize seedlings to saline-alka-line stress. Bulg J Agric Sci. 2010;16(1):49-58.
9. Ganieva RA, Allahverdiyev SR, Guseinova NB, Kavakli HI, Nafisi S. Effect of salt stress and synthetic hormone polystimu-line K on the photosynthetic activity of cotton (Gossypium hirsutum). Turk J Bot. 1998;22(4):217-22.
10. Bartels D, Sunkar R. Drought and salt tolerance in plants. Critic Rev Plant Sci. 2005;24(1):23-58.
11. Mittler R. Oxidative stress, antioxidants and stress tolerance. Trends Plant Sci. 2002;7(9):405-10.
12. Amudha J, Balasubramani G. Recent molecular advances to combat abiotic stress tolerance in crop plants. Biotechnol Mol Biol Rev. 2011;6(2):31-58.
13. Ghoulam C, Foursy A, Fares K. Effects of salt stress on growth, inorganic ions and proline accumulation in relation to osmotic adjustment in five sugar beet cultivars. Environ Exp Bot. 2002;47(1):39-50.
14. Mhadhbi H, Aouani ME. Growth and nitrogen-fixing perfor-mances of Medicago truncatula-Sinorhizobium meliloti sym-bioses under salt (NaCl) stress: Micro- and macro-symbiont contribution into symbiosis tolerance. In: Abdelly C, Öztürk M, Ashraf M, Grignon C, editors. Biosaline Agriculture and High Salinity Tolerance. Basel: Birkhäuser; 2008. p. 91-8. 15. França M, Panek A, Eleutherio E. Oxidative stress and its
effects during dehydration. Comp Biochem Physiol A Mol Integr Physiol. 2007;146(4):621-31.
16. Mouradi M, Bouizgaren A, Farissi M, Qaddoury A, Ghoulam C. Medicago sativa-rhizobia symbiosis under water deficit: Physiological, antioxidant and nutritional responses in nod-ules and leaves. J Plant Nutr. 2018;41(3):384-95.
18. Lee DH, Kim YS, Lee CB. The inductive responses of the anti-oxidant enzymes by salt stress in the rice (Oryza sativa L.). J Plant Physiol. 2001;158(6):737-45.
19. Mhadhbi H, Fotopoulos V, Mylona PV, Jebara M, Elarbi Aouani M, Polidoros AN. Antioxidant gene-enzyme responses in Medicago trancatula genotypes with different degree of sen-sitivity to salinity. Physiol Plant. 2011;141(3):201-14. 20. Farissi M, Ghoulam C, Bouizgaren A. Changes in water deficit
saturation and photosynthetic pigments of Alfalfa populations under salinity and assessment of proline role in salt tolerance. Agric Sci Res J. 2013;3(1):29-35.
21. Farissi M, Bouizgaren A, Faghire M, Bargaz A, Ghoulam C. Agrophysiological and biochemical properties associated with adaptation of Medicago sativa populations to water deficit. Turk J Bot. 2013;37(6):1166-75.
22. Arnon DI. Copper enzymes in isolated chloroplasts. polyphe-noloxidase in Beta vulgaris. Plant Physiol. 1949;24(1):1-15. 23. Dhindsa RS, Plumb-Dhindsa P, Thorpe TA. Leaf senescence:
correlated with increased levels of membrane permeability and lipid peroxidation, and decreased levels of superoxide dismutase and catalase. J Exp Bot. 1981;32(1):93-101. 24. Velikova V, Yordanov I, Edreva A. Oxidative stress and some
antioxidant systems in acid rain-treated bean plants: protective role of exogenous polyamines. Plant Sci. 2000;151(1):59-66. 25. Hori K, Wada A, Shibuta T. Changes in Phenoloxidase
Activi-ties of the Galls on Leaves of Ulmus davidana Formed by Tet-raneura fuslformis (Homoptera: Eriosomatidae). Appl Entomol Zool. 1997;32(2):365-71.
26. Gong Y, Toivonen PM, Lau O, Wiersma PA. Antioxidant sys-tem level in’Braeburn’apple is related to its browning disorder. Bot Bull Acad Sinica. 2001;42:259-64.
27. Chagas RM, Silveira JA, Ribeiro RV, Vitorello VA, Carrer H. Photochemical damage and comparative performance of superoxide dismutase and ascorbate peroxidase in sugarcane leaves exposed to paraquat-induced oxidative stress. Pestic Biochem Physiol. 2008;90(3):181-8.
28. Mian A, Oomen RJ, Isayenkov S, Sentenac H, Maathuis FJ,
Véry AA. Over‐expression of an Na+‐and K+‐permeable
HKT transporter in barley improves salt tolerance. Plant J. 2011;68(3):468-79.
29. Murphy J, Riley JP. A modified single solution method for the determination of phosphate in natural waters. Anal Chim Acta. 1962;27:31-6.
30. Burris RH, Wilson PW. Methods for measurement of nitrogen fixation. Methods Enzymol. 1957;4:355-66.
31. D’Souza , Devaraj VR. Biochemical responses of Hyacinth bean (Lablab purpureus) to salinity stress. Acta Physiol Plant. 2010;32(2):341-53.
32. Mouradi M, Farissi M, Bouizgaren A, Makoudi B, Kabbadj A, Very A-A, Sentenac H, Qaddourya A, Ghoulam C. Effects of water deficit on growth, nodulation and physiological and biochemical processes in Medicago sativa-rhizobia symbiotic association. Arid Land Res Manag. 2016;30(2):193-208. 33. Smillie RM, Nott R. Salt tolerance in crop plants
moni-tored by chlorophyll fluorescence in vivo. Plant Physiol. 1982;70(4):1049-54.
34. Farquhar GD, Ehleringer JR, Hubick KT. Carbon isotope discrimination and photosynthesis. Annu Rev Plant Biol. 1989;40(1):503-37.
35. Mouradi M, Bouizgaren A, Farissi M, Latrach L, Qaddoury A, Ghoulam C. Seed osmopriming improves plant growth, nodulation, chlorophyll fluorescence and nutrient uptake in alfalfa (Medicago sativa L.)–rhizobia symbiosis under drought stress. Sci Hort. 2016;213:232-42.
36. Waldhoff D, Furch B, Junk WJ. Fluorescence parameters, chlorophyll concentration, and anatomical features as indi-cators for flood adaptation of an abundant tree species in
Central Amazonia: Symmeria paniculata. Environ Exp Bot.
2002;48(3):225-35.
37. Percival GC, Fraser GA, Oxenham G. Foliar salt tolerance of Acer genotypes using chlorophyll fluorescence. Arboric J. 2003;29(2):61-5.
38. Lu C, Qiu N, Lu Q, Wang B, Kuang T. Does salt stress lead to increased susceptibility of photosystem II to photoinhi-bition and changes in photosynthetic pigment composi-tion in halophyte Suaeda salsa grown outdoors? Plant Sci. 2002;163(5):1063-8.
39. Singh A, Dubey R. Changes in chlorophyll a and b con-tents and activities of photosystems 1 and 2 in rice seed-lings induced by NaCl. Photosynthetica (Czech Republic). 1995;31:489-99.
40. Ghassemi-Golezani K, Taifeh-Noori M, Oustan S, Moghad-dam M, Rahmani SS. Physiological performance of soy-bean cultivars under salinity stress. J Plant Physiol Breed. 2011;1(1):1-7.
41. Khan MN, Siddiqui MH, Mohammad F, Khan M, Naeem M. Salinity induced changes in growth, enzyme activities, pho-tosynthesis, proline accumulation and yield in linseed geno-types. World J Agric Sci. 2007;3(5):685-95.
42. Hopmans P, Douglas L, Chalk P. Nitrogen fixation associ-ated with Acacia dealbata Link. seedlings as estimated by the acetylene reduction assay. Aust J Bot. 1983;31(4):331-9. 43. Mohammed A. Physiological aspects of mungbean plant
(Vigna radiata L. Wilczek) in response to salt stress and gib-berellic acid treatment. Res J Agr Biol Sci. 2007;3:200-13. 44. Laurie S, Feeney KA, Maathuis FJ, Heard PJ, Brown SJ, Leigh
RA. A role for HKT1 in sodium uptake by wheat roots. Plant J. 2002;32(2):139-49.
45. Wegner LH, Stefano G, Shabala L, Rossi M, Mancuso S, Sha-bala S. Sequential depolarization of root cortical and stelar cells induced by an acute salt shock–implications for Na+ and K+ transport into xylem vessels. Plant, Cell Environ. 2011;34(5):859-69.
46. Hua J-m, Wang X-l, Zhai F-q, Feng Y, Ke F. Effects of NaCl and Ca2+ on membrane potential of epidermal cells of maize roots. Agric Sci China. 2008;7(3):291-6.
47. Arora A, Sairam R, Srivastava G. Oxidative stress and anti-oxidative system in plants. Curr Sci. 2002:1227-38. 48. Sharma P, Jha AB, Dubey RS, Pessarakli M. Reactive
Oxy-gen Species, Oxidative Damage, and Antioxidative Defense Mechanism in Plants under Stressful Conditions. J Bot. 2012;2012:26.
49. Amor NB, Hamed KB, Debez A, Grignon C, Abdelly C. Physi-ological and antioxidant responses of the perennial halophyte Crithmummaritimum to salinity. Plant Sci. 2005;168(4):889-99.
status of Cakile maritima (halophyte) and Arabidopsis thaliana (glycophyte). Physiol Plant. 2011;142(2):128-43.
51. Cheeseman JM. Hydrogen peroxide and plant stress: a chal-lenging relationship. Plant Stress. 2007;1(1):4-15.
52. Gratão PL, Polle A, Lea PJ, Azevedo RA. Making the life of heavy metal-stressed plants a little easier. Funct Plant Biol. 2005;32(6):481-94.
53. Esfandiari E, Shekari F, Shekari F, Esfandiari M. The effect of salt stress on antioxidant enzymes’ activity and lipid
per-oxidation on the wheat seedling. Not Bot Horti Agrobot Cluj Napoca. 2007;35(1):48.
54. Wang J, Zeng Q, Zhu J, Liu G, Tang H. Dissimilarity of ascor-bate–glutathione (AsA–GSH) cycle mechanism in two rice (Oryza sativa L.) cultivars under experimental free-air ozone exposure. Agric Ecosyst Environ. 2013;165:39-49.